4438
Using free waveform diffusion MRI to investigate time-dependence of water movement in an isotropic in vitro system1Medical Biophysics, University of Toronto, Toronto, ON, Canada, 2Physical Sciences, Sunnybrook Research Institute, Toronto, ON, Canada, 3Radiation Oncology, Sunnybrook Health Sciences Centre, Toronto, ON, Canada
Synopsis
Signal attenuation due to diffusion is affected by several different acquisition parameters, such as gradient duration, spacing, strength and shape. In this study, I used free waveforms to investigate the effect of non-rectangular pulses. I chose an isotropic in vitro system such that the signal represents time and spatial scales relevant to human imaging and is independent of orientation. By varying only the gradient shape to target certain q-space frequencies, the signal measured could represent different combinations of diffusion time.
Introduction
Advancements in gradient control and strength1 gives the freedom to prescribe complex gradient waveforms, which probe microscopic diffusion anisotropy, and can be analyzed by methods such as in DIfussional VarIance DEcomposition (DIVIDE)2. However, aside from simpler oscillating gradient cases, analysis of these complex waveforms typically neglects diffusion time-dependence. For example, DIVIDE predicts that, in systems that are microscopically isotropic, gradients that produce conventional linear b-tensor shapes will demonstrate the same signal decay with b-value as gradients that produce spherical b-tensor shapes, regardless of the gradients’ temporal characteristics. This assumption is likely valid in highly restricted environments or in the absence of restrictions, but may not apply in larger cells. Here, we examined the effect of gradient time-dependence on the diffusion signal in an in vitro cell system with low microscopic anisotropy and propose an analysis method to account for restriction effects.Methods
An acute myeloid leukemia cell line (AML-5) was cultured in suspension with alpha-MEM, FBS and penicillin/streptomycin. Apoptosis was induced with 10 μg/mL of cisplatin for 36 hours. Control cells were untreated. Each group was centrifuged at 2400 g to pack the cells into a pellet. Approximately 1x10⁹ cells were used in each NMR tube.A 7T vertical small bore Bruker scanner was used with a 40/30 mm quadrature receive and transmit coil. Diffusion was quantified with four different preparations of user-defined diffusion gradient shape (from Medical College of Wisconsin, available on the Open Science Framework3) with TR=1.5s, 5 b-values=0-3000s/mm2. The gradient waveforms for spherical b-tensors (1 direction) are shown in Figure 1 for two gradient durations (20 and 50 ms with TE=67 and 127 ms, respectively) alongside the corresponding q-space power spectrum. Linear b-tensors were constructed from the z-channel of the spherical waveform and run in 6 directions. A pulsed-gradient stimulated echo (PGSTE) sequence with square gradient waveforms (1 direction, 7 b-values=0-5000s/mm2, TE/TR=35ms/1.5s, 7 TM=6.7-233ms) was run for comparison.
Diffusion signal for the four preparations was fitted with the Camino diffusion MRI toolkit4 via the matrix method for generalized gradient waveforms and a ball sphere model, where the ball represents the extracellular space and the sphere represents the cells. For free waveform fitting, the diffusivity was fixed to 1.1 µm2/ms.
Results
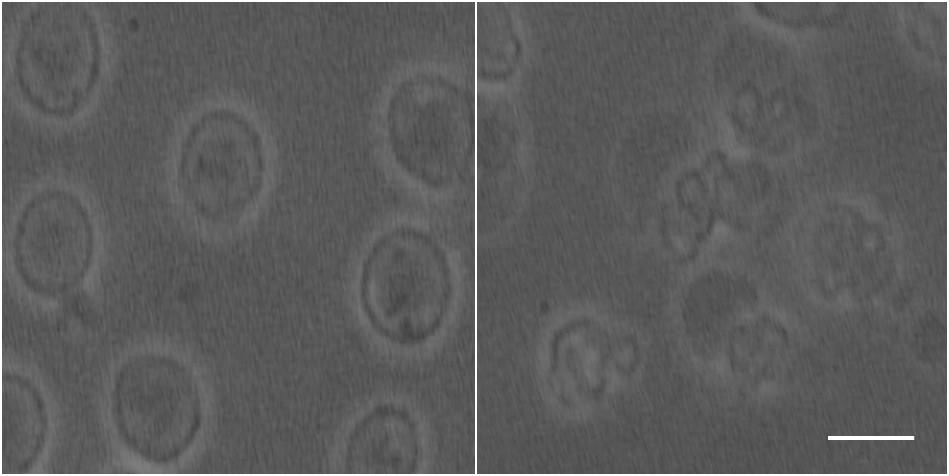
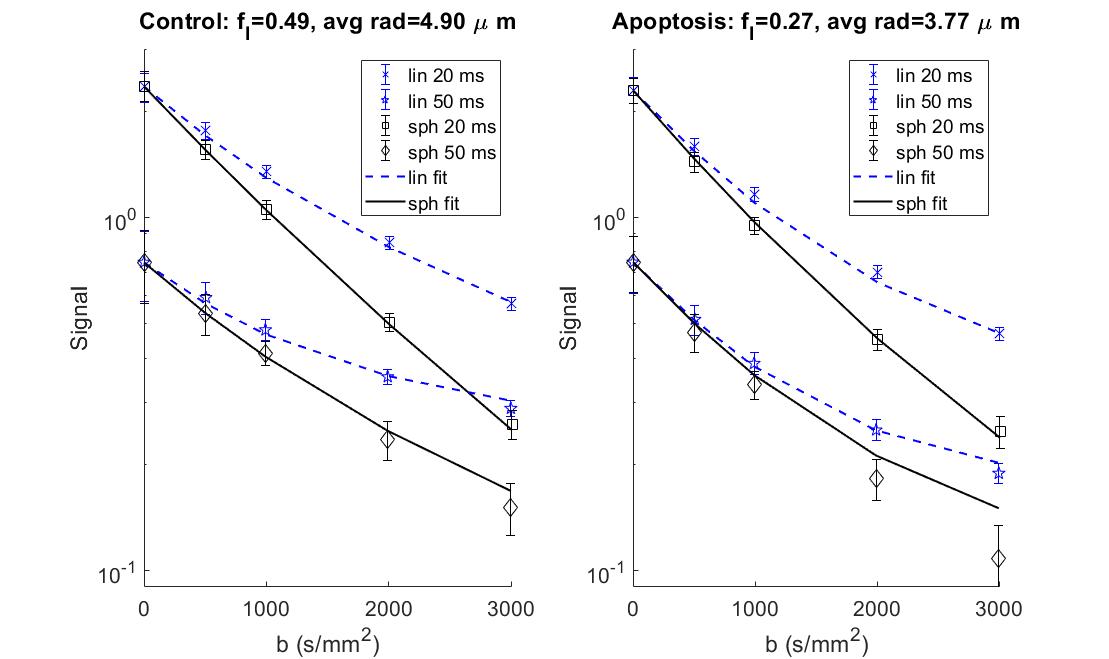
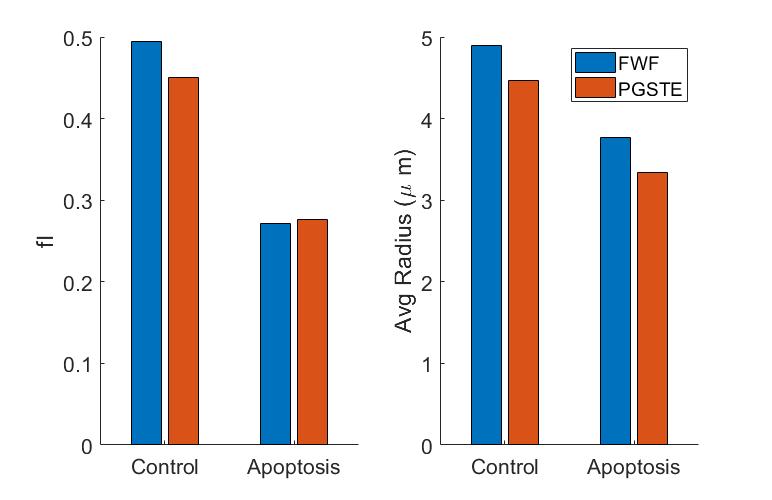
Phase contrast microscopy showed that the AML cells were spherical with an approximate radius of 5 μm (Figure 2).For both the 20 and 50 ms gradient duration, the linear tensor encoding showed a lower apparent diffusion coefficient (ADC) compared to the spherical tensor encoding (Figure 3). The fit parameters using the ball sphere model with the matrix method are shown in Figure 4 in comparison with the PGSTE fit parameters.
Discussion/Conclusion
AML represents an isotropic system since AML cells are naturally spherical and were grown in isolation of any immune response or extracellular matrix. With this isotropic consideration, the signal attenuation for linear and spherical tensor encoding was expected to be the same throughout the b-value range for the same gradient duration. Surprisingly, our results for the same gradient duration showed an increasing difference in signal between the linear and spherical tensor encoding with respect to diffusion weighting.The shape of the free gradient waveform likely caused the aforementioned difference in signal. The q-space power spectrum revealed that the linear and spherical tensor encoding had different effective diffusion times. The lower frequencies correspond to longer diffusion times, while higher frequencies correspond to shorter diffusion times. The linear case had more weighting towards the longer diffusion times relative to the spherical case. The longer diffusion times resulted in a lower ADC likely due to increased restriction of water by the cell membrane at these longer times.
PGSTE was used to validate that the difference in signal between the linear and spherical tensor encoding was due to the different effective diffusion times. The intracellular volume fraction and average diameter from the ball sphere model agreed between PGSTE and the free waveform data fits. Furthermore, the model’s estimate of cell radius, 4.9 µm for control cells, agrees well with the cell diameter observed by phase microscopy and the decrease in cell size for cisplatin-treated cells is consistent with the expected changes during apoptosis. The fitted intracellular diffusivity from the PGSTE fit was 0.69 µm2/ms was lower than the fixed value used for fitting the free waveform data, but it has been demonstrated that the fit has low sensitivity to this parameter unless short diffusion times are present5.
This work demonstrates the importance of considering time-dependence when using complex gradient waveforms to examine microscopic features, as has been previously noted6. Here, we demonstrate that the matrix method can be used to accurately account for restriction effects with these waveforms. Future work will investigate different permutations of diffusion times for linear and spherical tensor encoding, including waveforms with matched power spectra, and with the addition of planar tensor encoding.
Acknowledgements
We would like to acknowledge MRI protocols and assistance from Wilfred Lam and Ryan Oglesby; cell work assistance from Anoja Giles. Funding/support provided by NVIDIA GPU seeding grant, Sunnybrook Foundation and Queen Elizabeth II/Sunnybrook and Women’s College Health Sciences Centre Graduate Scholarship in Science and Technology.References
1. Chilla GS, Tan CH, Xu C, Poh CL. Diffusion weighted magnetic resonance imaging and its recent trend—a survey. Quant Imaging Med Surg. 2015;5(3):16.
2. Szczepankiewicz F, Sjölund J, Ståhlberg F, Lätt J, Nilsson M. Tensor-valued diffusion encoding for diffusional variance decomposition (DIVIDE): Technical feasibility in clinical MRI systems. Chen X, ed. PLOS ONE. 2019;14(3):e0214238. doi:10.1371/journal.pone.0214238
3. Skinner NP, Kurpad SN, Schmit BD, Budde MD. Detection of acute nervous system injury with advanced diffusion-weighted MRI: a simulation and sensitivity analysis: DIFFUSION MICROANISOTROPY OF NEURITE BEADING. NMR Biomed. 2015;28(11):1489-1506. doi:10.1002/nbm.3405
4. Cook PA, Bai Y, Nedjati-Gilani S, et al. Camino: Open-Source Diffusion-MRI Reconstruction and Processing. :1.
5. Li H, Jiang X, Xie J, Gore JC, Xu J. Impact of transcytolemmal water exchange on estimates of tissue microstructural properties derived from diffusion MRI. Magn Reson Med. 2017;77(6):2239-2249. doi:10.1002/mrm.26309
6. Lundell H, Nilsson M, Westin C-F, Topgaard D, Lasič S. Spectral anisotropy in multidimensional diffusion encoding. In: ISMRM. Vol 26. 0887. ; 2018. https://cds.ismrm.org/protected/18MPresentations/abstracts/0887.html.
Figures