4436
Tackling Degeneracy in Linear Tensor Encoding Diffusion MRI1Biomedical Engineering, UNC-Chapel Hill, Chapel Hill, NC, United States, 2Department of Radiology and BRIC, UNC-Chapel Hill, Chapel Hill, NC, United States
Synopsis
Model degeneracy in diffusion MRI could lead to misestimation of microstructural properties. This work presents a metric to characterize the degree of degeneracy and proposes a strategy to break degeneracy by utilizing both diffusion-weighted signal and its spherical mean. We will demonstrate that breaking the degeneracy results in more accurate quantification of microstructure.
Introduction
The accuracy in the quantification of microstructure using linear tensor encoding diffusion MRI is affected by the degeneracy that stems from the interplay of diffusion anisotropy and orientation dispersion. The spherical mean signal resulting from anisotropic diffusion could be mistaken as isotropic diffusion at a distribution of scales, and vice versa. Multiple strategies have been designed to address these degeneracy issues [1-4] but they rely on simplifying assumptions or data collected with alternative diffusion encoding schemes. Here, we introduce a metric to characterize the degree of degeneracy and propose a remedy to mitigate the effects of the degeneracy.Methods
Degeneracy Index:Restriction Spectrum Imaging (RSI) [5] models anisotropic compartments using a spectrum of cylindrically symmetric Gaussian response functions (atoms) with fixed axial diffusivity (AD) and multiple radial diffusivity (RD) and two isotropic compartments modeled as spheres. We relax the assumption of RSI and vary both the AD of the anisotropic compartments and the isotropic diffusivity to model the signal $$$S$$$ as
\begin{equation}S=R\beta,\end{equation}
where $$$R$$$ is a matrix containing fiber orientation distribution functions (FODFs) and $$$\beta$$$ is a matrix of spherical harmonic (SH) coefficients. Tikhonov regularization is used with weight $$$\gamma$$$ to obtain the solution:
\begin{equation}\hat{\beta} = (R^{T}R+\gamma I)^{-1}R^{T}S.\end{equation}
Due to degeneracy, purely isotropic diffusion might result in non-zero anisotropic volume fractions (VF) with FODFs of anisotropic compartments degenerating to become isotropic. We characterize the degree of isotropy for each anisotropic compartment based on the generalized fractional anisotropy (GFA):
\begin{equation}\text{ISO} = \sqrt{1-\text{GFA}^2}.\end{equation}
To identify the degenerate compartments, we threshold the ISO at 0.95:
\begin{equation}\Upsilon=\begin{cases}1, \text{ISO} \geq 0.95,\\0, \text{otherwise}.\\\end{cases}\end{equation}
Anisotropic compartments with $$$\Upsilon=1$$$ are affected by the degeneracy. We assess degeneracy's severity by degeneracy index (DI), which is a linear combination based on the respective volume fraction $$$f$$$ of each anisotropic compartment:
\begin{equation}\text{DI} = \sum_{i}f_i \Upsilon_i.\end{equation}
DI ranges from 0 to 1 with a higher value indicating greater degeneracy. If either isotropy or volume fraction is low (i.e., low DI), the degeneracy's effect is negligible.
Breaking the Degeneracy:
We combine RSI and Spherical Mean Spectrum Imaging (SMSI) [6] to address the degeneracy. First, we estimate the SH coefficients from RSI and penalize FODFs with high ISOs to obtain the adjusted VF of each degenerate anisotropic compartment $$$f_\text{adj-RSI}$$$.
Next, we estimate the VF $$$f_\text{SMSI}$$$ for each compartment via SMSI via an elastic net formulation:
\begin{align}\underset{f_\text{SMSI} \geq 0}{\min}{\left\| \begin{pmatrix} A\\ \sqrt{\gamma_{2}}I \end{pmatrix} f_\text{SMSI} - \begin{pmatrix} \bar{S}\\ 0 \end{pmatrix} \right\|_2^2}+\gamma _{1}\|f_\text{SMSI}\|_{1},\end{align}
where $$$A$$$ is a matrix containing spherical mean signal of each compartment, $$$\bar{S}$$$ is the normalized spherical mean signal, and the $$$\gamma$$$'s are regularization parameters.
Finally, the accurate tissue volume fraction $$$\hat{f}$$$ is obtained with iterative reweighted L1-regularization:
\begin{equation}\underset{\hat{f}_j \geq 0}{\min}{\left\| \begin{pmatrix} A\\ \sqrt{\gamma_{2}}I \end{pmatrix} \hat{f}_j - \begin{pmatrix} \bar{S}\\ 0 \end{pmatrix} \right\|_2^2}+\gamma _{1}\|\text{diag}(w_j) \hat{f}_j\|_{1},\end{equation}
where $$$w_j =\frac{1}{0.1 + \hat{f}_{j-1}}$$$ with $$$\hat{f}_0$$$ set to the geometric mean of $$$f_\text{SMSI}$$$ and $$$f_\text{adj-RSI}$$$. Combination of RSI and SMSI allows disambiguation of anisotropic and istropic diffusion in the case where the spherical mean signal fails to distinguish between the two.
Results
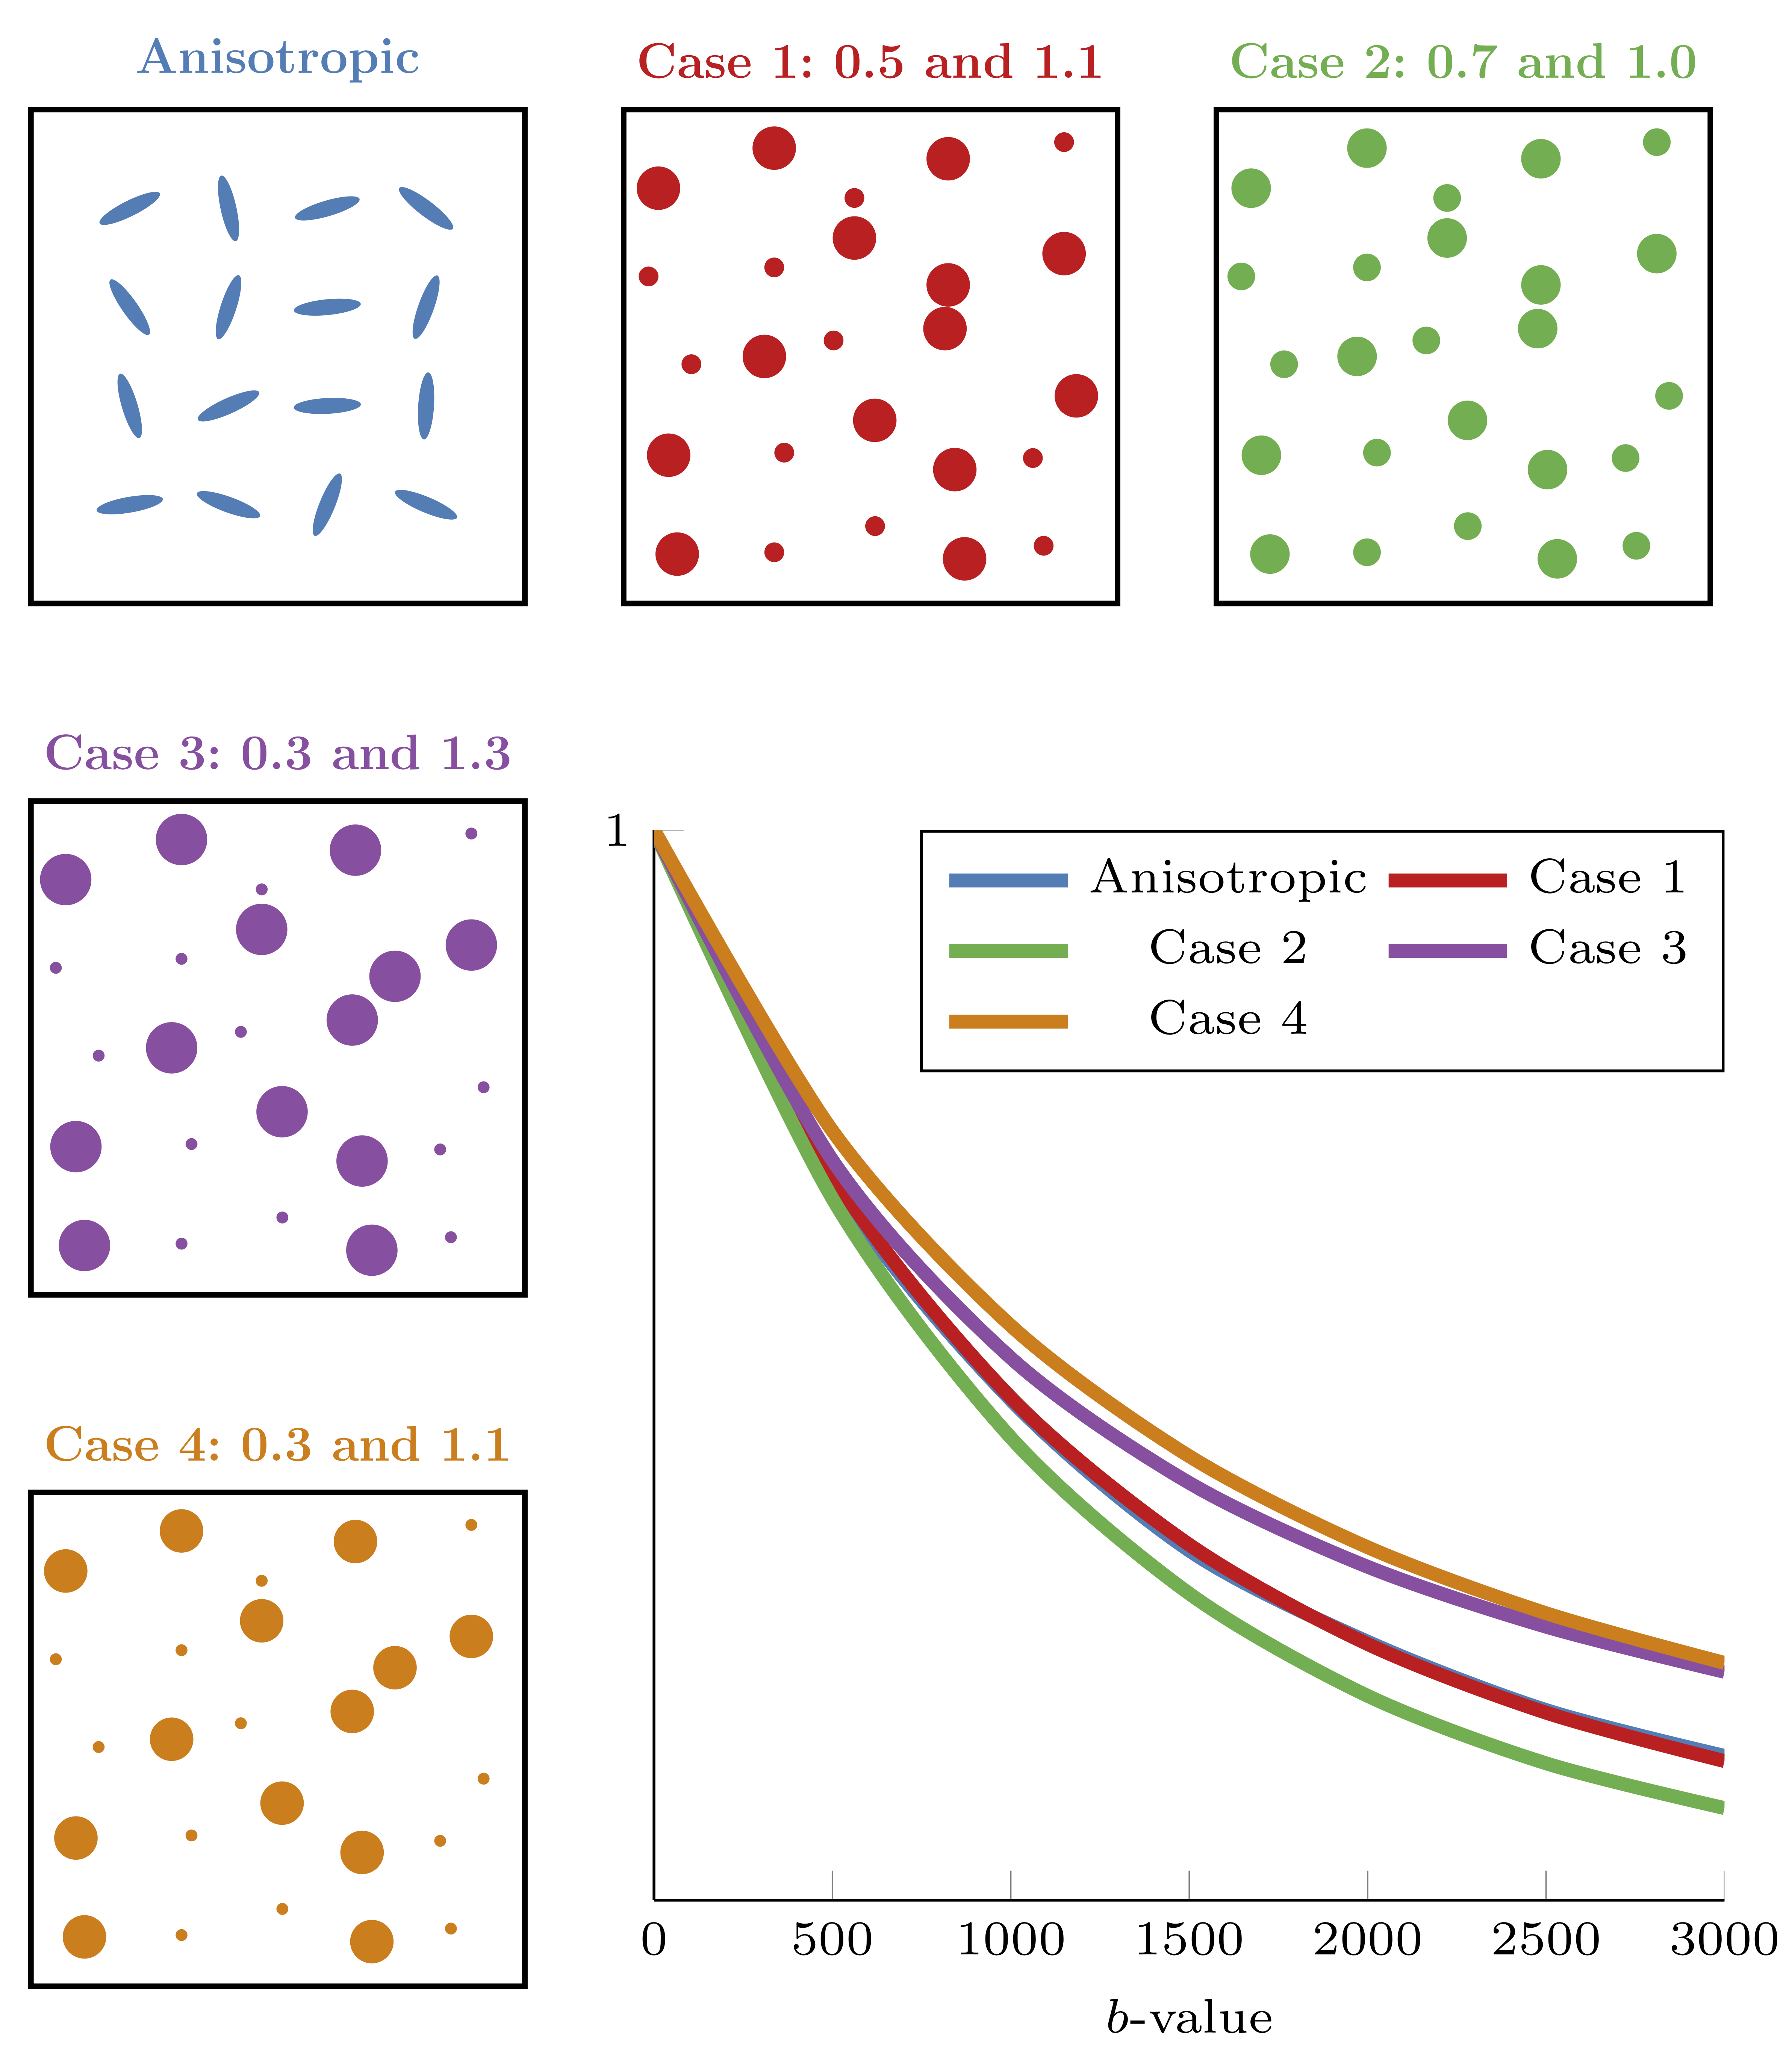
Degenerated Signal:We illustrated the degeneracy problem by simulating diffusion-weighted signal from different configurations:
- Anisotropic: Zeppelin with $$$\text{AD}=1.7\,\mu \text{m}^2\text{/}\text{ms}$$$ and $$$\text{RD}=0.4\,\mu \text{m}^2\text{/}\text{ms}$$$.
- Case 1: $$$0.5$$$ and $$$1.1\,\mu \text{m}^2\text{/}\text{ms}$$$.
- Case 2: $$$0.7$$$ and $$$1.0\,\mu \text{m}^2\text{/}\text{ms}$$$.
- Case 3: $$$0.3$$$ and $$$1.3\,\mu \text{m}^2\text{/}\text{ms}$$$.
- Case 4: $$$0.3$$$ and $$$1.1\,\mu \text{m}^2\text{/}\text{ms}$$$.
Numerical Evaluation:
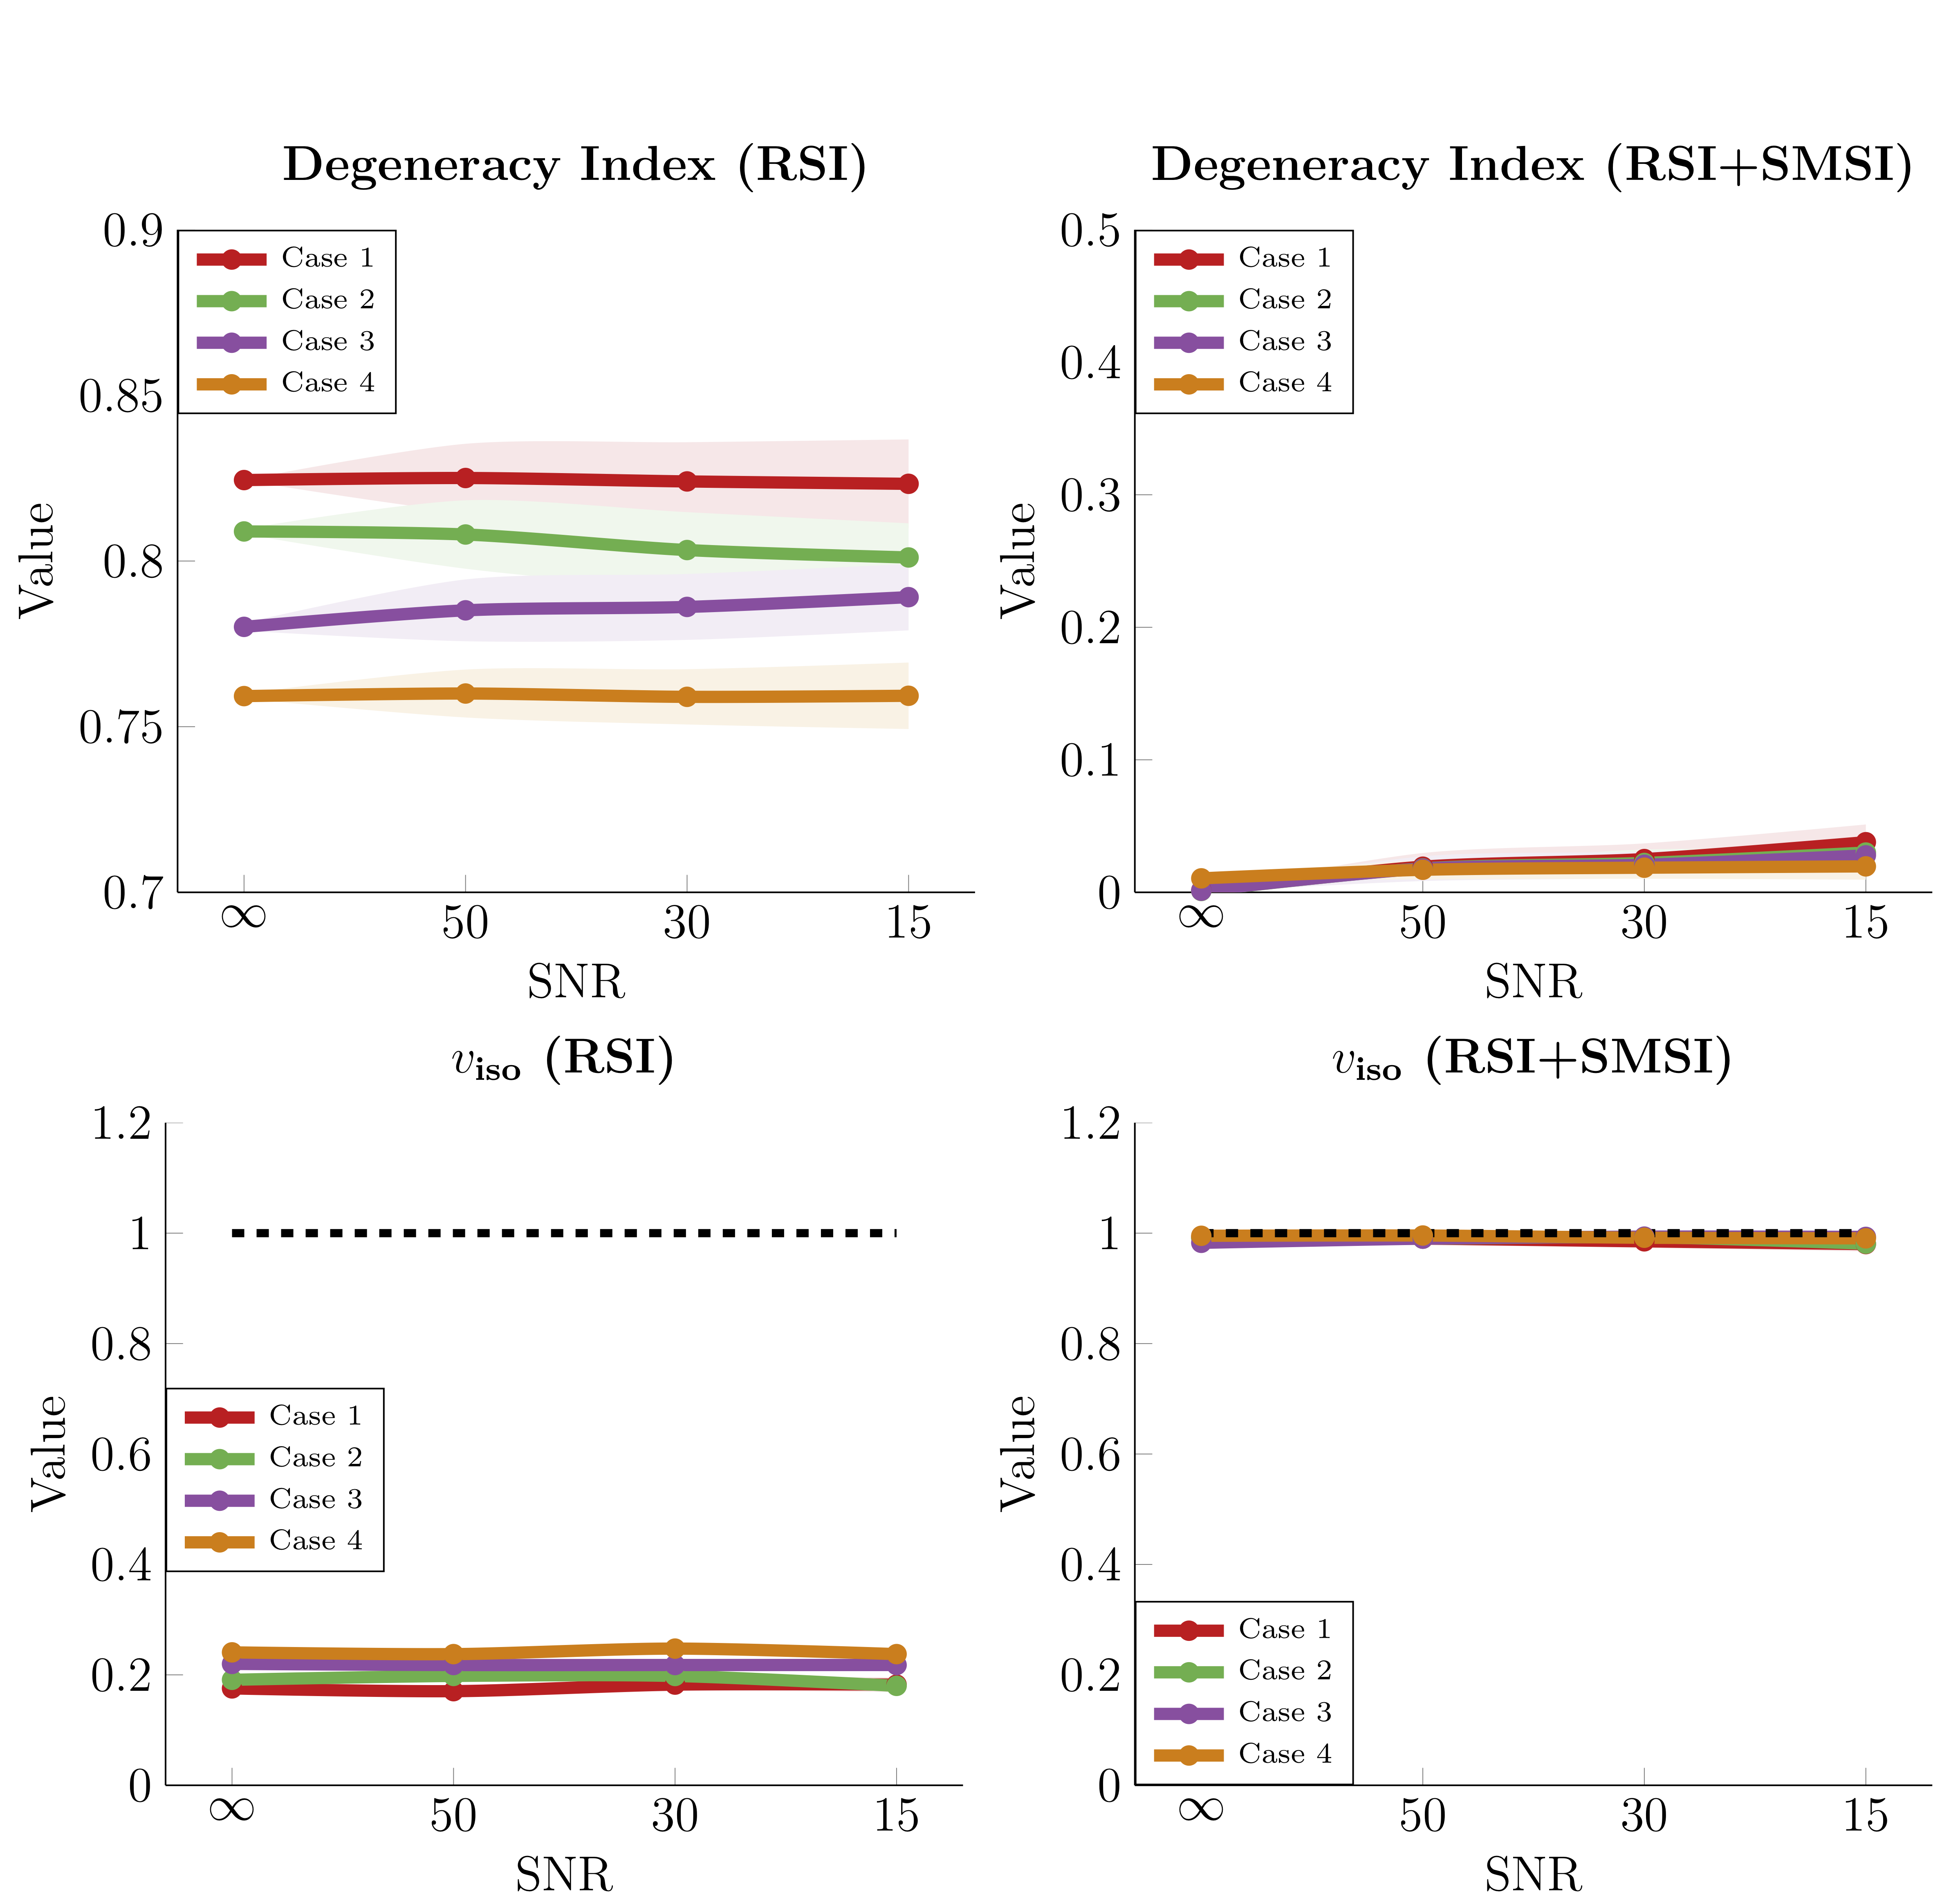
We calculated the DI for four isotropic cases using RSI VF from $$$\hat{\beta}$$$ and the proposed RSI+SMSI VF $$$\hat{f}$$$. From Fig.2, the DI values for RSI indicates that the estimated VF is not reliable. The isotropic VF ($$$v_\text{iso}$$$) from RSI for all cases are approximately 0.2, far below the ground truth of 1. Among the four cases, case 1 has the highest DI value as its mean signal is closest to the `Anisotropic' case. RSI+SMSI yields low DI in all cases (less than 0.05), proving that RSI+SMSI can disambiguate the degenerate cases to obtain more accurate results. $$$v_\text{iso}$$$ from RSI+SMSI is thus accurate and closer to ground truth.
In-vivo Evaluation:
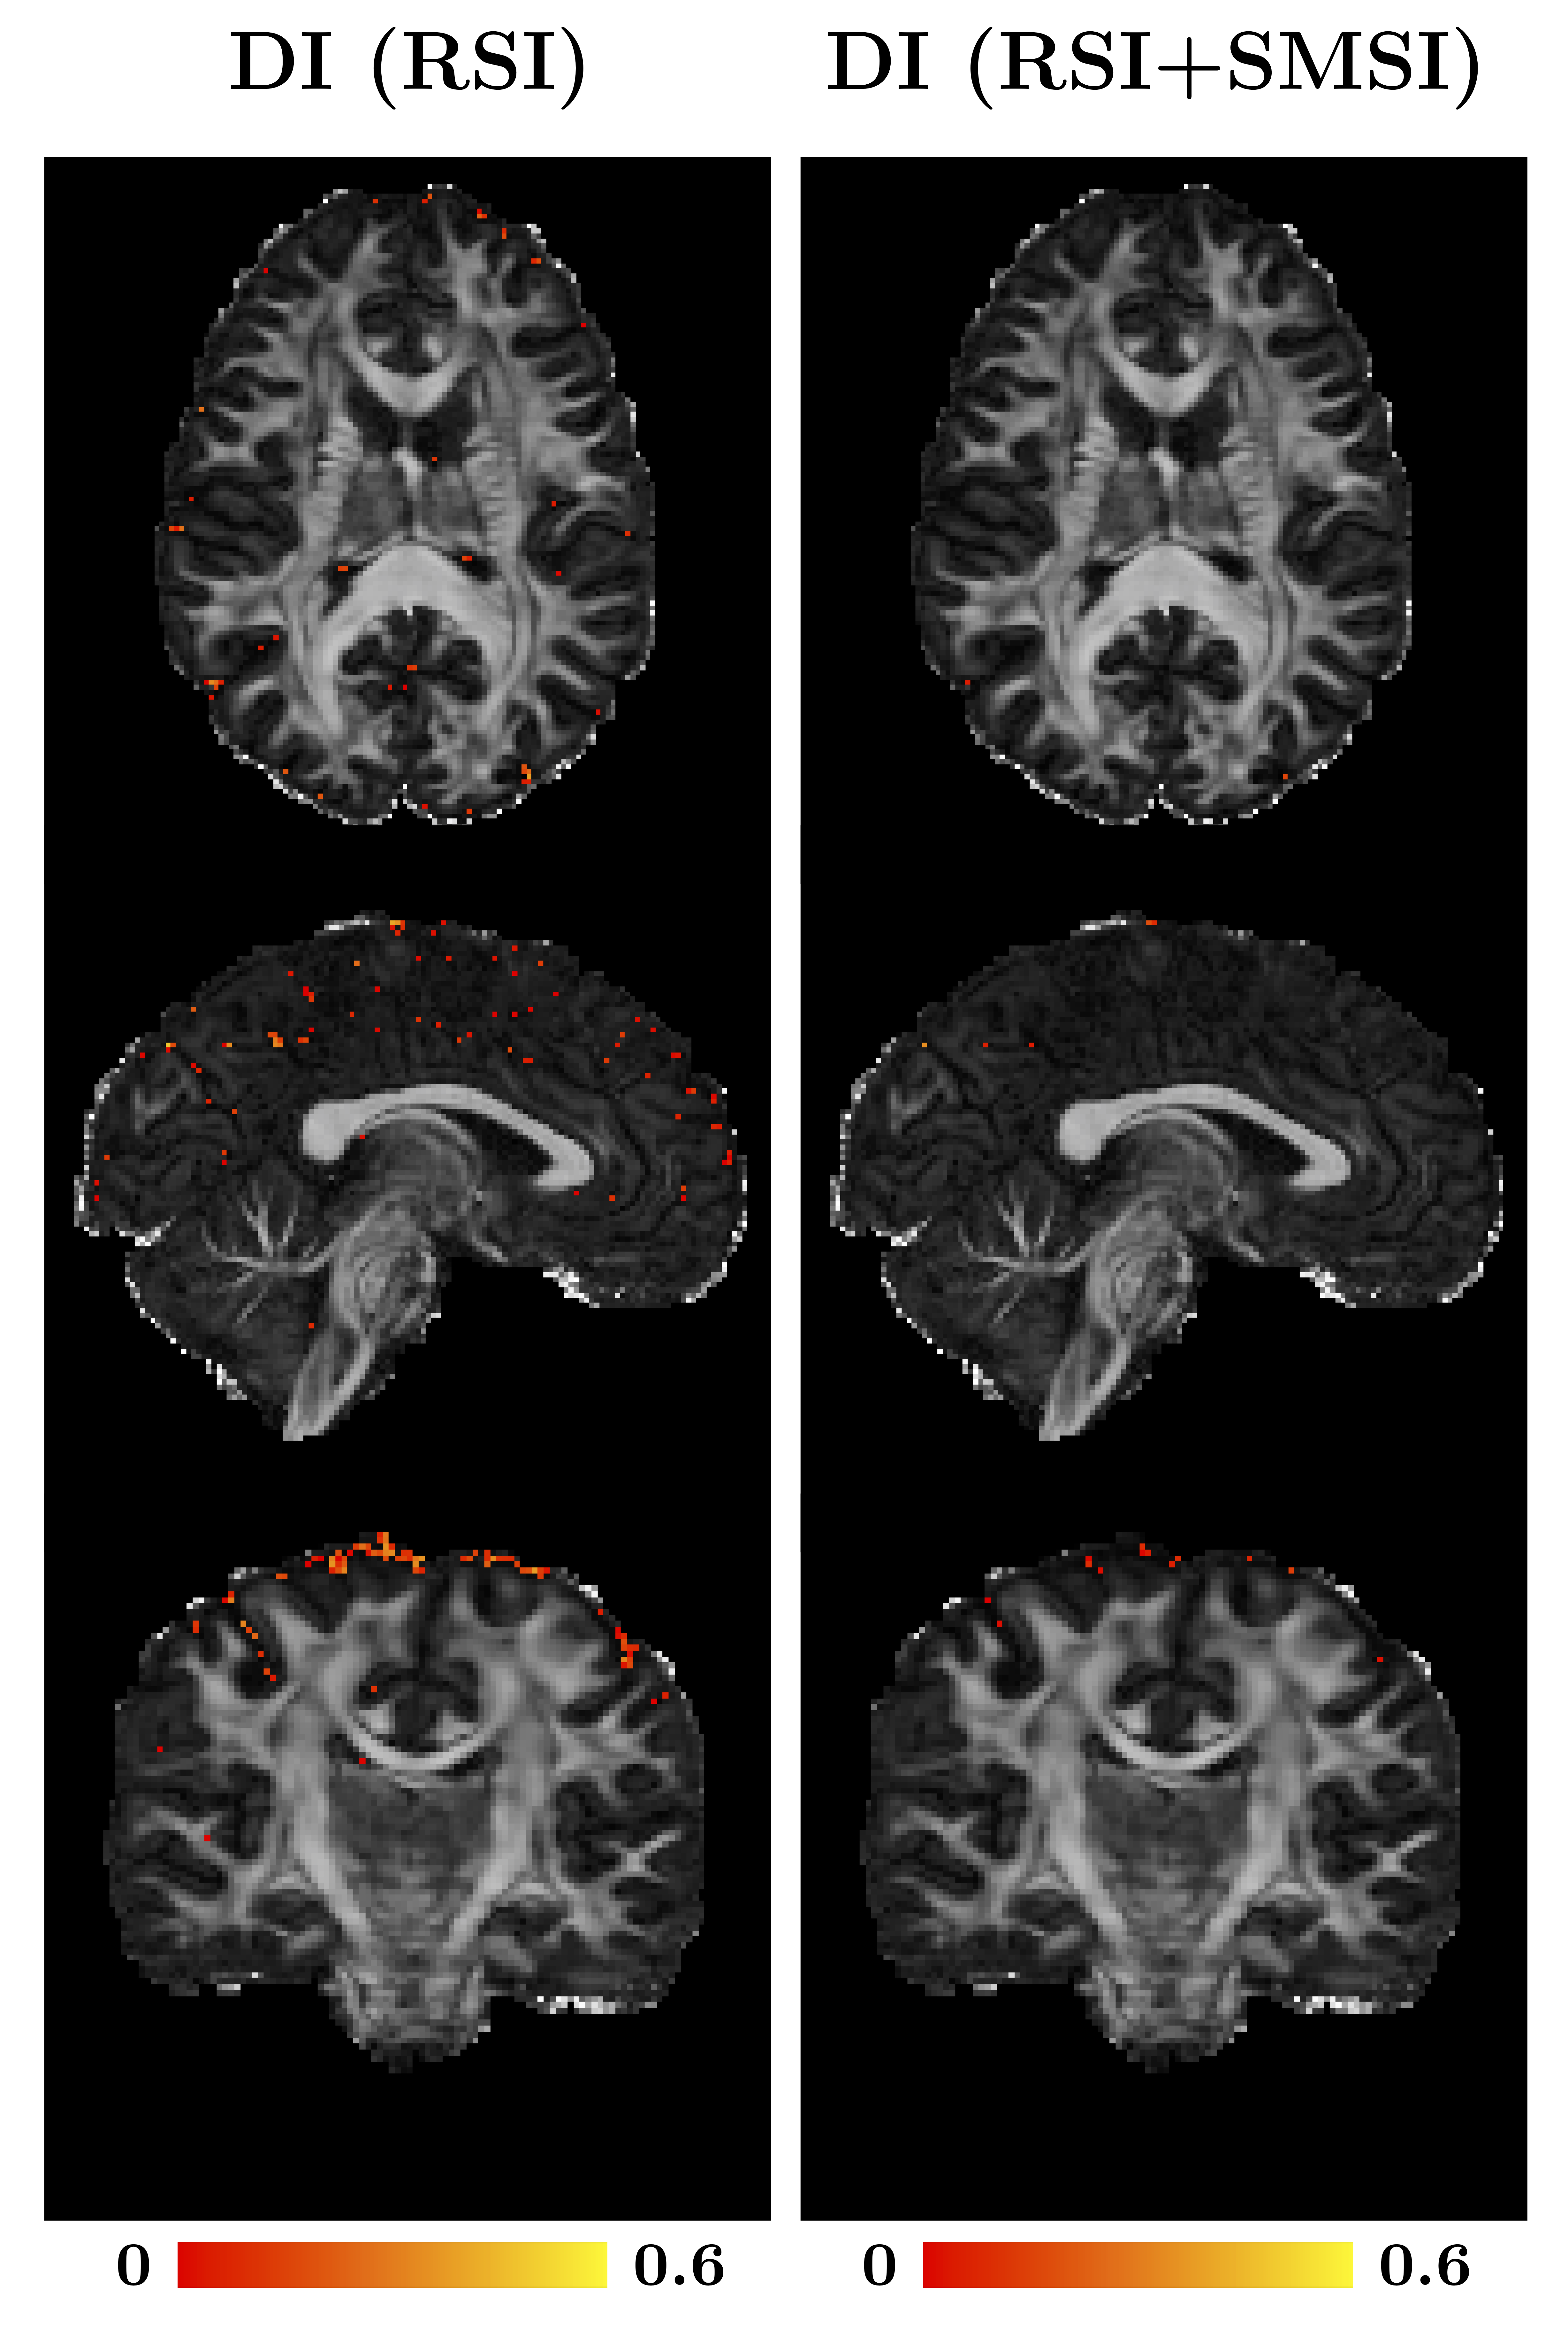
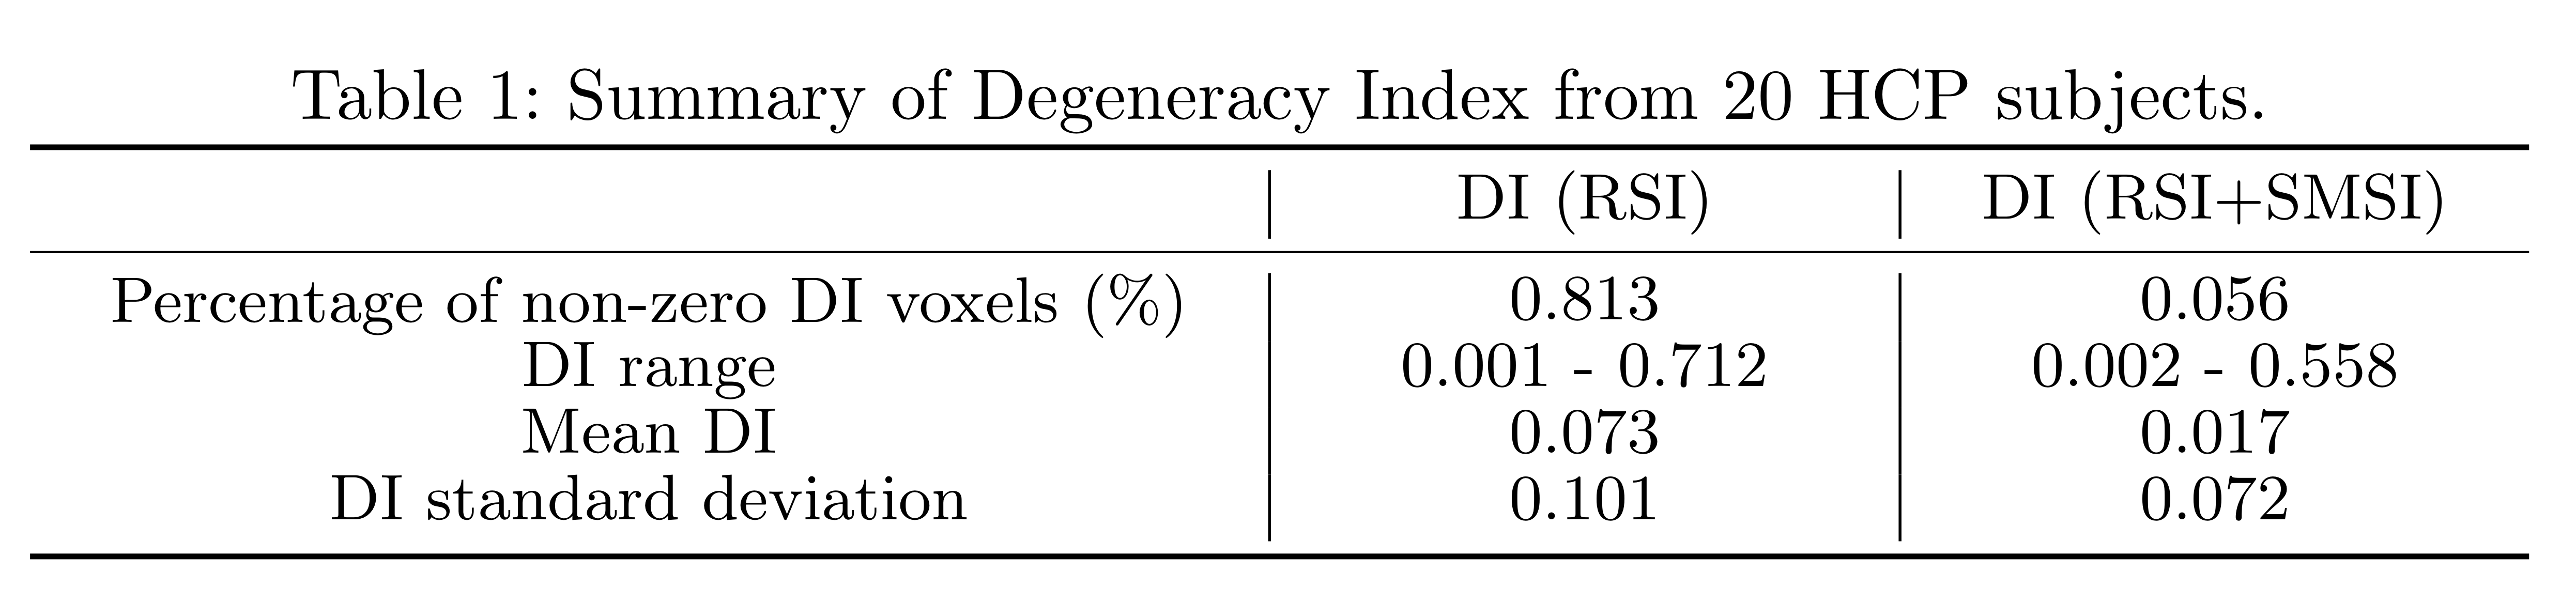
We tested our method on HCP data [7]. From Fig.3, there are less than 1% degenerated voxels. This implies that the degeneracy problem is not severe in practice, at least for the healthy adult brain. The degeneracy problem for RSI+SMSI (right panel) is even less severe with less than 0.1% voxels with non-zero DI values.
A DI statistical summary for 20 subjects is presented in Table 1.
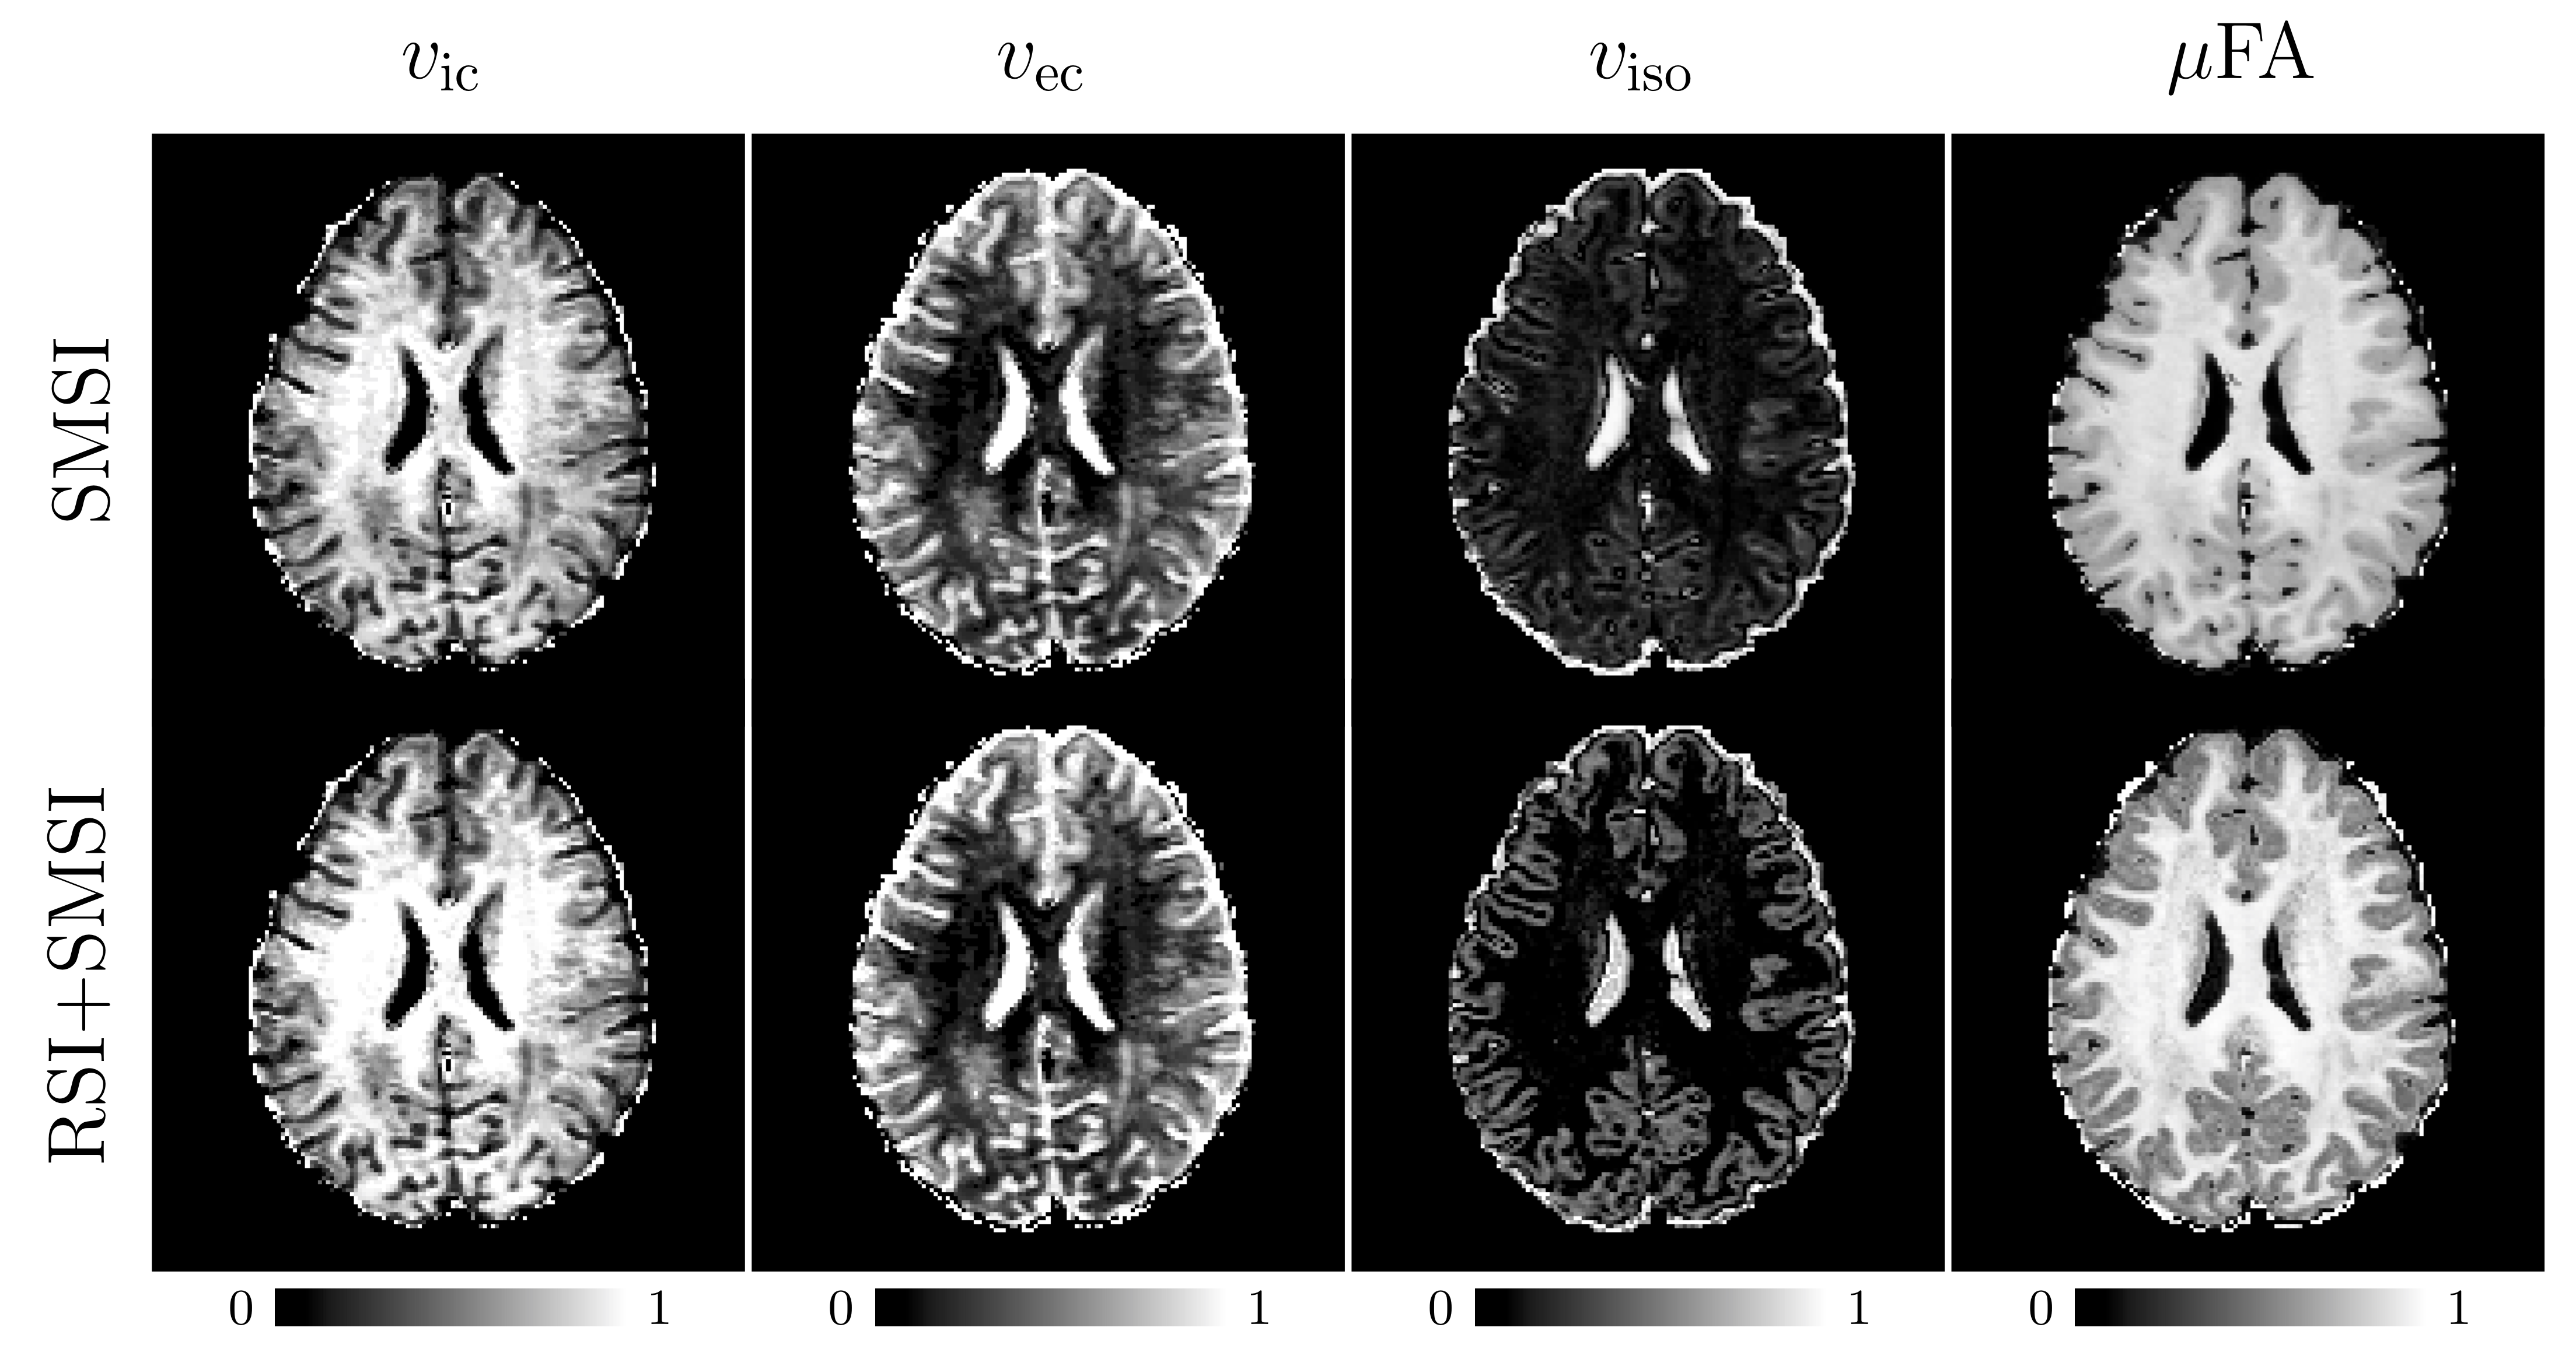
In Fig.4, we compare VF maps given by SMSI [6] and RSI+SMSI. $$$v_\text{iso}$$$ exhibits notable changes. RSI+SMSI yields higher $$$v_\text{iso}$$$, especially in gray matter region, where isotropic diffusion is more prominent.
This observation is in line with Fig.2 that with degeneracy $$$v_\text{iso}$$$ tends to be underestimated, affecting other measures such as microscopic FA ($$$\mu$$$FA).
Conclusions
We have presented a metric to quantify the degree of degeneracy and a method to mitigate the effects of degeneracy. We have shown that degeneracy is not a severe problem in healthy adult brains and that degeneracy can be significantly mitigated by considering both the diffusion-weighted signal and its spherical mean.Acknowledgements
This work was supported in part by NIH grant NS093842.References
[1] Howard, A.F., Mollink, J., Kleinnijenhuis, M., Pallebage-Gamarallage, M., Bastiani, M., Cottaar, M., Miller, K.L., Jbabdi, S.: Joint modelling of diffusion mri and microscopy. bioRxiv (2019) 563809
[2] Szczepankiewicz, F.: Imaging diffusional variance by MRI [public]: The role of tensor-valued diffusion encoding and tissue heterogeneity. PhD thesis, Lund University (2016)
[3] Cottaar, M., Szczepankiewicz, F., Bastiani, M., Hernandez-Fernandez, M., Sotiropoulos, S.N., Nilsson, M., Jbabdi, S.: Accurate fibre dispersion from mul- tiple diffusion encoding. arXiv preprint arXiv:1901.05820 (2019)
[4] Lampinen, B., Szczepankiewicz, F., M ̊artensson, J., van Westen, D., Sundgren, P.C., Nilsson, M.: Neurite density imaging versus imaging of microscopic anisotropy in diffusion MRI: A model comparison using spherical tensor encoding. NeuroImage 147 (2017) 517–531
[5] White, N.S., Leergaard, T.B., D’Arceuil, H., Bjaalie, J.G., Dale, A.M.: Probing tissue microstructure with restriction spectrum imaging: histological and theoretical validation. Human brain mapping 34(2) (2013) 327–346
[6] Huynh, K.M., Xu, T., Wu, Y., Chen, G., Thung, K.H., Wu, H., Lin, W., Shen, D., Yap, P.T., the UNC/UMN Baby Connectome Project Consortium: Probing brain micro-architecture by orientation distribution invariant identification of diffusion compartments. In: International Conference on Medical Image Computing and Computer-Assisted Intervention, Springer (2019) 547–555
[7] Van Essen, D.C., Smith, S.M., Barch, D.M., Behrens, T.E., Yacoub, E., Ugurbil, K., Consortium, W.M.H., et al.: The wu-minn human connectome project: an overview. Neuroimage 80 (2013) 62–79
Figures