4432
Decreased axon water fraction can result from either axonal loss and/or demyelination, reflecting different ex-vivo and in-vivo conditions1Center for Brain Imaging Science and Technology, Key Laboratory for Biomedical Engineering of Ministry of Education, College of Biomedical Engineering and Instrumental Science, Zhejiang University, Hangzhou, China, 2School of Medicine and Dentistry, University of Rochester Medical Center, New York, NY, United States
Synopsis
White Matter Tract Integrity (WMTI) is specific to tissue microstructure. However, answers to a question of what a decreased axon water fraction (AWF), a metric of WMTI, reflects seem contradictory among previous in-vivo and ex-vivo studies. To our knowledge, there have been no studies that compare the difference in AWF decline under both ex-vivo and in-vivo conditions. Here we use Monte Carlo (MC) simulation to investigate such question and results show that AWF decline indicated demyelination under ex-vivo conditions while it also related to axonal loss in-vivo besides demyelination. Results highlighted the non-negligible effect of membrane permeability on the difference.
Introduction
White Matter Tract Integrity (WMTI) analysis1 has been shown informative owing to their specificity to the tissue microstructure. However, one interesting observation that may appear contradictory among previous studies is whether decline in WMTI-derived axon water fraction (AWF) reflects axonal loss or demyelination. Previous in-vivo studies suggested that decreased AWF reflects axonal loss2-5, while ex-vivo studies6.7 stated it more relates to demyelination. An important difference between ex-vivo and in-vivo is the way how brain tissue is preserved, resulting in difference in membrane permeability. Here, Simulations were performed to answer questions pertaining to a) whether demyelination or axonal loss is related to decreases in AWF, and b) whether such decrease in AWF varies under ex-vivo and in-vivo conditions.Methods
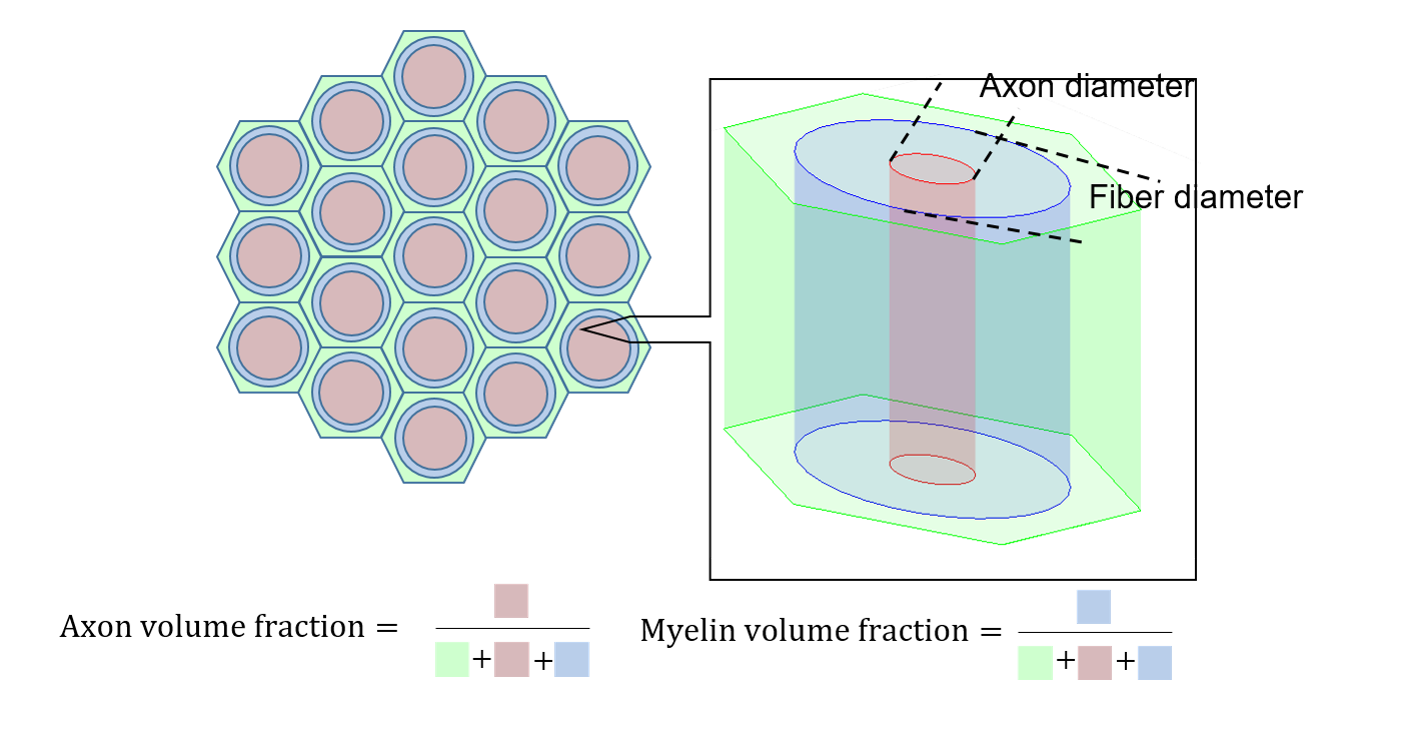
MC simulation was implemented in MATLAB (Version 2017b, MathWorks, Natick, MA, USA). Based on biophysical reality, three-compartment model was formulated as shown in Fig. 1.Intrinsic diffusivities ($$$D_{0,e}$$$, $$$D_{0,i}$$$) of ex-vivo condition are 0.4 and 0.3 $$$\mu m^{2}/ms$$$ while those of in-vivo are 2 and 1 $$$\mu m^{2}/ms$$$ based on previous work 8. Diffusivity of myelin water is 0.0015 $$$\mu m^{2}/ms$$$. The ratio of axonal to fiber diameters is 0.67. $$$T_{2}$$$ of intra- and extra-axonal compartments are 100 $$$ms$$$, while that of myelin is 10 $$$ms$$$.
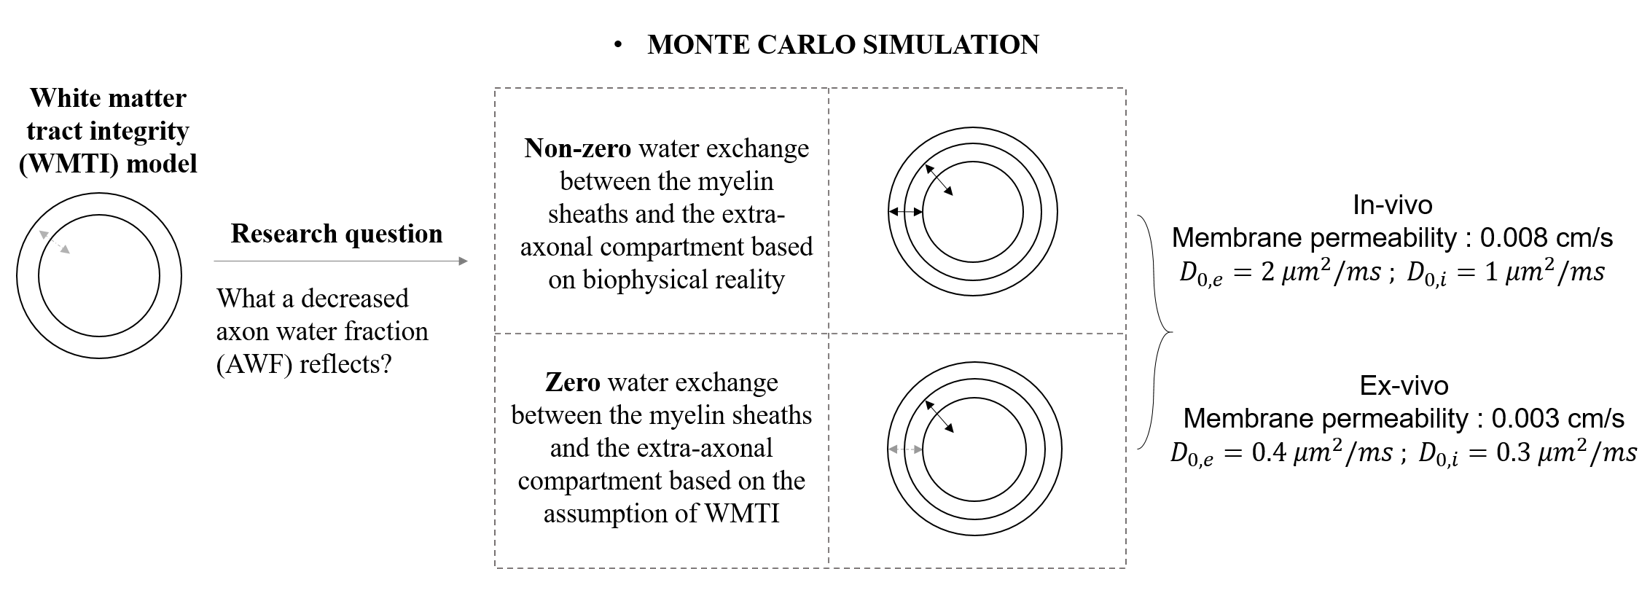
Two scenarios are considered for permeability through the myelin sheath. The first is that the transmission probabilities between the myelin and extra-axonal compartment are set based on $$$P_{me}=4P/\sqrt{6D_{m}/dt}$$$ and $$$P_{em}=P_{me}/\sqrt{D_{m}/D_{e}}$$$, where $$$P$$$ is membrane permeability. The second is that $$$P_{me}$$$ and $$$P_{em}$$$ are set as zero according to the WMTI assumption for no exchange water between the intra- and extra-axonal compartments. In both scenarios, the transmission probabilities between the myelin and intra-axonal compartment are defined by $$$P_{mi}=4P/\sqrt{6D_{m}/dt}$$$ and $$$P_{im}=P_{mi}/\sqrt{D_{m}/D_{i}}$$$. In each scenario, simulations were performed under ex-vivo and in-vivo conditions (Shown as Fig. 2).
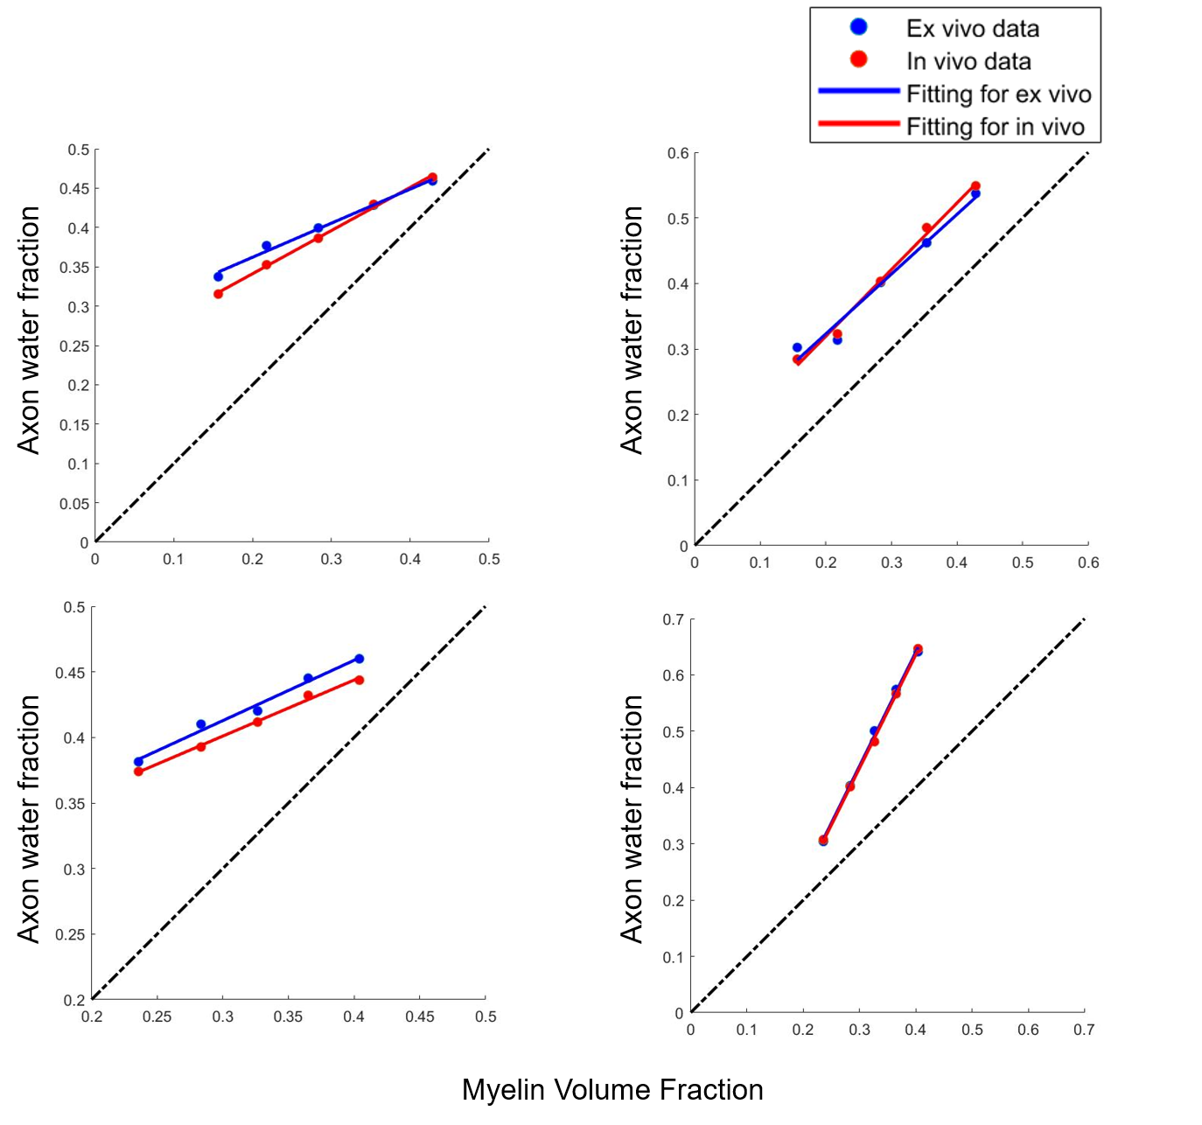
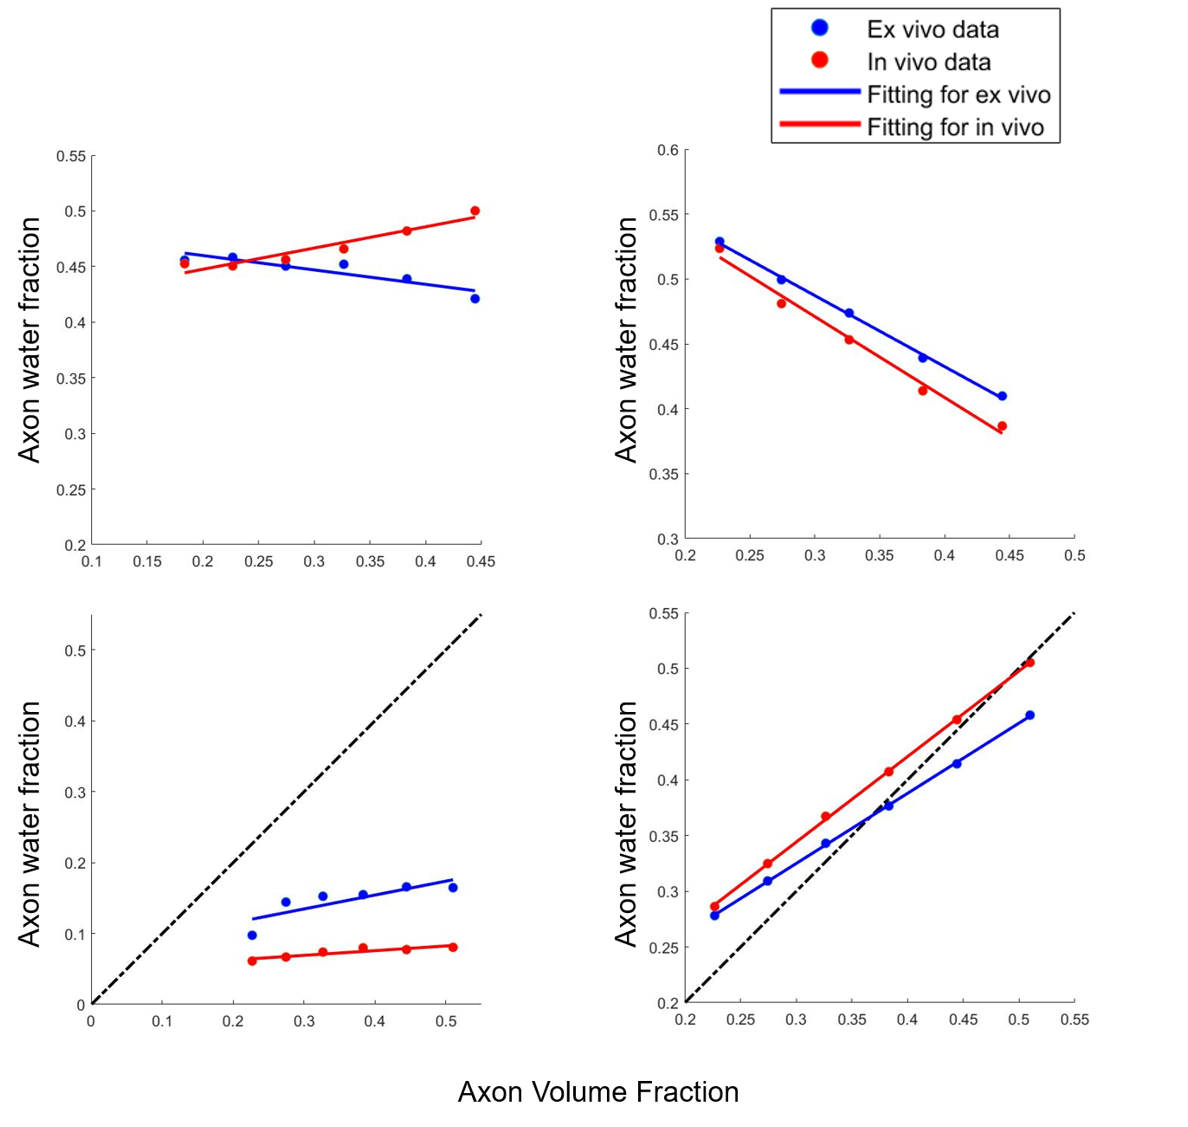
The simulations investigate the effects of demyelination, axonal loss and increasing permeability on AWF. Demyelination was simulated by varying myelin content either with a fixed axonal content (Simulation I) or with a fixed fiber diameter (Simulation II). Axonal loss was simulated by a decrease in axon content with either non-zero fixed myelin content (Simulation III), or zero myelin content (Simulation IV) where an extreme situation of complete demyelination occurred. Increasing permeability was simulated by varying membrane permeability $$$P$$$.
The simulation of signal synthesis was performed based on previous work 8. The fitting procedure consisted of two steps: first, based on Eq. (1), we obtained the DKI metrics. Second, WMTI model metrics were derived according to Eq. (2).
$$\frac{S(b)}{S(0)}=exp(-bD+\frac{1}{6}b^{2}D^{2}K+O(b^{3})), (1)$$
where $$$S$$$ is the signal, with $$$D$$$ and $$$K$$$ the apparent diffusion and kurtosis coefficients.
$$AWF=\frac{K_{max}}{K_{max}+3(1-\frac{\sqrt{K_{max}}(D_{a}-D_{a,min})}{D_{1}\sqrt{K_{1}}+D_{2}\sqrt{K_{2}}+D_{3}\sqrt{K_{3}}})^{2}}, (2)$$
where $$$K_{max}$$$ is the maximum kurtosis over 10000 diffusion directions, $$$D_{a}=tr(\mathbf{D_{a}})$$$ and $$$D_{a,min}$$$ is the lower bound for $$$D_{a}$$$ with the $$$D_{i}$$$, and $$$K_{i} (i=1,2,3)$$$ the diffusion and kurtosis coefficients along the axis directions of diffusion tensor.
Results
Fig.3 shows that in both Simulation I and II, AWF reduces with demyelination under ex-vivo and in-vivo conditions either with zero or non-zero $$$P_{me}$$$.The top left of Fig. 4 shows that when with non-zero $$$P_{me}$$$, AWF shows different trends between ex-vivo and in-vivo conditions with axonal loss. Under in-vivo condition, AWF decreases with axonal loss, however, it unexpectedly increases under ex-vivo condition. When with zero $$$P_{me}$$$ , AWF of both ex-vivo and in-vivo negatively correlated to axon volume fraction (AVF). When extending this model to an extreme situation of complete demyelination, bottom row of Fig. 4 shows that AWF has positive correlation with AVF under ex-vivo and in-vivo conditions.
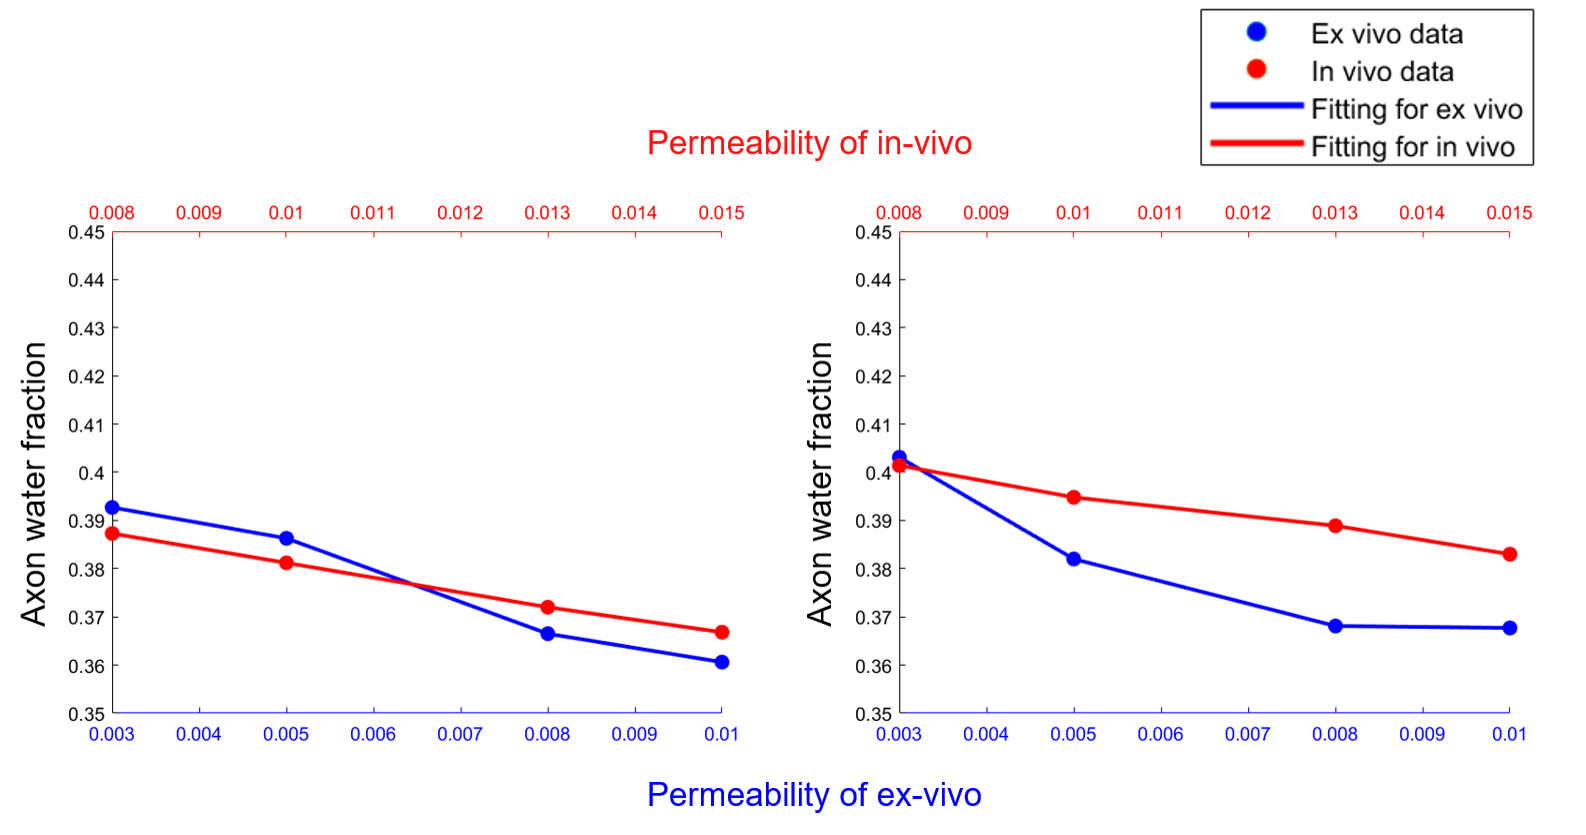
Fig.5 shows that AWF has negative correlation with permeability under ex-vivo and in-vivo conditions either with non-zero or zero $$$P_{me}$$$.
Discussion
With non-zero $$$P_{me}$$$ in accordance with biophysical reality, our results agree well with previous work that under ex-vivo condition, decline in AWF relates to demyelination while under in-vivo condition, it may also indicate axonal loss in addition to demyelination. Also AWF shows negative correlation with membrane permeability. When under ex-vivo condition, an unexpected negative correlation between AWF and AVF is observed with either non-zero or zero $$$P_{me}$$$. This is likely attributed to the WMTI model assumption of two non-exchanging compartments while three compartments were defined in the simulation. Owing to myelin’s extremely low diffusion coefficient compared with the other two compartments, the model may misinterpret the myelin for a slow diffusivity compartment (model-assumed intra-axonal compartment), and misclassify the intra- and extra-axonal compartments as one fast diffusivity compartment. Different relationship between AWF and AVF under ex-vivo and in-vivo conditions may be explained by the different membrane permeability. Lower permeability under ex-vivo condition compared with that of in-vivo likely led to the larger AWF value, contributing to the negative correlation between AWF and AVF. This speculation was partially validated by the results of in-vivo condition with zero $$$P_{me}$$$ (right-top of Fig.3). We show that when permeability decreases to zero, AWF increases with axonal loss, opposite to the AWF trend of the simulation with higher permeability (non-zero $$$P_{me}$$$).Conclusion
Our results show the difference of AWF behavior between ex-vivo and in-vivo conditions, which highlights the important effects of varied membrane permeability under different conditions.Acknowledgements
This work was supported by the National Natural Science Foundation of China [grant numbers 91632109, 81871428, 81971184], the Shanghai Key Laboratory of Psychotic Disorders [grant number 13dz2260500], the Major Scientific Project of Zhejiang Lab [grant number 2018DG0ZX01], and the Fundamental Research Funds for the Central Universities [grant number 2019QNA5026].References
1. Fieremans, E., Jensen, J.H., Helpern, J.A., 2011. White matter characterization with diffusional kurtosis imaging. Neuroimage 58, 177-188.
2. Fieremans E, Adisetiyo V, Payder A, Sheth H, Nwankwo J, Jensen JH, Milla S, et al. Assessment of microstructural white matter changes during early development with non-Gaussian diffusion MRI. Melbourne, Australia: Proc Intl Soc Mag Reson Med; 2012.
3. Fieremans E, Jensen JH, Helpern JA, Kim S, Grossman RI, Inglese M, Novikov DS, et al. Diffusion distinguishes between axonal loss and demyelination in brain white matter. Melbourne, Australia: Proc Intl Soc Mag Reson Med; 2012.
4. Guglielmetti C, Veraart J, Roelant E, Mai Z, Daans J, Van Audekerke J, Naeyaert M, Vanhoutte G, Delgado YPR, Praet J, Fieremans E, Ponsaerts P, Sijbers J, Van der Linden A,Verhoye M, et al. Diffusion kurtosis imaging probes cortical alterations and white matter pathology following cuprizone induced demyelination and spontaneous remyelination. Neuroimage. 2016;125:363-377.
5. Jelescu IO, Zurek M, Winters K, Veraart J, Rajaratnam A, Kim NS, Babb JS, Shepherd TM, Novikov DS, Kim S, et al. In vivo quantification of demyelination and recovery using compartment-specific diffusion MRI metrics validated by electron microscopy. NeuroImage. 2016;132:104-114.
6. Kelm ND, West KL, Carson RP, Gochberg DF, Ess KC, Does MD, et al. Evaluation of diffusion kurtosis imaging in ex vivo hypomyelinated mouse brains. Neuroimage. 2016;124(Pt A):612-626.
7. Falangola MF, Guilfoyle DN, Tabesh A, Hui ES, Nie X, Jensen JH, Gerum SV, Hu C, LaFrancois J, Collins HR, Helpern JA, et al. Histological correlation of diffusional kurtosis and white matter modeling metrics in cuprizone-induced corpus callosum demyelination. NMR Biomed. 2014;27(8):948-957.
8. Lin M, He H, Tong Q, Ding Q, Yan X, Feiweier T, Zhong J, et al. Effect of myelin water exchange on DTI-derived parameters in diffusion MRI: Elucidation of TE dependence. Magn Reson Med. 2018;79(3):1650-1660.
Figures