4431
Varying the frequency-content of high b-value spherical diffusion encoding improves the characterisation of isotropic restricted compartment1Cardiff University Brain Research Imaging Centre (CUBRIC), Cardiff University, Cardiff, United Kingdom
Synopsis
The use of ultra-strong diffusion gradient systems facilitates high b-values to suppress the signal from biological compartments with significant mobility, and as such the complexity of the model fit can be reduced. Here, we adopt isotropic encoding at high b-values to isolate spherical restricted compartments, and explore whether adding waveforms with different frequency-characteristics give an improvement in parameter-estimation of the spherical compartment.
Introduction
Accurate biophysical modelling of the diffusion MRI (dMRI) signal relies on the inclusion of all the microstructural compartments that have a significant contribution to the signal. For healthy fibrous tissue, one typically includes anisotropic compartments to represent water residing inside and outside fibres (e.g. axons/neurites in brain). The inclusion of an isotropic restricted compartment (if the radius is negligible compared with the diffusion length this is sometimes referred to as a “dot” compartment) has been suggested to represent water in cell bodies, particularly in cortical gray matter (GM)1, cerebellar GM2, and prostate3.The strategy of working in a regime where the signal of some compartments is suppressed has the advantage that the number of model-parameters is reduced, and the fit is not biased by potentially wrongful assumptions about other compartments. This has recently been adopted to study signal from isotropic restricted compartments in brain, using isotropic diffusion encoding (or spherical tensor encoding STE) at very high b-values which suppresses signal from compartments in which the mobility of particles is significantly large in at least one direction2,4.
In this work, we extend this strategy: we explore whether including STE waveforms with different frequency-characteristics as an additional experimental dimension could lead to a better characterisation of the isotropic restricted compartment (e.g. the sphere radius, $$$r_{s}$$$, or diffusivity, $$$D_{s}$$$).
Methods
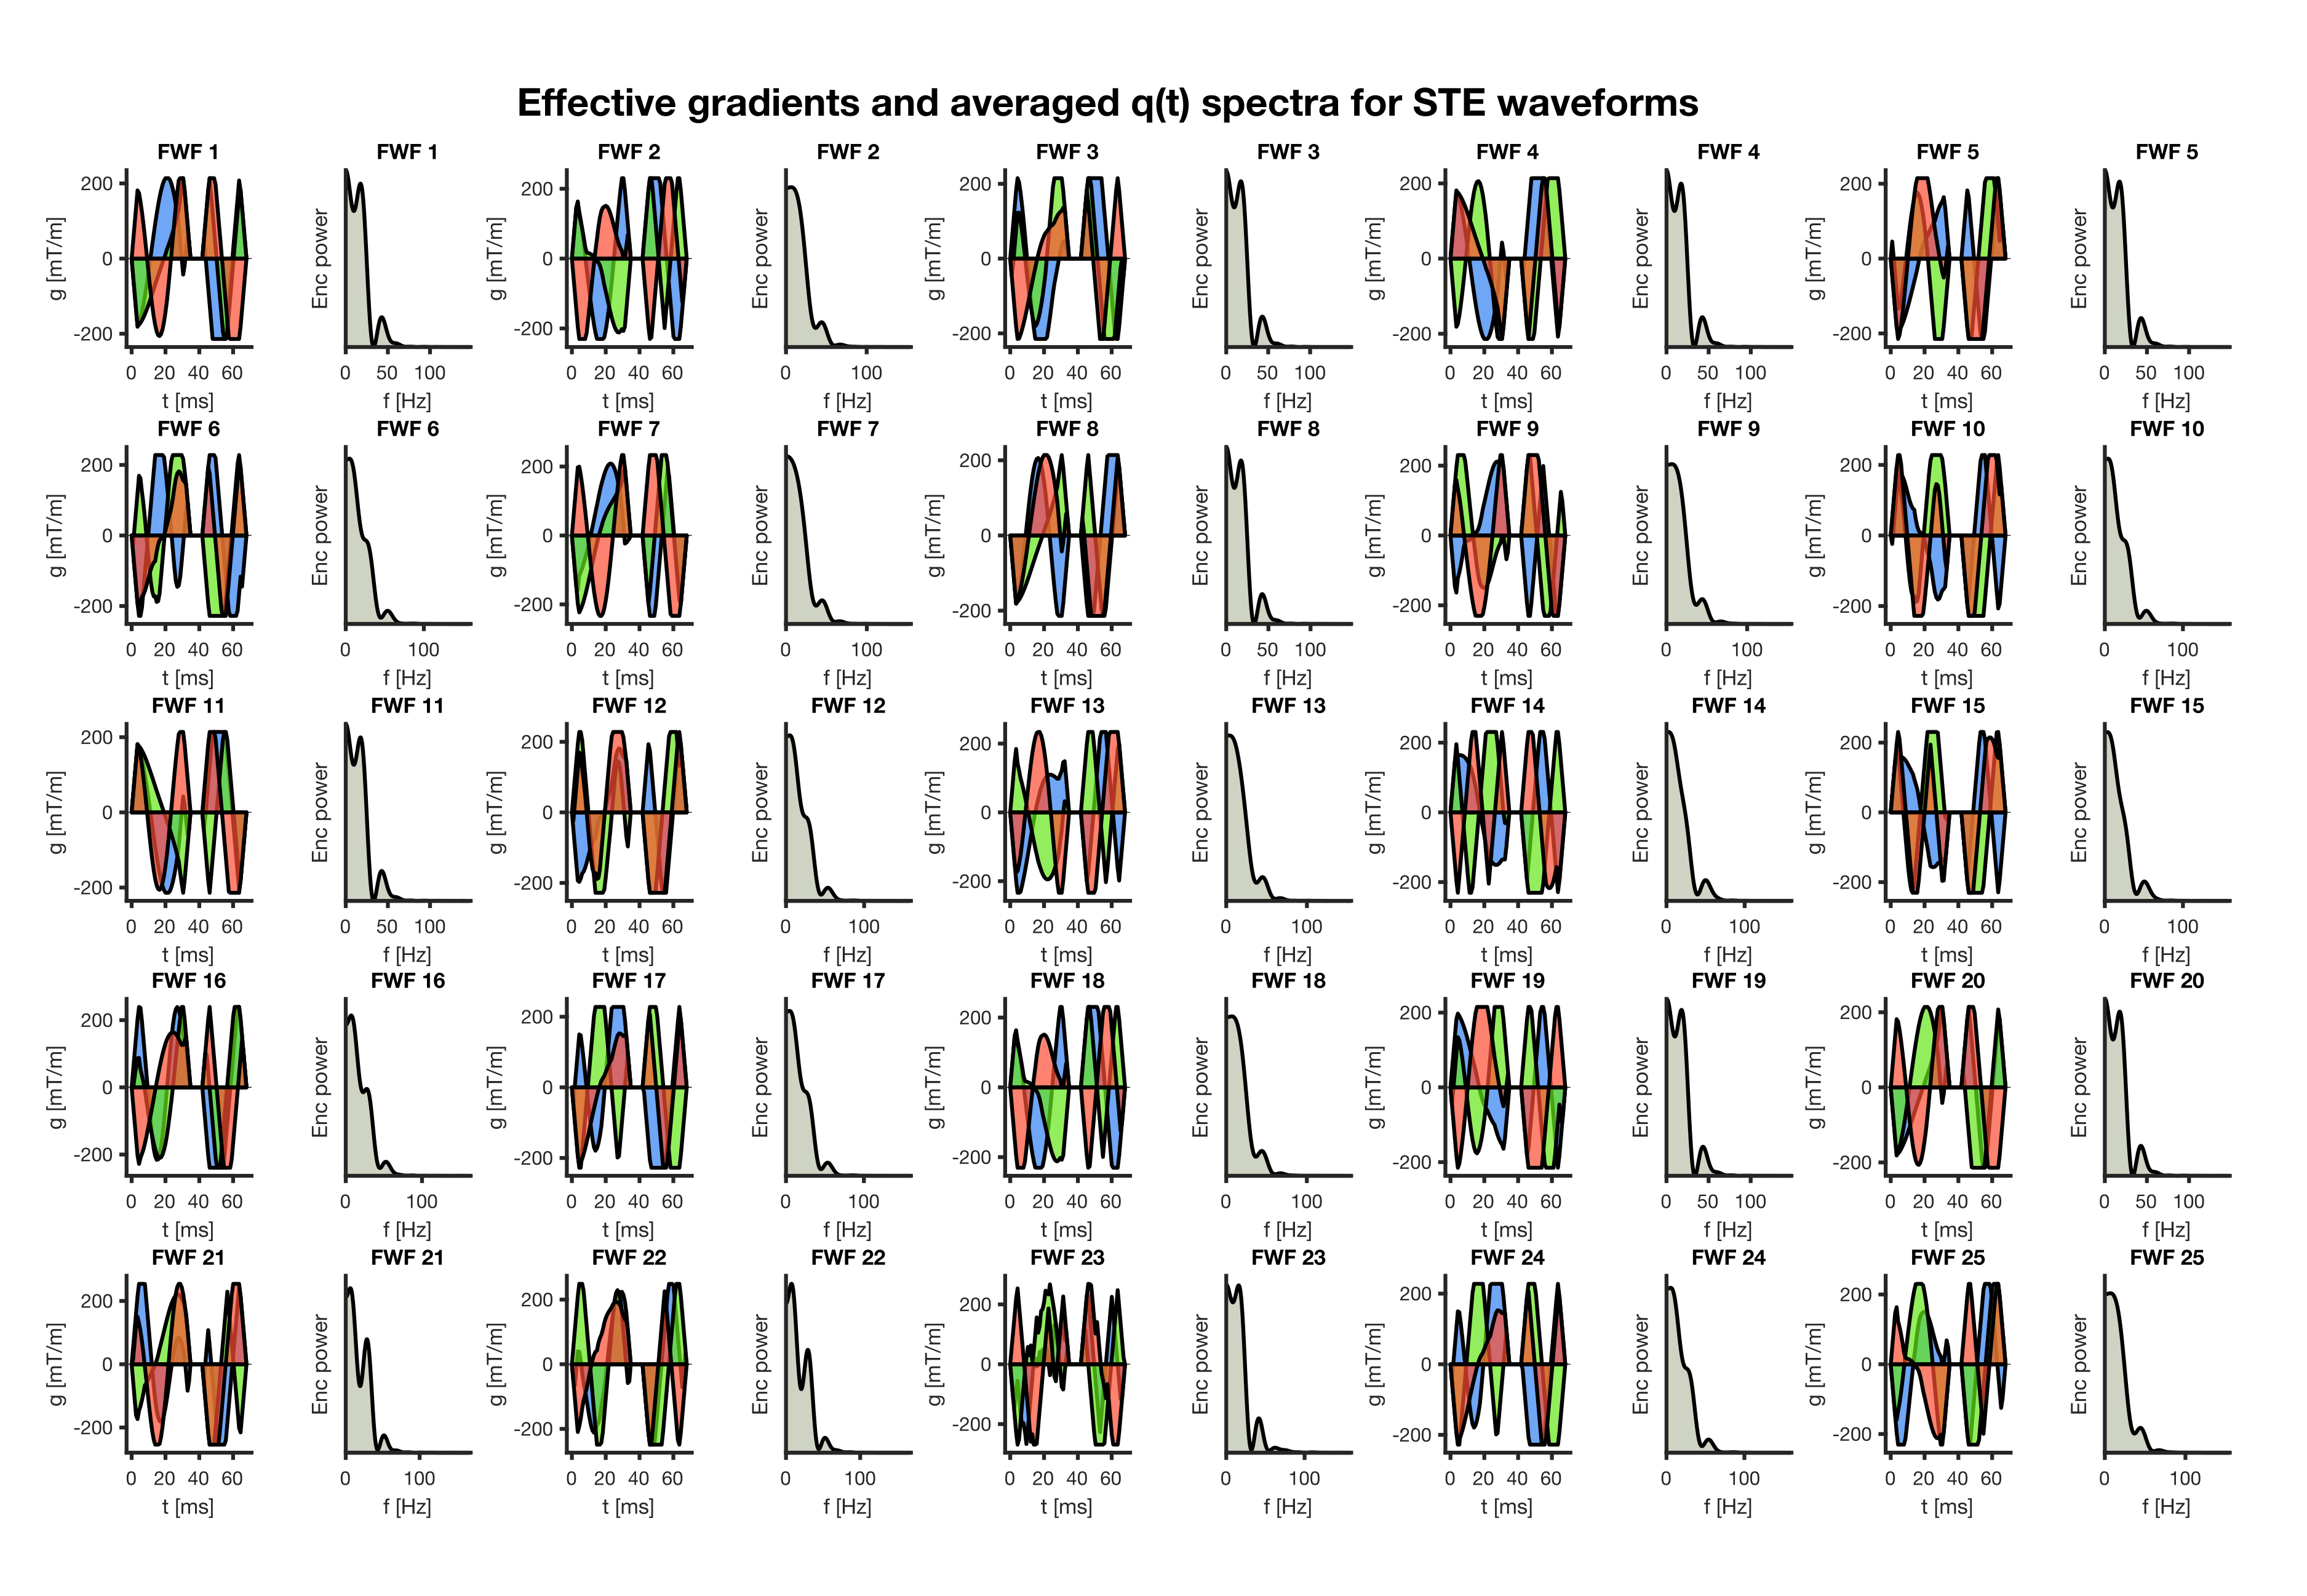
WaveformsSTE waveforms were repeatedly generated using numerical optimisation5,6 with the same following settings2: 35.48 ms, 25.63 ms, and 6.9 ms for the first encoding, second encoding, and pause respectively, maximum gradient and slew rate 250 mT/m and 60 T/m/s, and optimisation using the max-norm to achieve the highest possible b-value. The encoding power of each effective gradient waveform (separately along dimensions) was computed as $$$\mathbf{Q}(\omega)=\int_{0}^{\tau}\mathbf{q}(t) e^{-i\omega t}dt$$$, where $$$\mathbf{q} (t)=\gamma\int_{0}^{t}\mathbf{G} (t')dt'$$$ with $$$\gamma$$$ the gyromagnetic ratio, and then averaged across dimensions.
Signal generation
The matrix formalism7 allows the signal attenuation from restricted diffusion in enclosing pores under the application of arbitrary waveforms to be evaluated. Briefly, the waveform is subdivided into a sequence of discrete intervals and the evolution of the spin phase in each interval is considered. The echo attenuation can then be expressed as a matrix product:
$$E=S(\mathbf{q})R[A(\mathbf{q})]^{m_{2}}...R[A(\mathbf{q})]^{m_{n}}...R[A(\mathbf{q})]^{m_{N}}RS ^{\dagger} (-\mathbf{q}),$$
where $$$S_{k}(\mathbf{q})=V ^{-1/2}\int d\mathbf{r}u_{k}(\mathbf{r}) e^{i2\pi\mathbf{q}\cdot \mathbf{r}}$$$, $$$R_{kk}=e^{-\lambda_{k}\tau}$$$, $$$A_{kk'}(\mathbf{q})=\int d\mathbf{r}u_{k}^{\ast} u_{k'}(\mathbf{r})e^{i2\pi\mathbf{q}\cdot\mathbf{r}}$$$, $$$u_{k}$$$ is the orthonormal set of solutions to the Helmholtz equation, and $$$V$$$ is the pore volume.
Using this formalism, the signal in a spherical pore was derived by Codd and Callaghan (1999)8:
$$$S(q) = 2(i) V ^{-1/2} \alpha _{nn'}(qa) ^{-1/2} \left ( \frac{a^{3}}{\xi _{nn'}^{2} -(qa)^{2}} \right ) \times (\xi _{nn'}^{2} j_{n}(qa)j_{n+1}(\xi_{nn'})-qaj_{n}(\xi_{nn'})j_{n+1}(qa)),$$$ where $$$\xi_{nn'}$$$ is the root of transcendental equation, $$$\alpha_{nn'}$$$ is the normalization coefficient, $$$q$$$ is the norm of $$$\mathbf{q}$$$, $$$a$$$ is the restricted region dimension, and $$$j_{n}$$$ is the $$$n$$$-th order Bessel function.
Here we employed the implementation in the MISST toolbox9–11 to generate signals for arbitrary STE waveforms. Gaussian noise was added in 50 noise-realisations.
Estimation
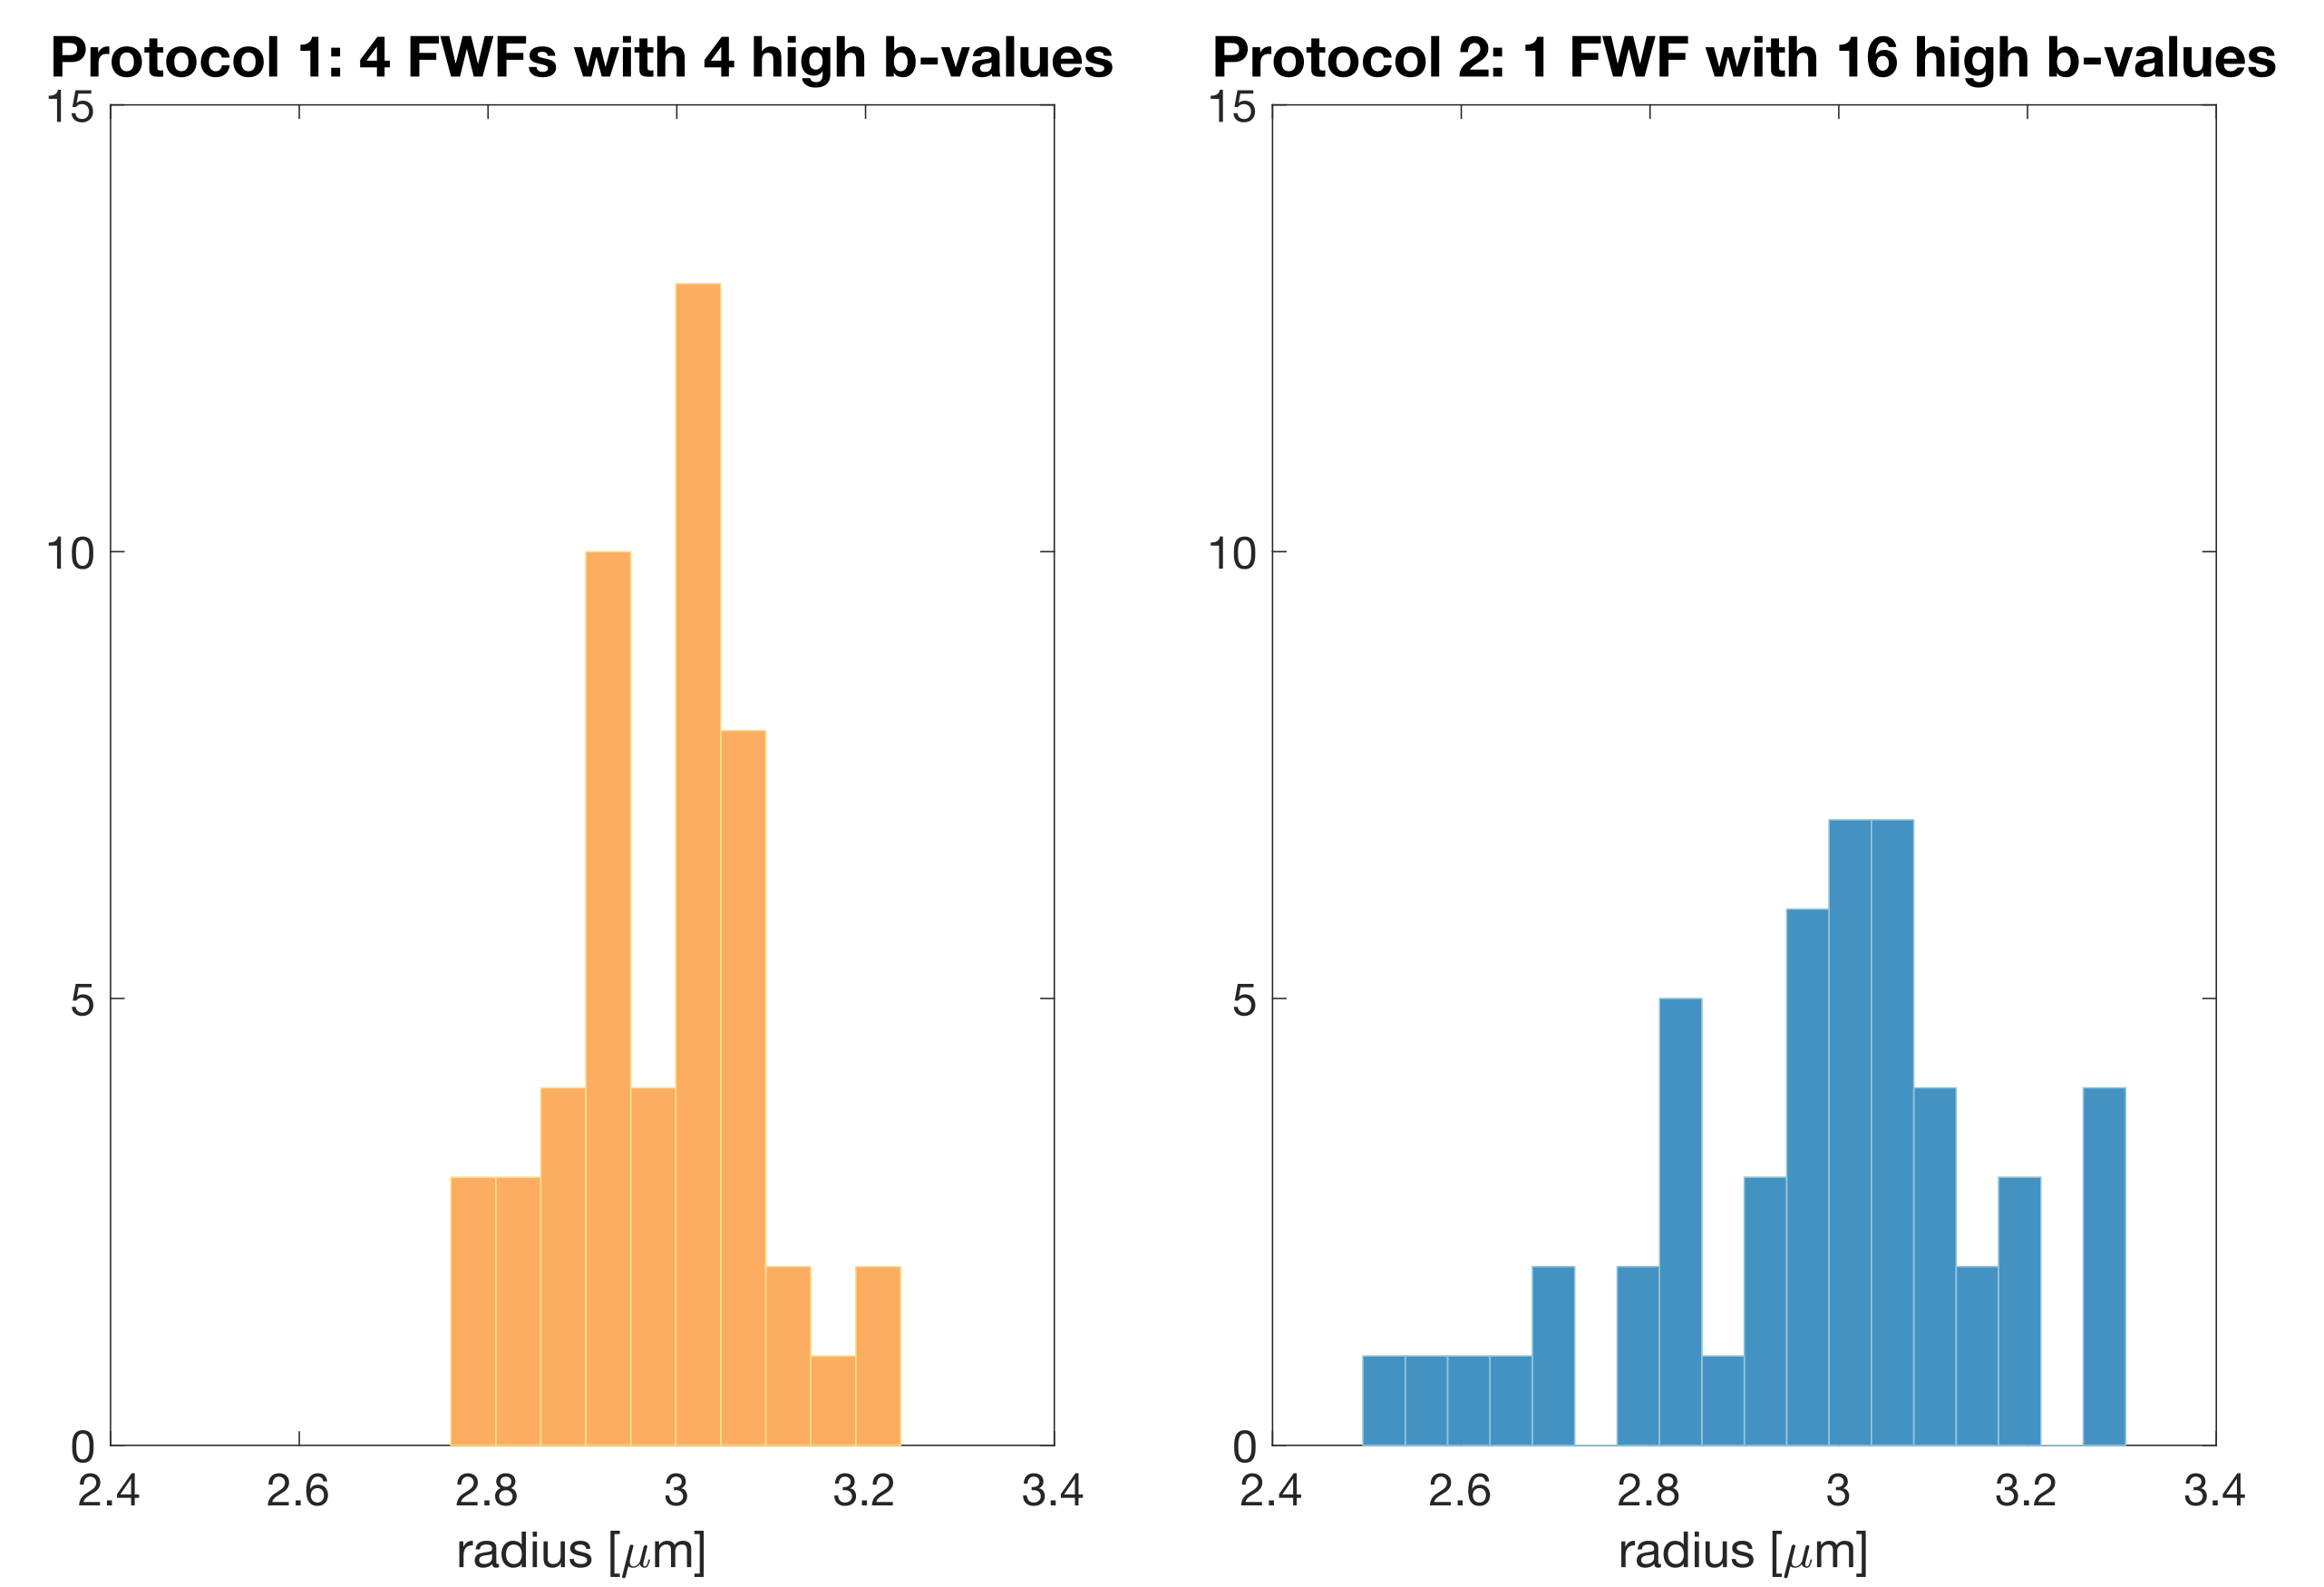
Two acquisition protocols were generated: protocol 1 included a single waveform shape (FWF12) and 16 b-values 10.000:300:15000, and protocol 2 included 4 waveforms with different frequency-characteristics (FWF5, 12, 15, 21) and 4 b-values 10.500:1500:15000, so that the total number of acquisitions was equal. Signals were generated and estimates of $$$r_{s}$$$ were obtained using a nonlinear least-squares trust-region-reflective algorithm in Matlab ($$$D_{s})$$$ was fixed1).
Results
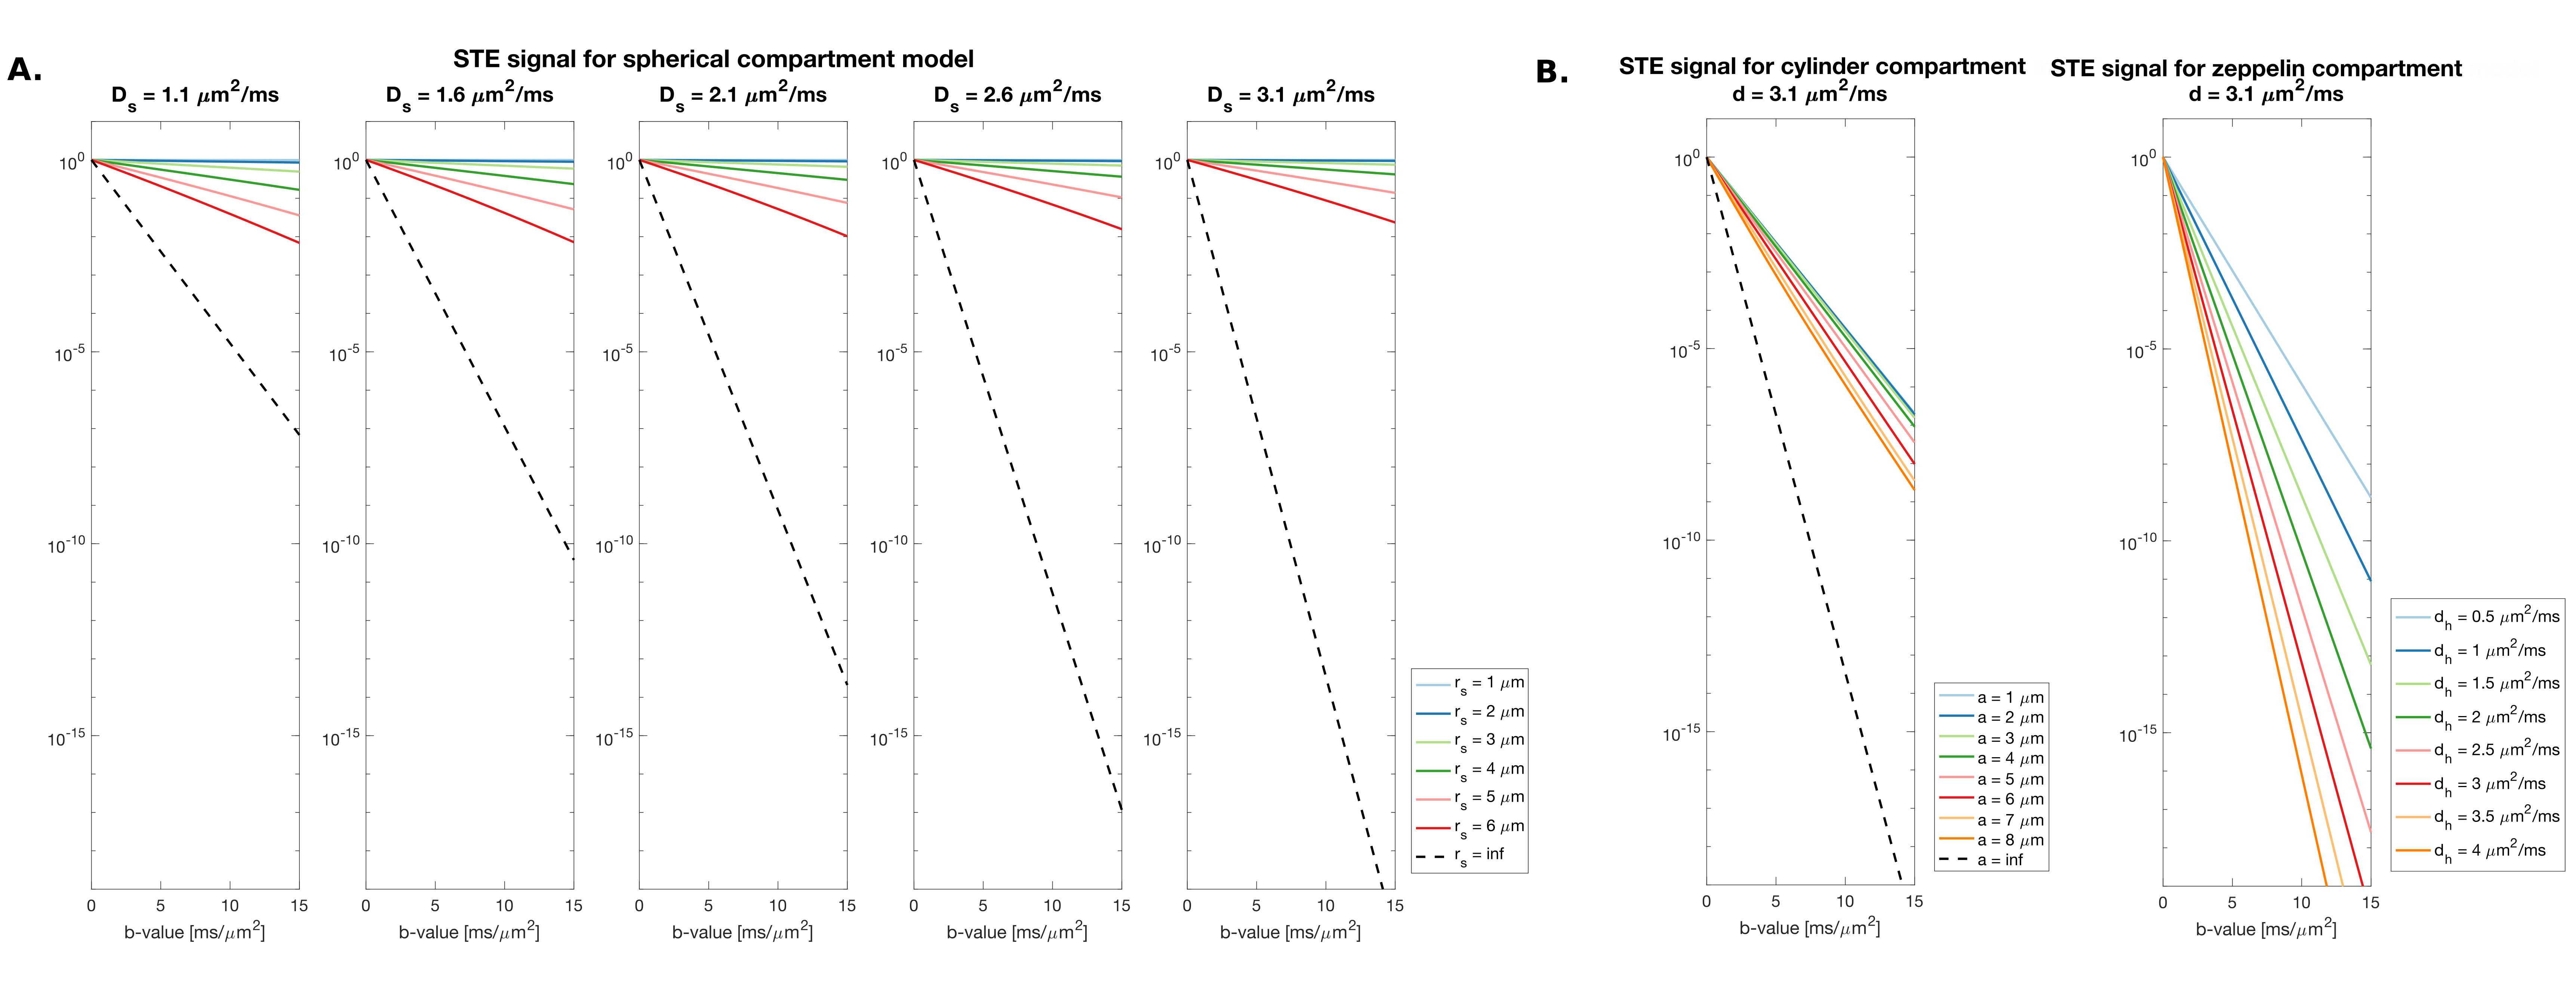
Fig.1 shows the 25 generated waveforms and their encoding spectra. Different waveforms have different characteristics in terms of their encoding power.Fig.2 shows simulated signal decays for one of the STE waveforms (FWF 1), for spherical compartments with different diffusivities $$$D_{s}$$$ and radii $$$r_{s}$$$ (A.) and a cylindrical compartment (B.). The signal from the spherical compartment is invariant under rotations of the waveform (results not shown), whereas this is not necessarily true for signals from anisotropic restricted compartments12,13. At high b-values, the signal arising from a cylindrical compartment is largely compressed, while for low $$$D_{s}$$$ and small $$$r_{s}$$$ the signal of a spherical compartment still remains.
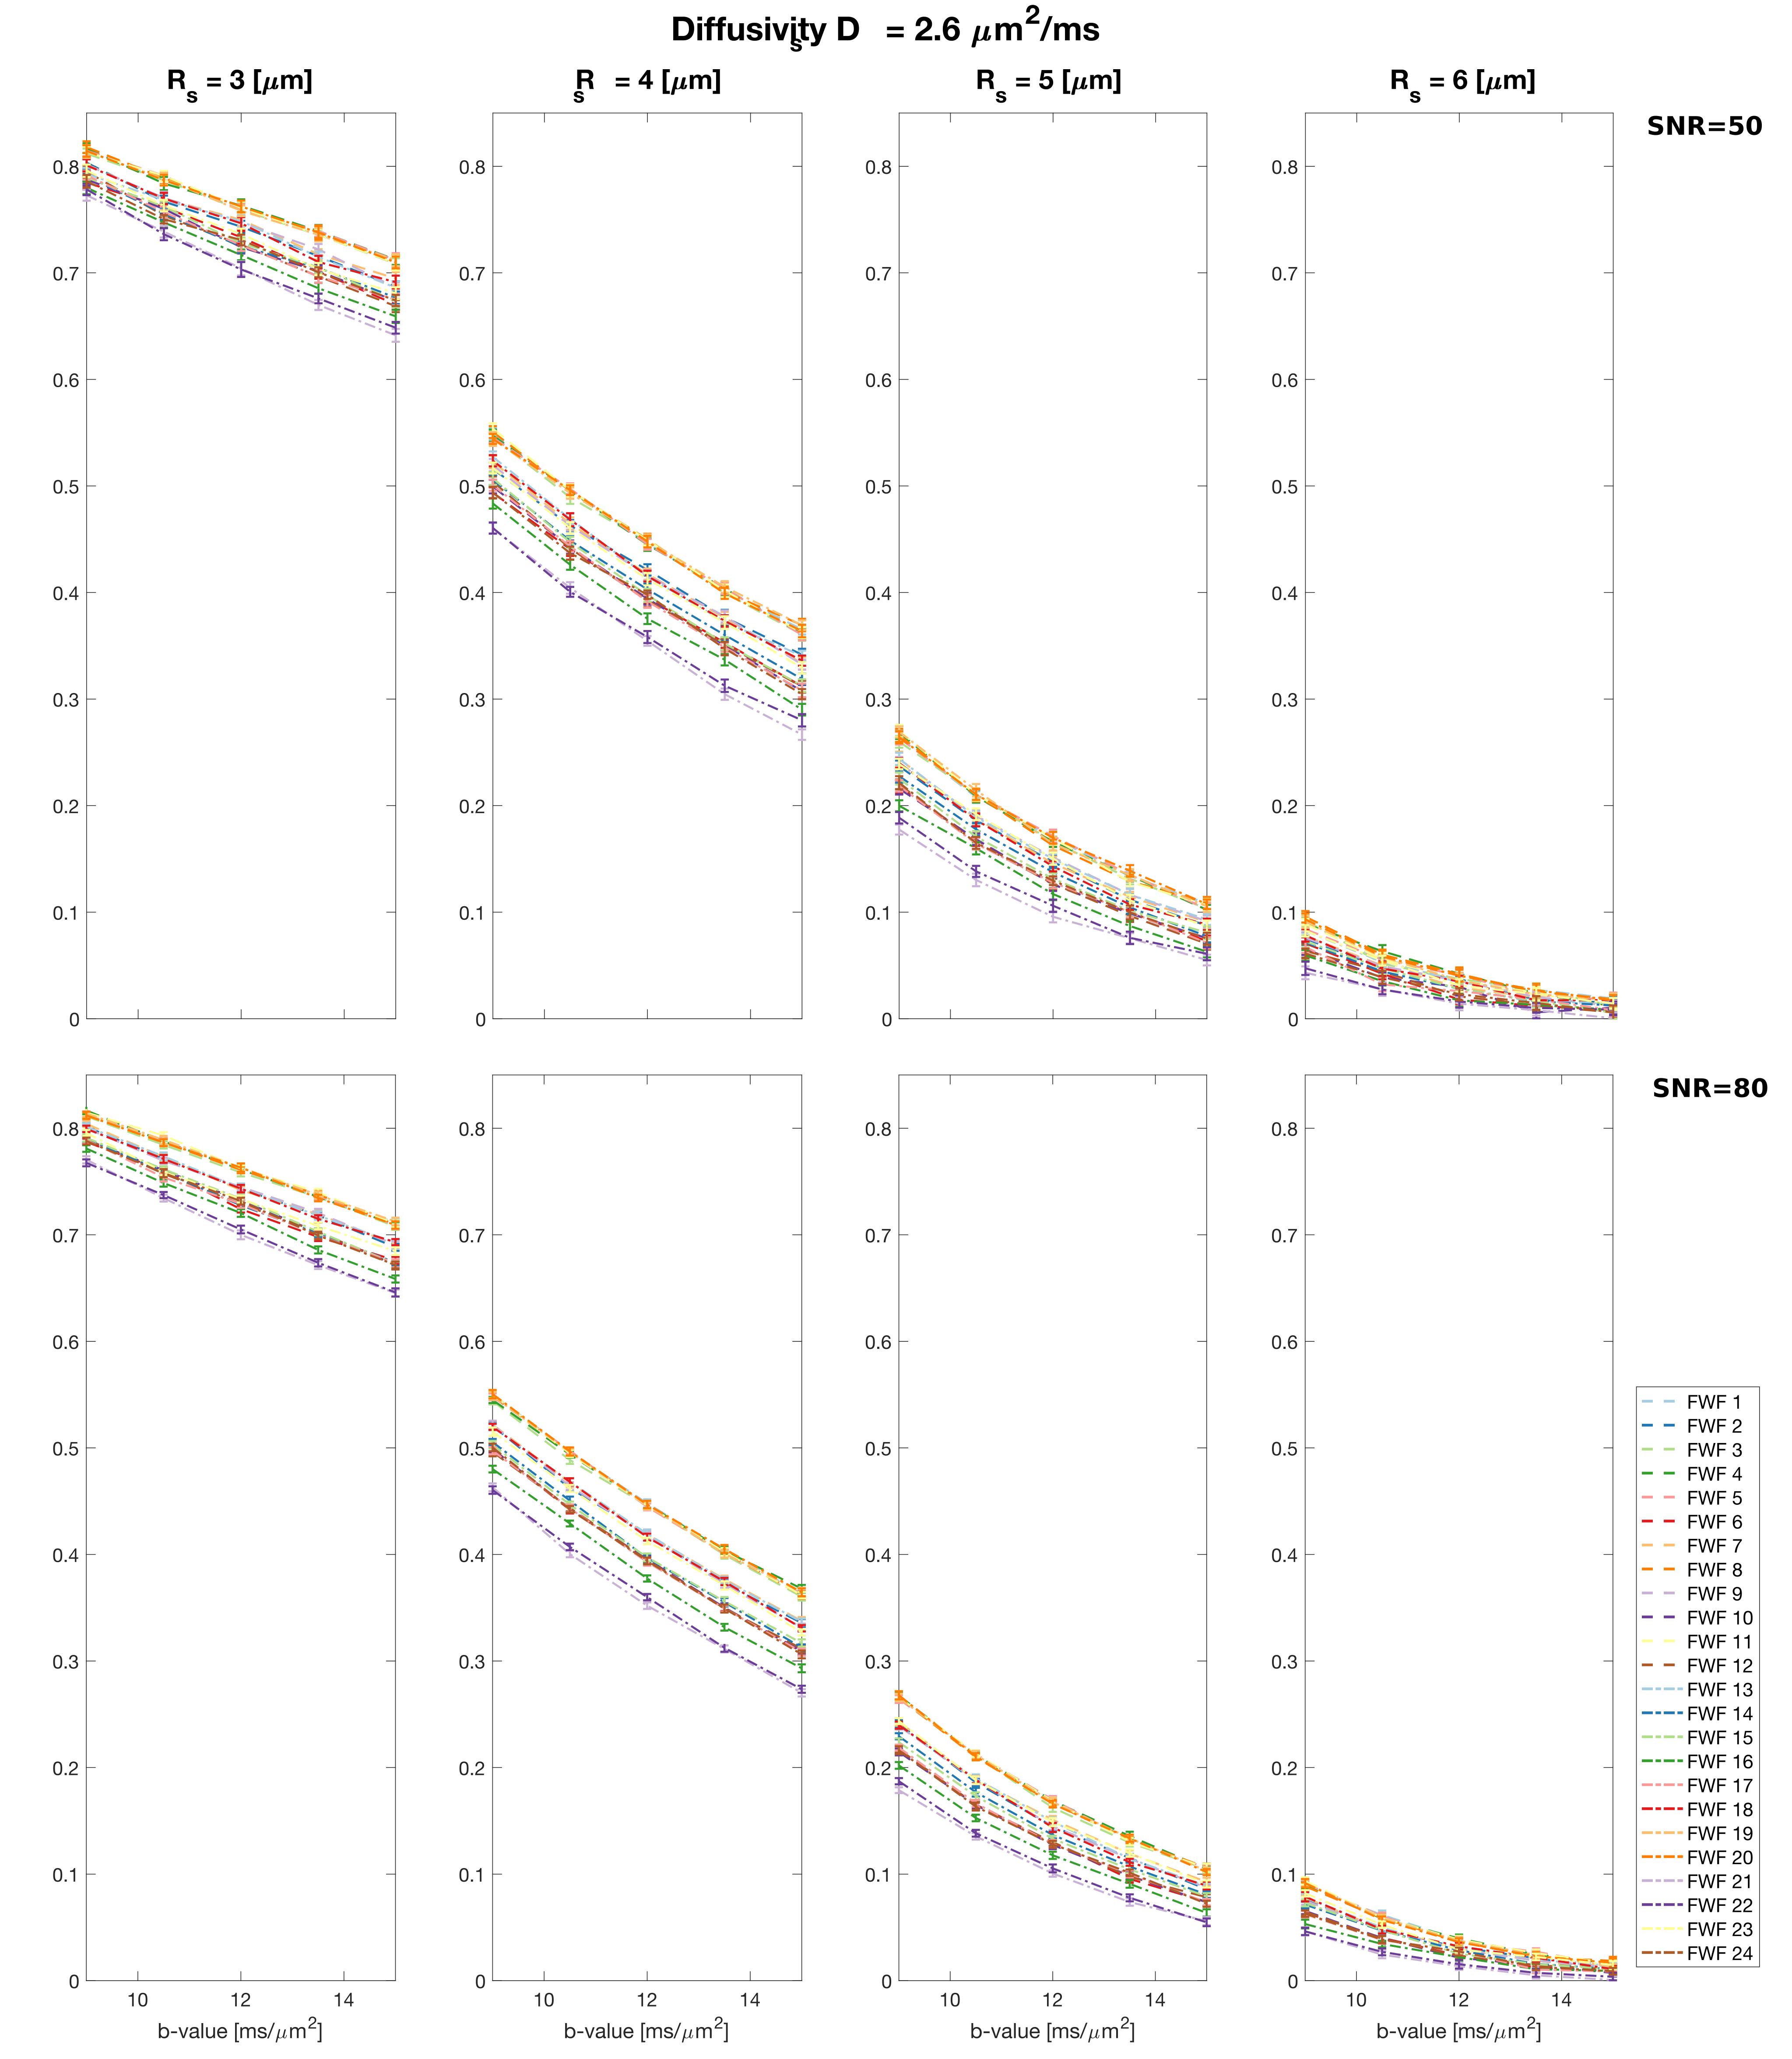
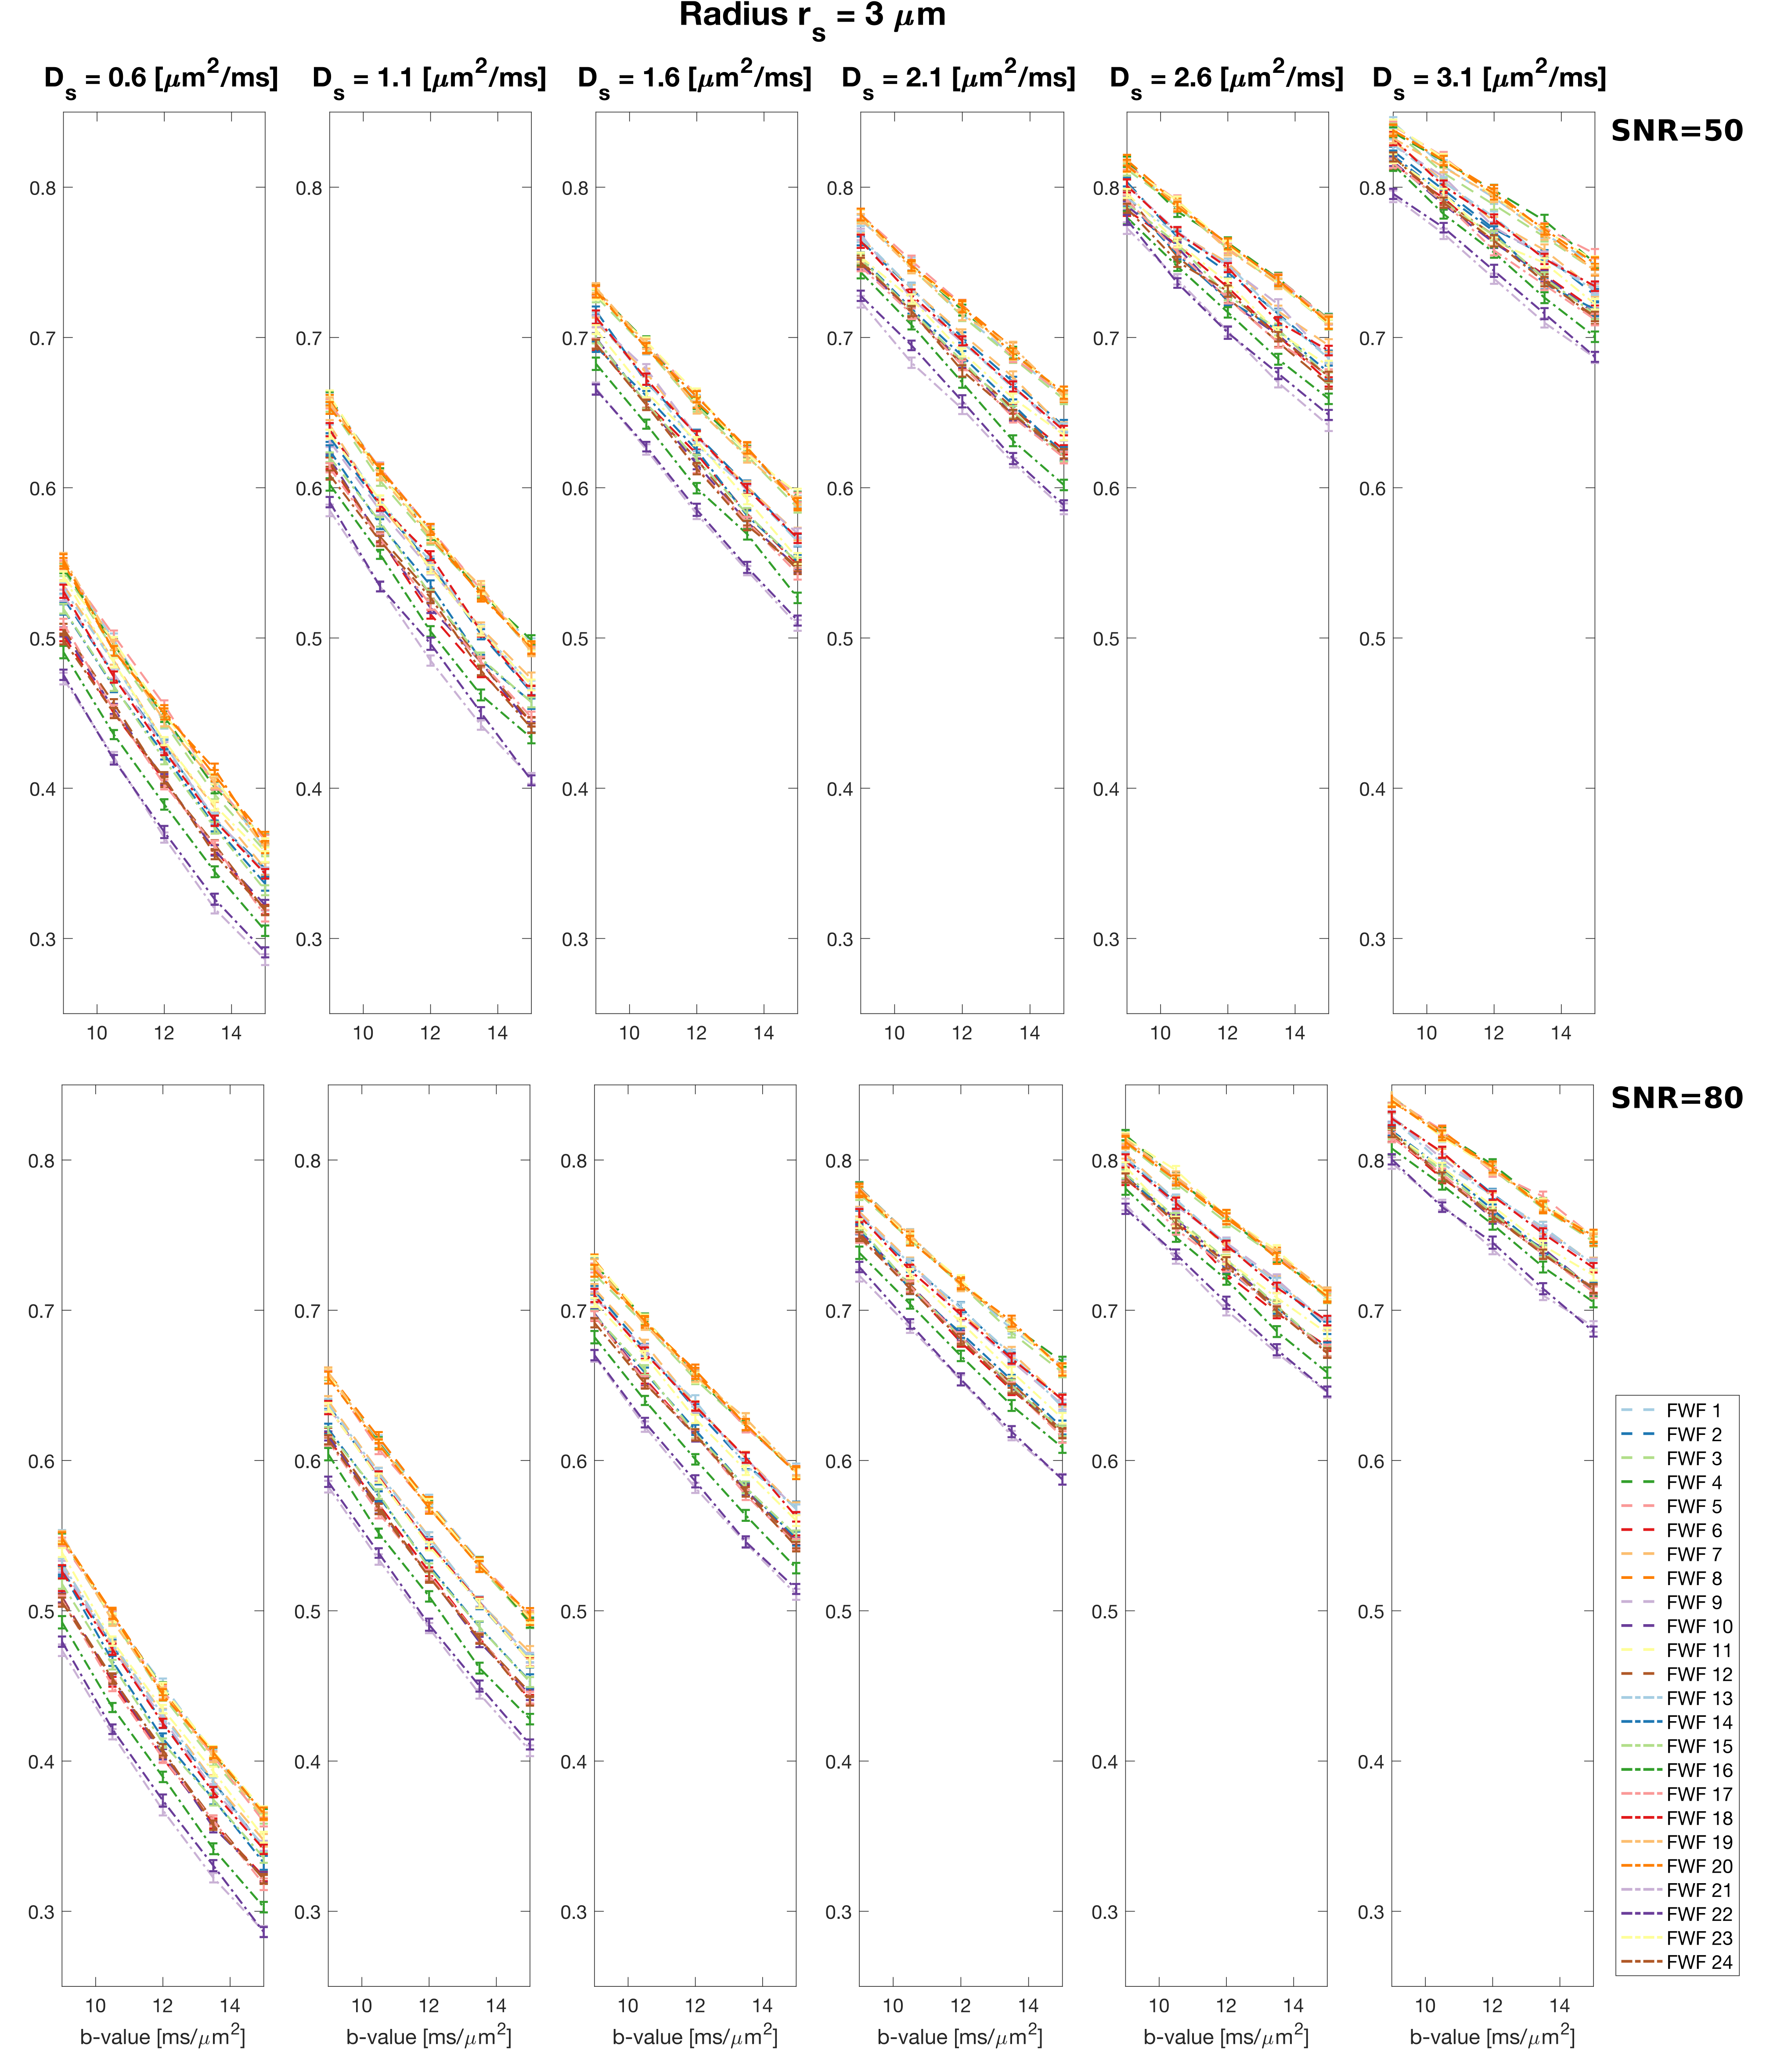
Figs.3 and 4 show the signal at high b-values for different waveforms varying $$$r_{s}$$$ (Fig.3) and $$$D_{s}$$$ (Fig.4), and different SNR. This reveals a significant impact of the waveform on the signal evolution.
Fig.5 suggests that the estimation precision can be significantly increased when waveforms with different frequency characteristics are included.
Discussion and Conclusion
In this work we have applied STE at high b-values to study the regime in which the remaining signal largely arises from the isotropic restricted compartment; a strategy that has previously been used to study the intra-axonal signal with Stejskal-Tanner or linear tensor encoding (LTE) at high b-values14–16. Varying the waveform frequency content can provide an independent dimension to study tissue microstructure17. Our simulations show a significant dependence of the signal on the waveform used, suggesting that varying the frequency content can improve the characterisation of the isotropic compartment with finite radius. Future work will focus on optimisation of STE waveforms to minimise the Cramer-Rao lower bound for the spherical compartment.Acknowledgements
CMWT is supported by a Rubicon grant (680-50-1527) from the Netherlands Organisation for Scientific Research (NWO) and a Sir Henry Wellcome Fellowship (215944/Z/19/Z). We are grateful to Siemens Healthineers and Fabrizio Fasano for the support. DKJ and MD are supported by a Wellcome Trust Investigator Award (096646/Z/11/Z) and a Wellcome Trust Strategic Award (104943/Z/14/Z).References
1. Palombo M, Ianus A, Nunes D, et al. SANDI: a compartment-based model for non-invasive apparent soma and neurite imaging by diffusion MRI. July 2019.
2. Tax CMW, Szczepankiewicz F, Nilsson M, Jones DK. The dot-compartment revealed? Diffusion MRI with ultra-strong gradients and spherical tensor encoding in the living human brain. bioRxiv. March 2019:584730. doi:10.1101/584730
3. Panagiotaki E, Chan RW, Dikaios N, et al. Microstructural characterization of normal and malignant human prostate tissue with vascular, extracellular, and restricted diffusion for cytometry in tumours magnetic resonance imaging. Invest Radiol. 2015;50(4):218-227. doi:10.1097/RLI.0000000000000115
4. Dhital B, Kellner E, Kiselev VG, Reisert M. The absence of restricted water pool in brain white matter. Neuroimage. 2018;182:398-406. doi:10.1016/J.NEUROIMAGE.2017.10.051
5. Sjölund J, Szczepankiewicz F, Nilsson M, Topgaard D, Westin C-F, Knutsson H. Constrained optimization of gradient waveforms for generalized diffusion encoding. J Magn Reson. 2015;261:157-168. doi:10.1016/J.JMR.2015.10.012
6. Szczepankiewicz F, Westin C, Nilsson M. Maxwell‐compensated design of asymmetric gradient waveforms for tensor‐valued diffusion encoding. Magn Reson Med. 2019;82(4):1424-1437. doi:10.1002/mrm.27828
7. Callaghan PT. A Simple Matrix Formalism for Spin Echo Analysis of Restricted Diffusion under Generalized Gradient Waveforms. J Magn Reson. 1997;129(1):74-84. doi:10.1006/JMRE.1997.1233
8. Codd SL, Callaghan PT. Spin Echo Analysis of Restricted Diffusion under Generalized Gradient Waveforms: Planar, Cylindrical, and Spherical Pores with Wall Relaxivity. J Magn Reson. 1999;137(2):358-372. doi:10.1006/JMRE.1998.1679
9. Drobnjak I, Siow B, Alexander DC. Optimizing gradient waveforms for microstructure sensitivity in diffusion-weighted MR. J Magn Reson. 2010;206(1):41-51. doi:10.1016/J.JMR.2010.05.017
10. Drobnjak I, Zhang H, Hall MG, Alexander DC. The matrix formalism for generalised gradients with time-varying orientation in diffusion NMR. J Magn Reson. 2011;210(1):151-157. doi:10.1016/J.JMR.2011.02.022
11. Ianuş A, Siow B, Drobnjak I, Zhang H, Alexander DC. Gaussian phase distribution approximations for oscillating gradient spin echo diffusion MRI. J Magn Reson. 2013;227:25-34. doi:10.1016/J.JMR.2012.11.021
12. de Swiet TM, Mitra PP. Possible Systematic Errors in Single-Shot Measurements of the Trace of the Diffusion Tensor. J Magn Reson Ser B. 1996;111(1):15-22. doi:10.1006/JMRB.1996.0055
13. Jespersen SN, Olesen JL, Ianuş A, Shemesh N. Effects of nongaussian diffusion on “isotropic diffusion” measurements: An ex-vivo microimaging and simulation study. J Magn Reson. 2019;300:84-94. doi:10.1016/J.JMR.2019.01.007
14. Veraart J, Fieremans E, Novikov DS. On the scaling behavior of water diffusion in human brain white matter. Neuroimage. 2019;185:379-387. doi:10.1016/J.NEUROIMAGE.2018.09.075
15. Kleban E, Tax CMW, Rudrapatna US, Jones DK, Bowtell R. Separating intra- and extra-axonal susceptibility effects using a Diffusion-Filtered Asymmetric Spin Echo (D-FASE) sequence. In: ISMRM. ; 2019:0318.
16. McKinnon ET, Jensen JH. Measuring intra-axonal T2 in white matter with direction-averaged diffusion MRI. Magn Reson Med. 2019;81(5):2985-2994. doi:10.1002/mrm.27617
17. Lundell, H., Nilsson, M., Dyrby, T. B., Parker, G. J. M., Cristinacce, P. H., Zhou, F. L., & Lasič, S. Multidimensional diffusion MRI with spectrally modulated gradients reveals unprecedented microstructural detail. Scientific reports. 2019; 9(1), 9026.
Figures