4428
Using stimulated echo diffusion MRI to elucidate cellular changes during cell death1Medical Biophysics, University of Toronto, Toronto, ON, Canada, 2Physical Sciences, Sunnybrook Research Institute, Toronto, ON, Canada, 3Radiation Oncology, Sunnybrook Health Sciences Centre, Toronto, ON, Canada
Synopsis
Morphological changes caused by cellular death alter the movement of water, which diffusion MRI has the potential to detect. Cellular death can be easily isolated with an in vitro model. I find that the ADC, kurtosis and the ball-sphere model showed significant changes between the control and the treated groups. Likely sources of parameter changes are the increased membrane permeability, organelle/macromolecule breakdown and differences in cellular size.
Introduction
Cancer treatments in general induce microstructural tissue changes1. The degree of these changes may be a window into determining the efficacy of patient treatments earlier than standard of care practices. Diffusion MRI with longer diffusion times has the potential to elucidate cellular parameters that require more time2, such as restriction due to larger structures and transmembrane water exchange3. Here, we use diffusion analysis on an in vitro system that allows the investigation of cell death.Methods
An acute myeloid leukemia cell line (AML-5) was cultured in suspension with alpha-MEM, FBS and penicillin/streptomycin. Apoptosis was induced with 10 μg/mL of cisplatin for 36 hours. Each treatment group, with a control, were then centrifuged at 2400 g to pack the cells into a sample with similar density to solid tumour (~109 cells per tube). Four biological replicates were performed.A 7T vertical small bore Bruker scanner was used with a 40/30 mm quadrature receive and transmit coil. T1 was quantified with IR-RARE (TE/TR=9.07ms/10s, 5 TI values logarithmically space between 20ms-8s), T2 was quantified with CPMG (TR=5s, TE=7ms with 180 echoes), and diffusion was quantified with DTI-STEAM-EPI (1 direction, 7 b-values=0-5000s/mm2, TE/TR=35ms/1.5s, 7 TM=6.7-233ms).
T1 and T2 were fitted with monoexponential functions as verified previously4. Diffusion was fitted with three different models: a monoexponential corrected for T1, kurtosis, and a ball-sphere compartment model, where the ball represents the extracellular space and the sphere represents the cells. Only the first four b-values were used for fitting the monoexponential and all but the first b-values were used for fitting kurtosis and the ball-sphere model.
Results
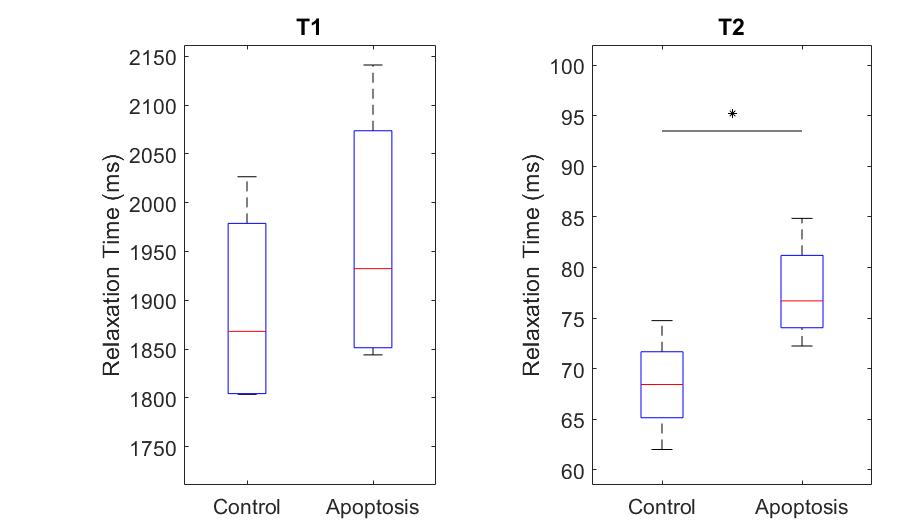
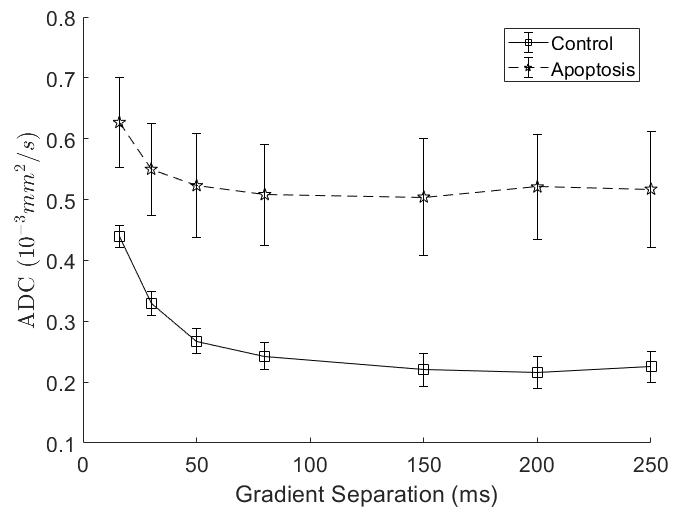
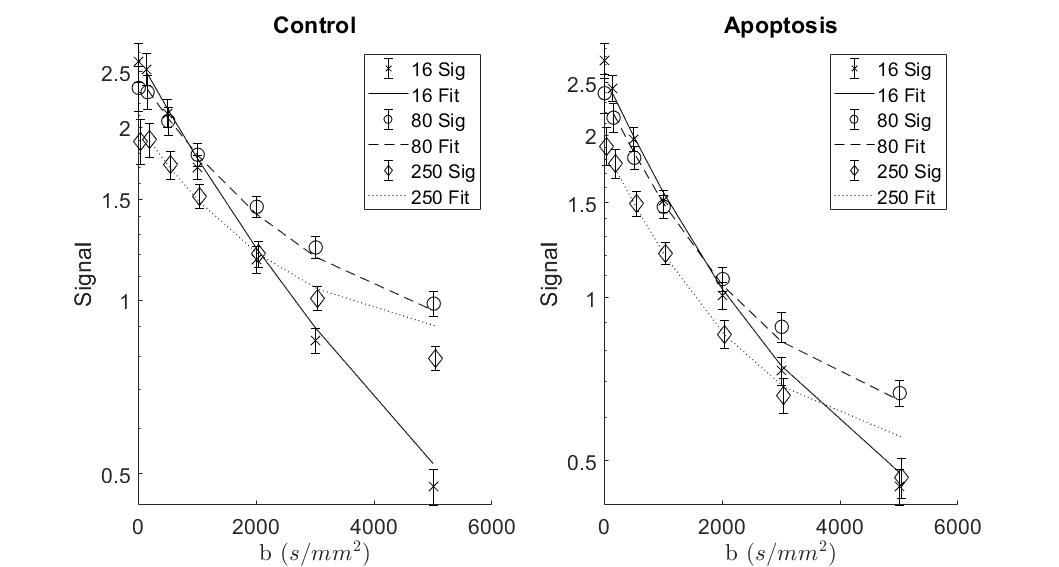
T1 did not show significant differences between groups, while T2 in the apoptotic group was longer (Figure 1).Apparent Diffusion Coefficient (ADC) for apoptosis was higher than controls at all diffusion times. The ADC decreased with diffusion times, but at a lower rate in apoptotic cells compared to the control group. Both the ADC in the T1 corrected fit (not shown) and the ADC in the kurtosis (Figure 2) fit demonstrated the same trends.
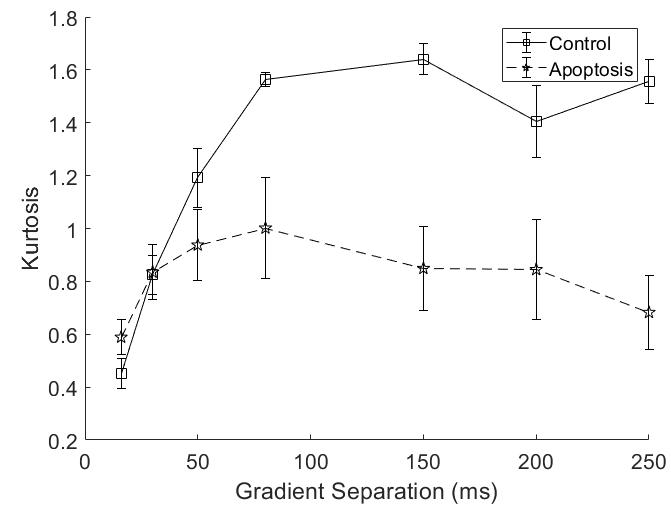
Both groups showed an increase in kurtosis at lower diffusion times with the control group having a larger increase. The apoptotic group had a relatively stable kurtosis when compared to the control group. At longer diffusion times, the control group plateaued while the apoptotic group had a gradual decrease (Figure 3).
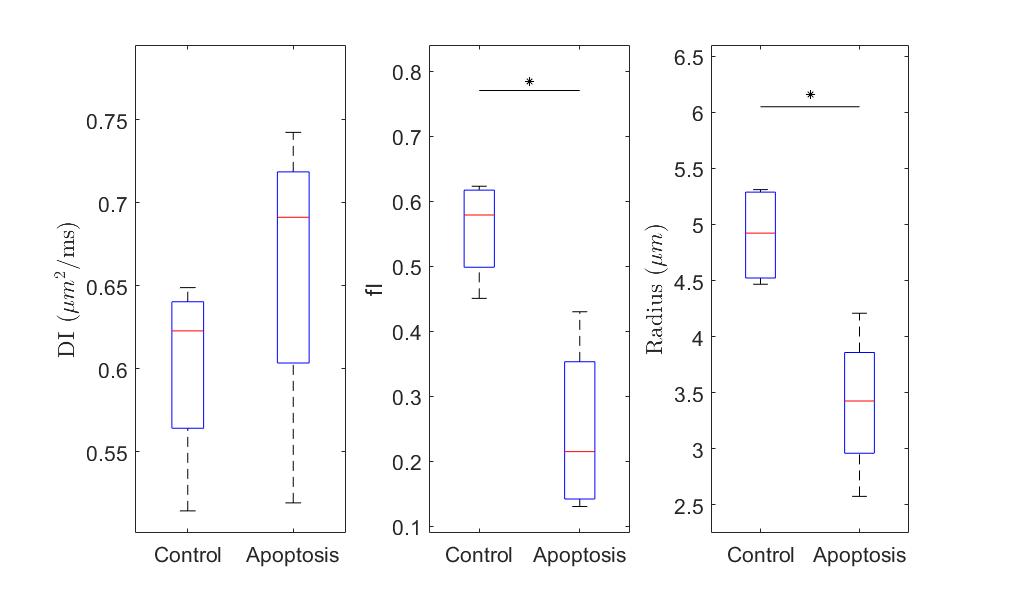
The ball-sphere model showed a higher intracellular water fraction, and a larger cell sphere radius for the control group compared with the apoptotic group while the intracellular diffusion coefficient was not significantly different (Figure 4). Fits for the ball-sphere model are worse for higher diffusion times at higher b-values (Figure 5).
Discussion/Conclusion
Quantitative T1 was not sensitive enough to detect changes with cell death 36 hours after induction, consistent with previous findings4. Although T2 showed a significant difference, T2 is generally not specific to cell death since T2 can change with inflammation5 and edema.The diffusion findings for control cells are consistent with restricted diffusion. The ADC decreased with diffusion time as the water had more time to experience restriction. The kurtosis also increased, indicating that the diffusion was more non-Gaussian, until it peaked and plateaued at a diffusion time around 75 ms. This was consistent with the results of the Ball-Sphere fitting, which found an intracellular water fraction of 0.56 ± 0.08, near the theoretical volume fraction of 0.64 for randomly packed spheres. The 4.9 ± 0.4 µm radius estimate is consistent with the approximately 10 µm cell diameter observed on phase microscopy.
The results for the apoptotic group are more difficult to interpret. Apoptotic cells exhibit significant membrane blebbing and vesicle formation on microscopy at 36 hours after cisplatin treatment, with an overall decrease in cell size and more restriction. However, the ADC values were higher for apoptotic cells and the Ball-Sphere model found a small intracellular fraction of 0.25 ± 0.14. This small intracellular fraction is not consistent with previous histological examination of apoptotic cell samples. However, the estimated cell radius of 3.4 ± 0.7 µm does suggest the presence of smaller structures. A likely explanation is that the Ball-Sphere model assumes a single sphere size describes cells, but the membrane blebbing and vesicles formed during apoptosis are better described by multiple restriction sizes. The model may therefore be fitting only the restricted signal component from smaller structures, which comprise a smaller volume fraction than the cells as a whole. This also explains the discrepancy between the model fit and the data at long diffusion times, where restriction effects from larger structures are more evident. Water exchange is also unaccounted for at longer diffusion times and is known to increase during apoptosis.
All diffusion MRI analysis methods demonstrated sensitivity to microscopic cellular death. Future work will validate diffusion model parameter changes in apoptotic cells using histology and flow cytometry, examine longer diffusion times and incorporate cell size distributions and exchange into the diffusion model, as well as extending measurements in vivo.
Acknowledgements
We would like to acknowledge MRI protocols and assistance from Wilfred Lam and Ryan Oglesby; cell work assistance from Anoja Giles. Funding/support provided by NVIDIA GPU seeding grant, Sunnybrook Foundation and Queen Elizabeth II/Sunnybrook and Women’s College Health Sciences Centre Graduate Scholarship in Science and Technology.References
1. Arruebo M, Vilaboa N, Sáez-Gutierrez B, et al. Assessment of the Evolution of Cancer Treatment Therapies. Cancers. 2011;3(3):3279-3330. doi:10.3390/cancers3033279
2. Stanisz GJ. Diffusion MR in Biological Systems: Tissue Compartments and Exchange. Isr J Chem. 2010;43(1-2):33-44. doi:10.1560/E0WU-7FFH-31M6-VLYT
3. Fieremans E, Novikov DS, Jensen JH, Helpern JA. Monte Carlo study of a two-compartment exchange model of diffusion. NMR Biomed. 2010;23(7):711-724. doi:10.1002/nbm.1577
4. Bailey C, Giles A, Czarnota GJ, Stanisz GJ. Detection of apoptotic cell death in vitro in the presence of Gd-DTPA-BMA. Magn Reson Med. 2009;62(1):46-55. doi:10.1002/mrm.21972
5. Stanisz GJ, Webb S, Munro CA, Pun T, Midha R. MR properties of excised neural tissue following experimentally induced inflammation. Magn Reson Med. 2004;51(3):473-479. doi:10.1002/mrm.20008
Figures