4427
Accuracy of axon diameter estimation using diffusion MRI in fiber space1Department of Systems Neurosciences, University Medical Center Hamburg-Eppendorf, Hamburg, Germany, 2Department of Neurophysics, Max Planck Institute for Human Cognitive and Brain Sciences, Leipzig, Germany, 3Berlin Ultrahigh Field Facility (B.U.F.F.), Max-Delbrueck-Center for Molecular Medicine in the Helmholtz Association, Berlin, Germany, 4Paul Flechsig Institute of Brain Research, University of Leipzig, Leipzig, Germany, 5Department of Radiology, University Medical Center Freiburg, Freiburg, Germany, 6Signal Processing Lab (LTS5), Ecole Polytechnique Federale de Lausanne, Lausanne, Switzerland, 7Translational Imaging in Neurology (ThINk) Basel, Department of Medicine and Biomedical Engineering, University Hospital Basel and University of Basel, Basel, Switzerland, 8Department of computer science, University of Verona, Verona, Italy
Synopsis
We investigated the effect of different diffusion MRI acquisition protocols (incl. varying gradient-strength and signal-to-noise ratio) on the accuracy of axon diameter index (ADI) estimation in fiber space for human specimens. We used the Bland-Altman plot to estimate the error in the MRI-based ADI measurement. We found that gradient strengths above 900mT/m and b-values larger than b=50k s/mm2 provided accurate estimation of ADI (error smaller than 0.13 µm). The error for the best protocol was about 0.04 µm, allowing to distinguish white matter tracts with varying effective axon diameters (e.g. corpus callosum, genu, 1.5 µm and posterior body, 1.93 µm).
Introduction
A variety of biophysical models1, 2, 3 have been proposed to estimate axon diameter index (ADI) using diffusion MRI. Recently, one of these models1 was extended to estimate ADI in fiber space4. As compared to the standard approach of estimating ADI in voxel space1, 2, 5, the fiber space approach considers different configurations of fibers within a voxel and preliminary results showed that it provides better agreement with histology6. Previous studies7, 8 assessing the influence of protocol parameters on the accuracy of ADI estimation worked in voxel space using non-human specimens. Here, we investigate how diffusion MRI protocol parameters affect the accuracy of ADI estimates in fiber space for human specimens.Methods
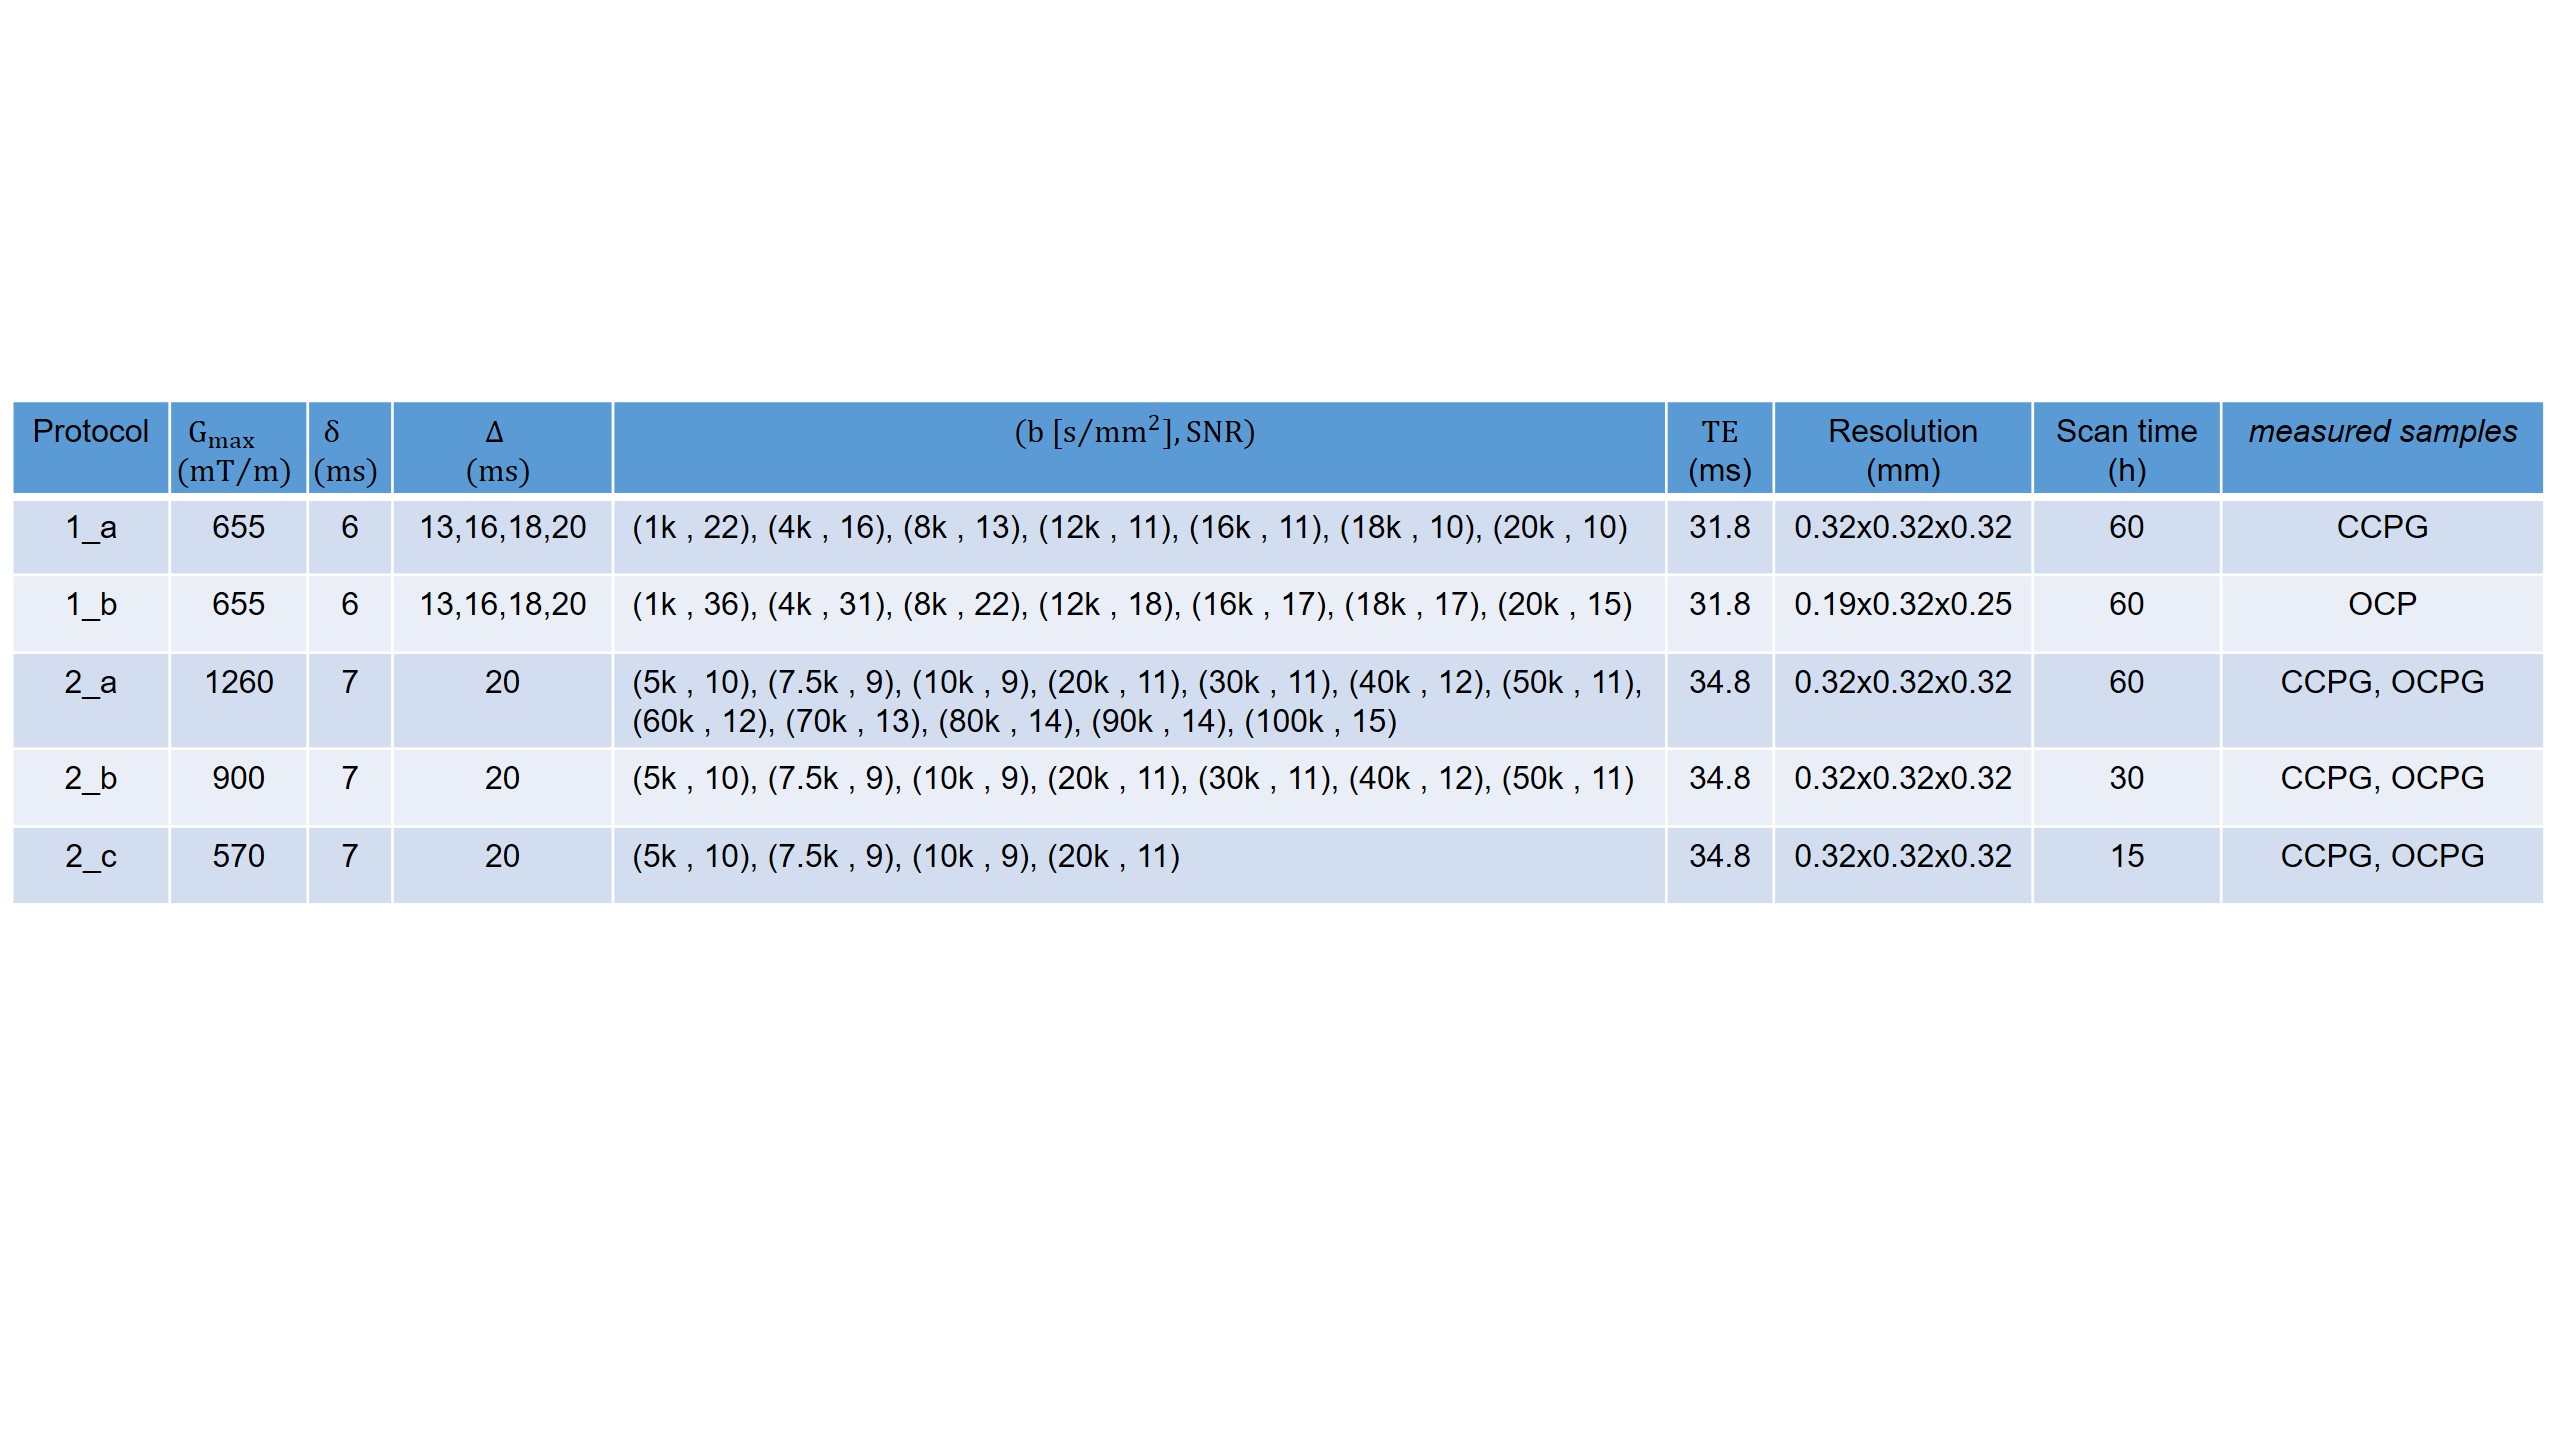
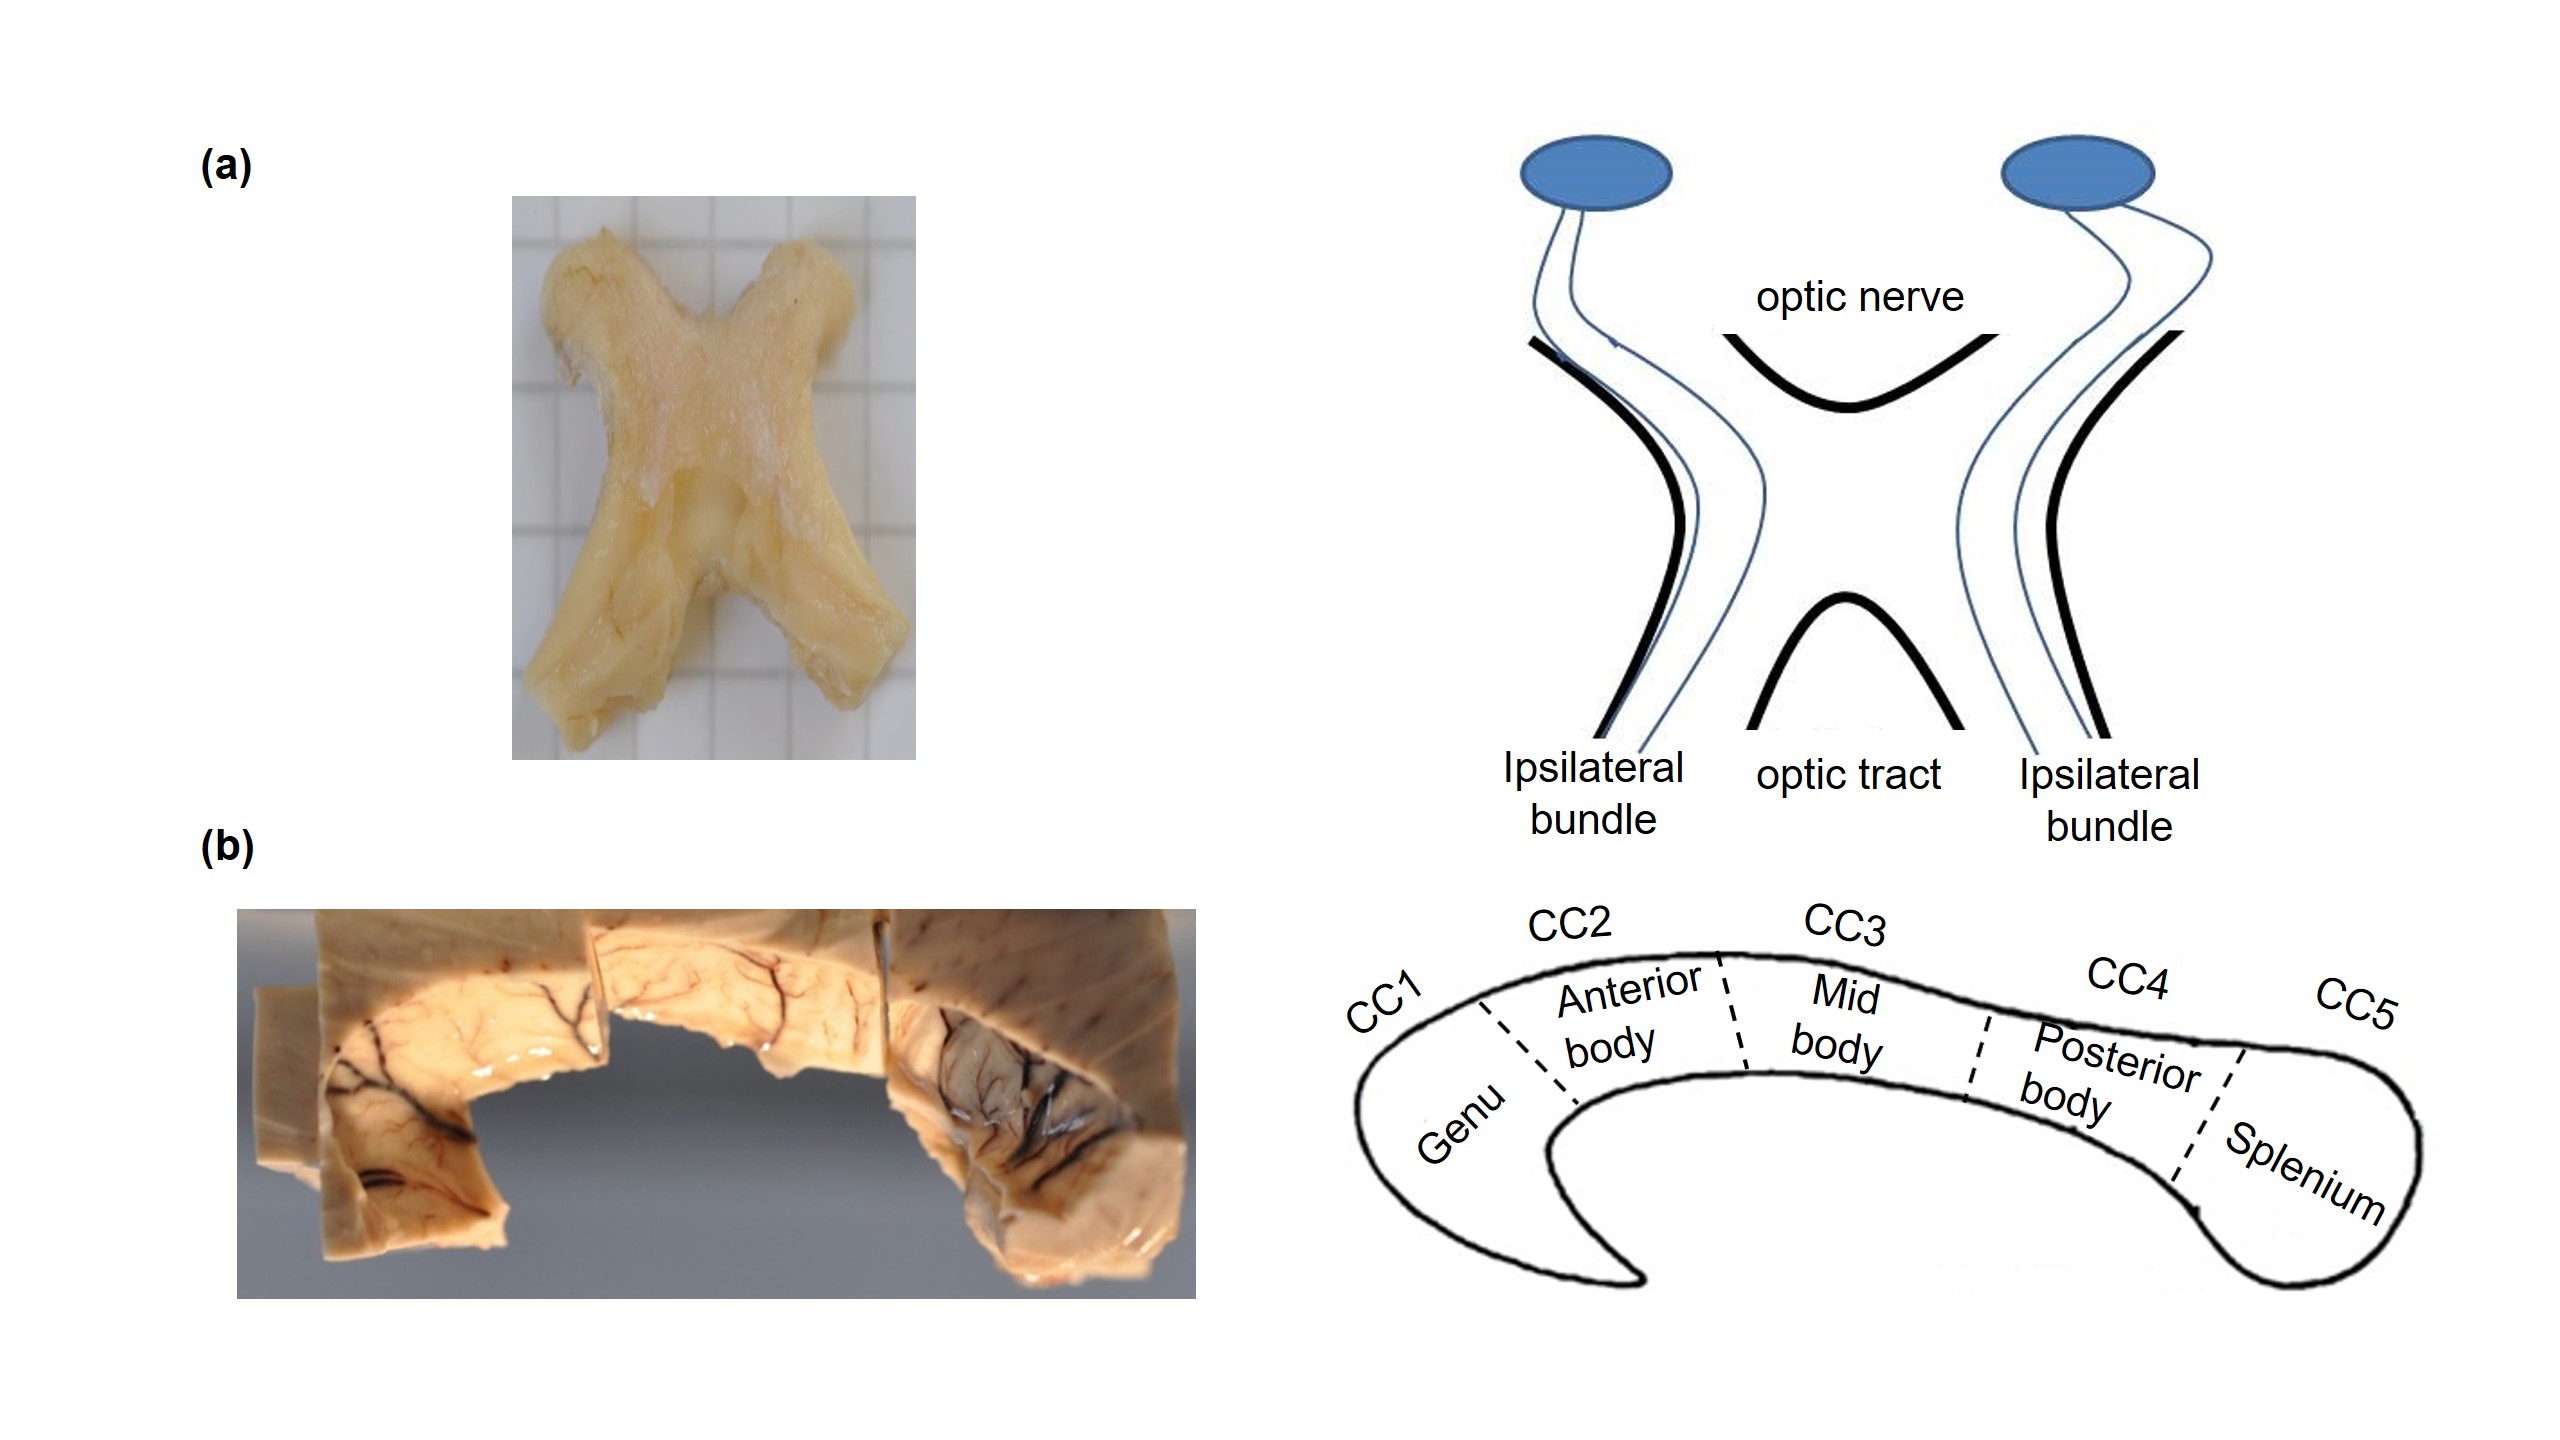
Sample: Two human optic chiasms (OC) and subregions (genu, posterior body and splenium) of two corpus callosum (CC) samples (figure 1) were obtained at autopsy with prior informed consent (20-24 hrs postmortem) and approved by the responsible authorities. Following the local standard brain bank procedures, two CC and one OC samples were immersion-fixed with 3 % paraformaldehyde + 1% glutaraldehyde (CCPG, OCPG) and one OC was fixed with 4 % paraformaldehyde (OCP).MRI: Ex vivo diffusion MRI was performed on a small bore 9.4T MR system (Bruker Biospin, Ettlingen, Germany) using two protocols (table 1):
1. Seven diffusion shells using a standard gradient coil and a 4 TX/ 4 RX RF-coil (protocol_1a) or cryogenically-cooled TX/RX RF-coil (protocol_1b), to enhance SNR. These protocols were presented together as protocol_1.
2. Twelve diffusion shells using a gradient insert coil and a 4 TX/ 4 RX RF-coil (protocol_2a). We generated extra datasets, protocol_2b and 2c, by sub-selecting the first four and seven diffusion shells.
Tractography: To generate fibers, we utilized the iFOD2 algorithm of MRtrix9. We analyzed the entire subregions of the CC but restricted the analysis of the OC to the ipsilateral bundles10 (figure 1), with the aim of comparing them to the histological analysis11, 12.
Microstructure analysis: Cylinder-Zeppelin-Ball model13 was used in COMMIT4 to describe the intra-axonal compartment with cylinders at varying radius, corresponding to ensemble-averaged axon diameters for each fiber. For each protocol, the lowest sensitive diameter of cylinder (resolution limit) was calculated as explained in14. The extra-axonal compartment was modeled with zeppelins having d||=0.6 µm2/ms for OCP or 0.5 µm2/ms for OCPG, CCPG and three d⊥= [0.24, 0.36, 0.48] µm2/ms. The isotropic diffusion was modeled by balls with diso= 2 µm2/ms.
Effective axon diameter: The mean of ADIs in MRI has been reported to be unequal to the arithmetic mean in histology15,16. We calculated the effective mean proposed in15 $$$r_{eff}=\sqrt[4]{<r^6>/<r^2>}$$$ from the histological axon diameter distribution and used it as the gold standard to assess the accuracy of the MRI-based ADI estimation for each protocol.
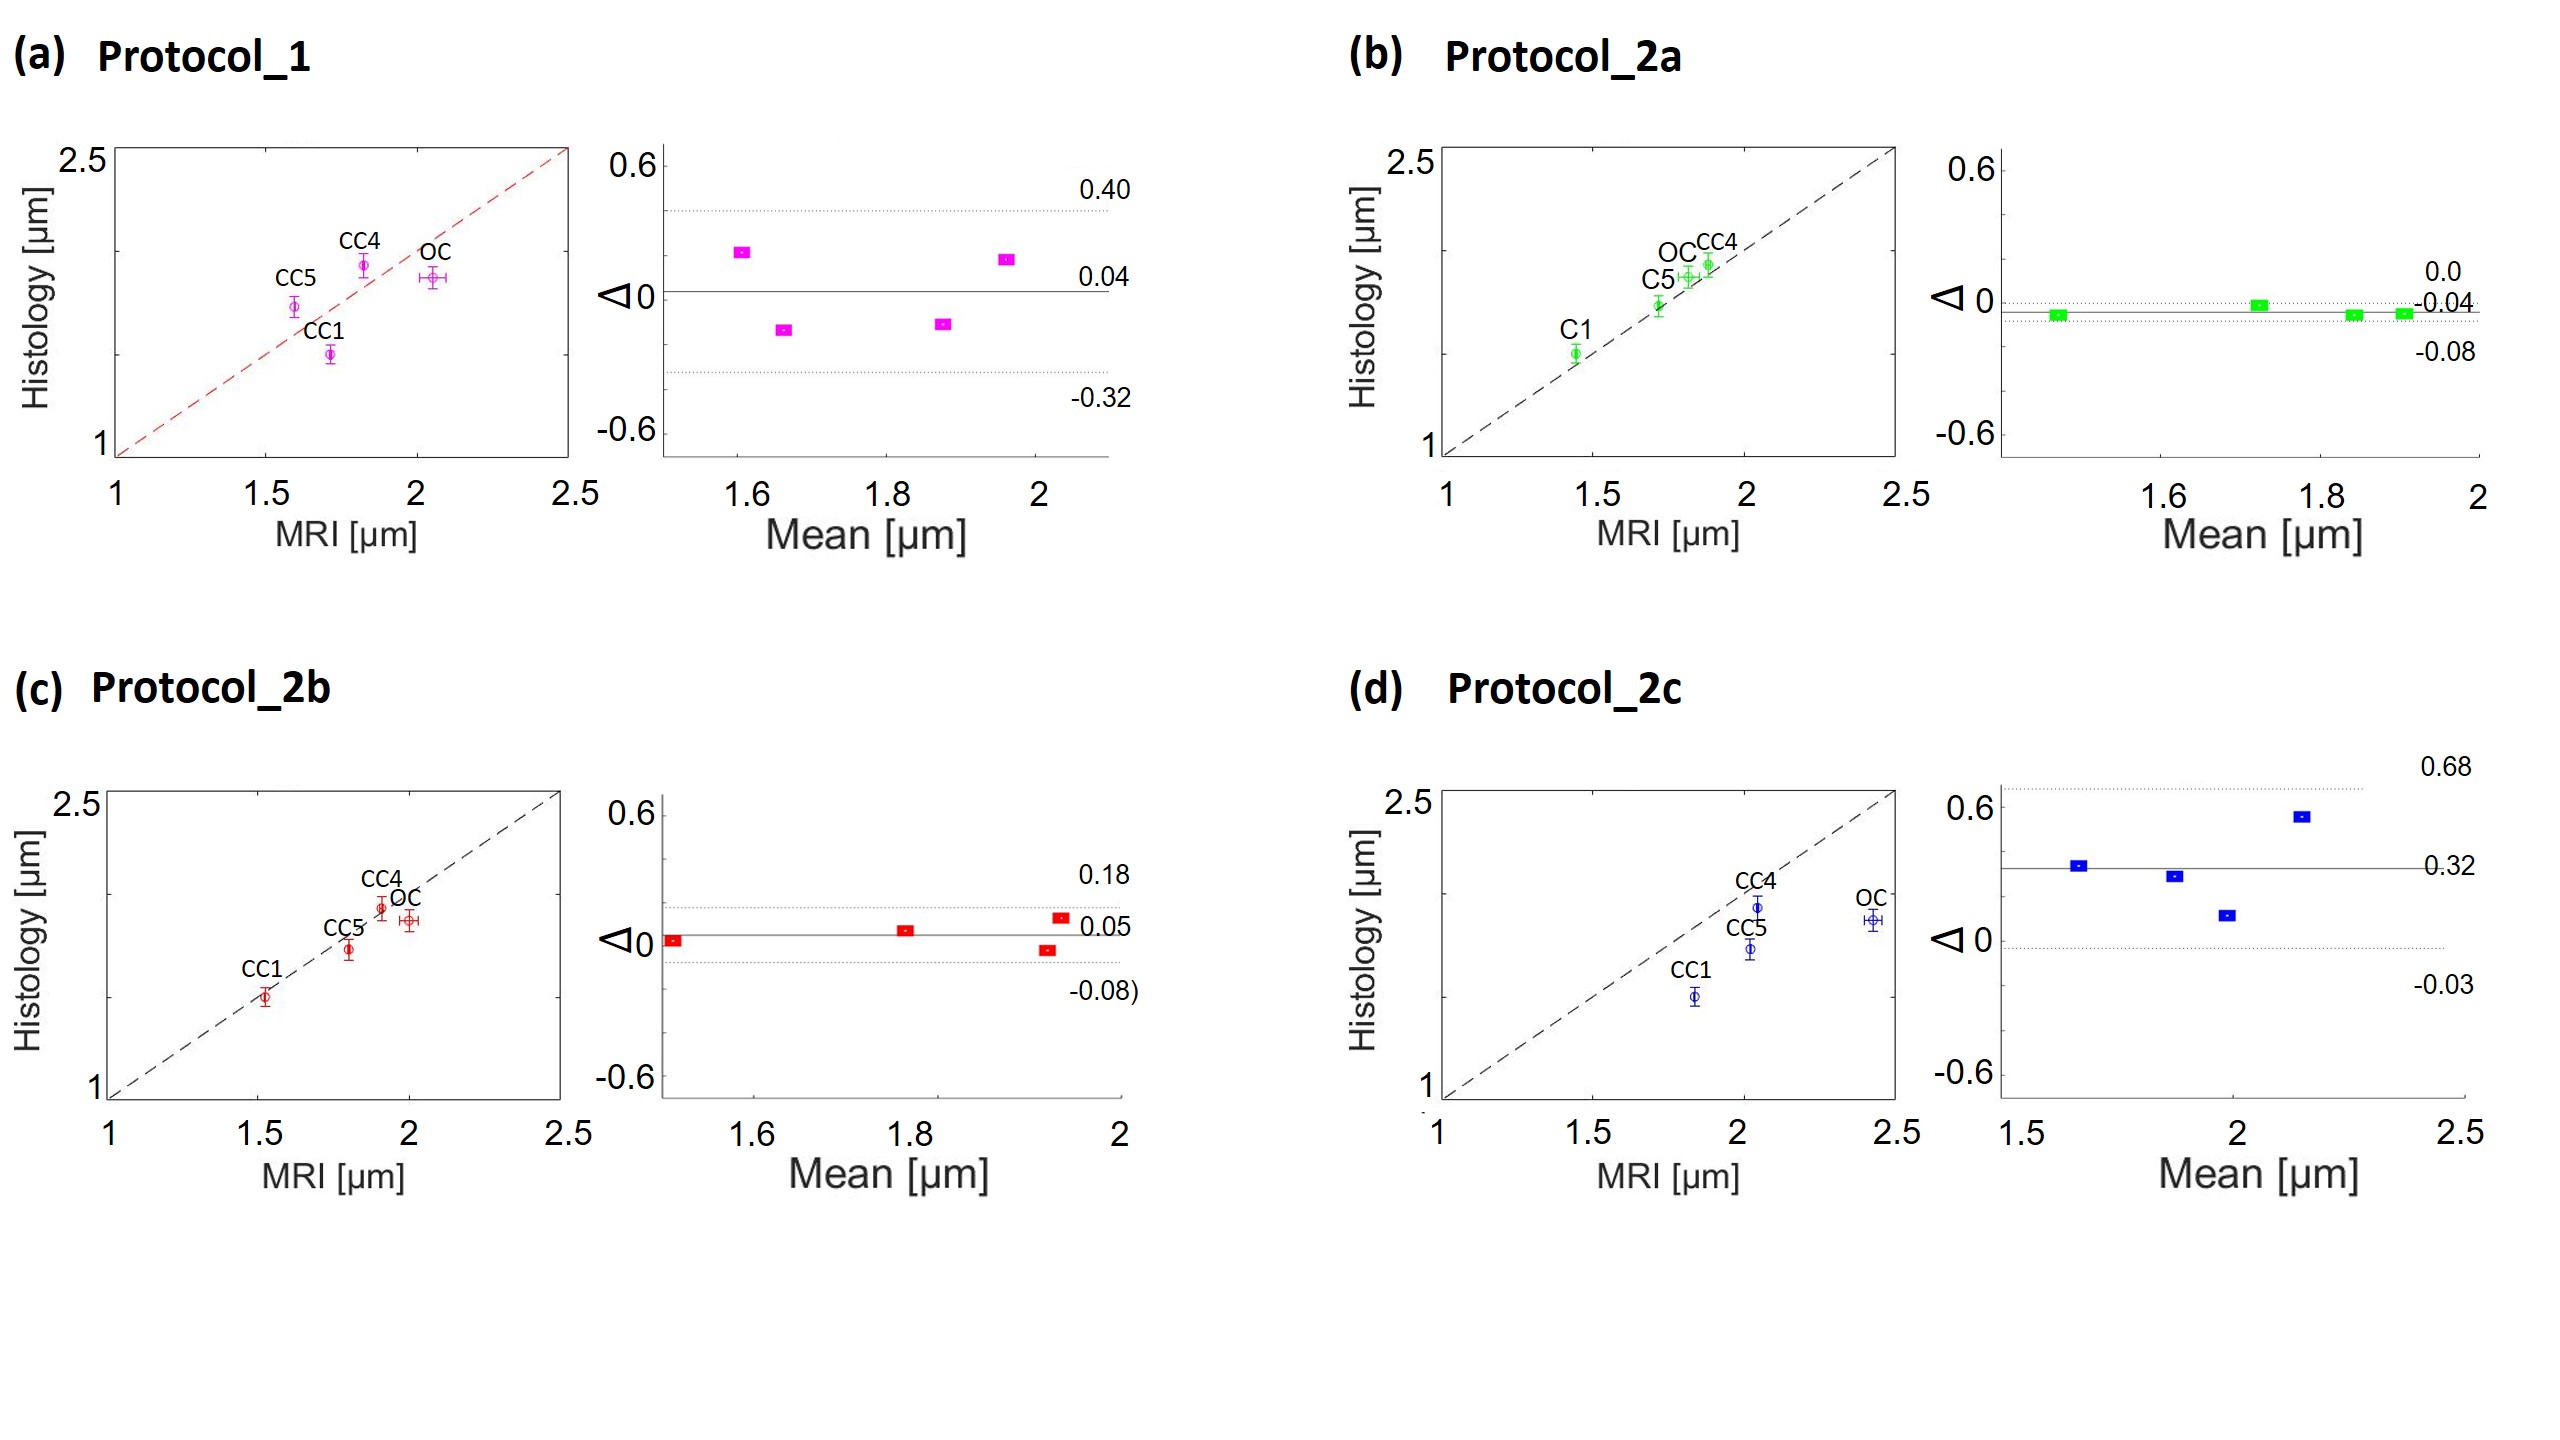
Bland-Altman plots17: In this representation the difference ΔADI = ADIMRI - ADIHist of the data is plotted against the mean mADI= (ADIMRI + ADIHist)/2 . If there is no obvious relation between the difference and the mean in the Bland-Altman plot, error introduced when replacing the electron microscopy-based axon diameter by the corresponding MRI-based ADI can be estimated by the standard deviation of the difference std (ΔADI).
Results and Discussion
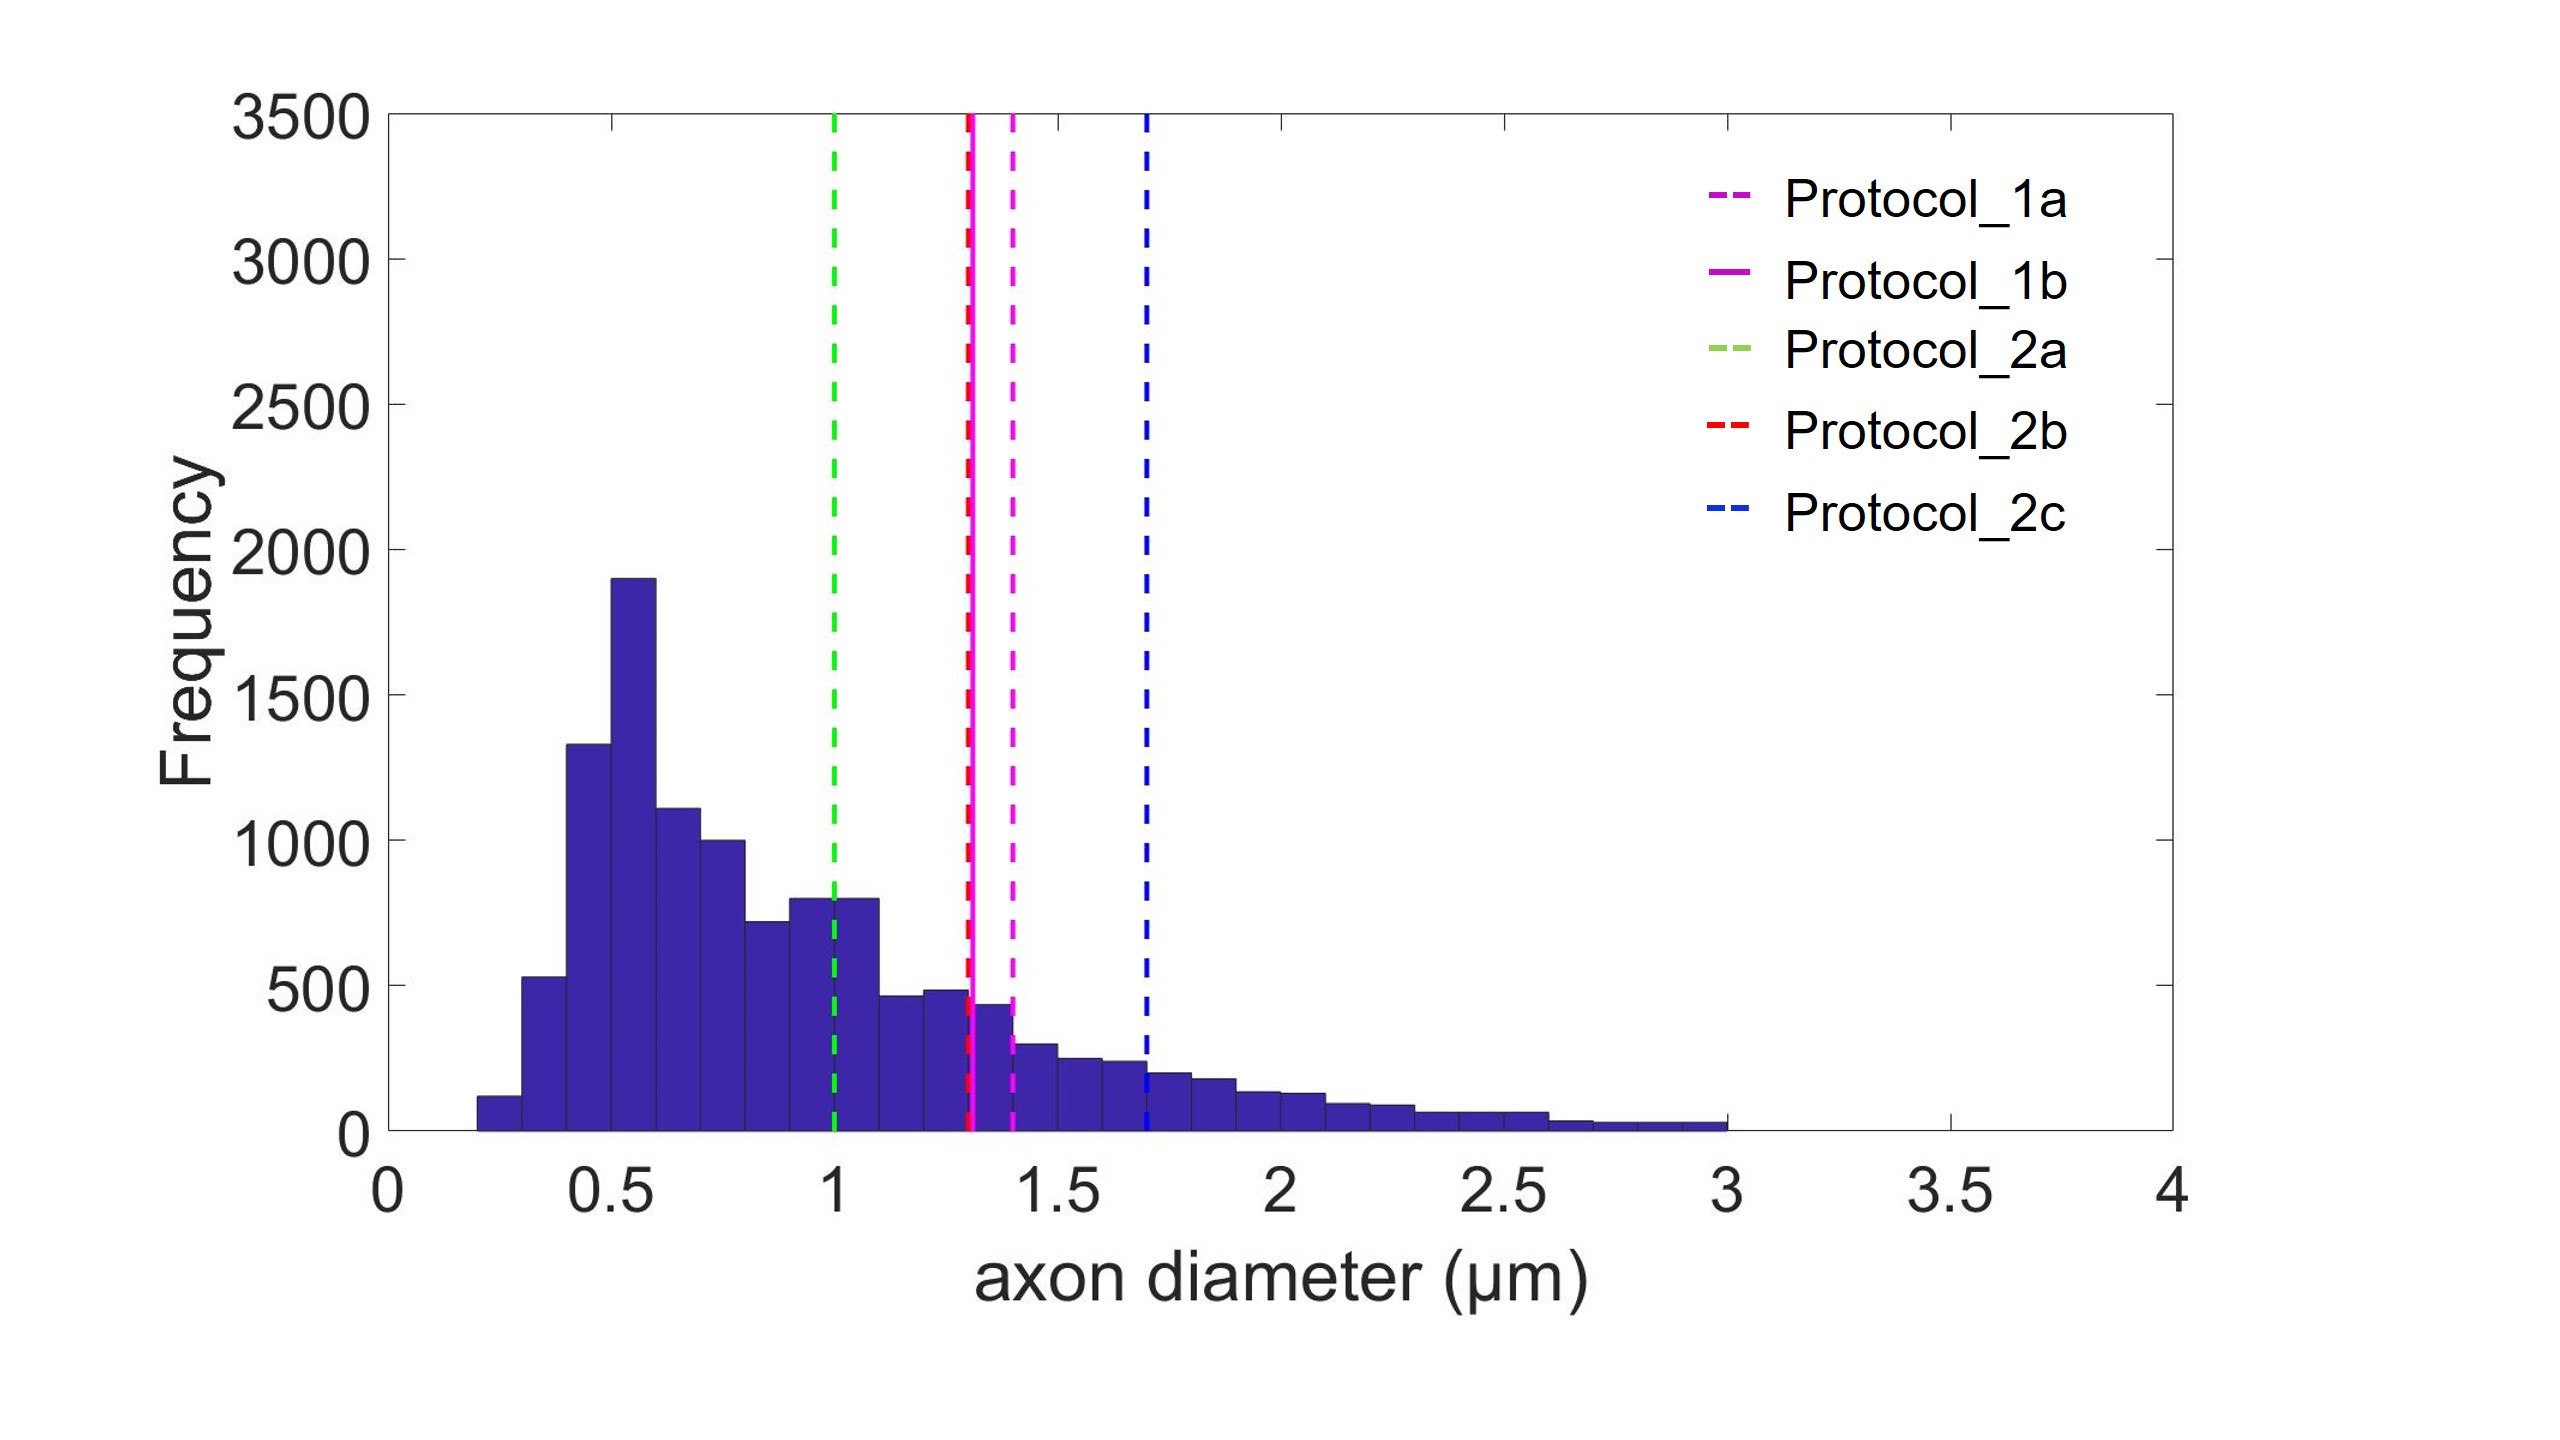
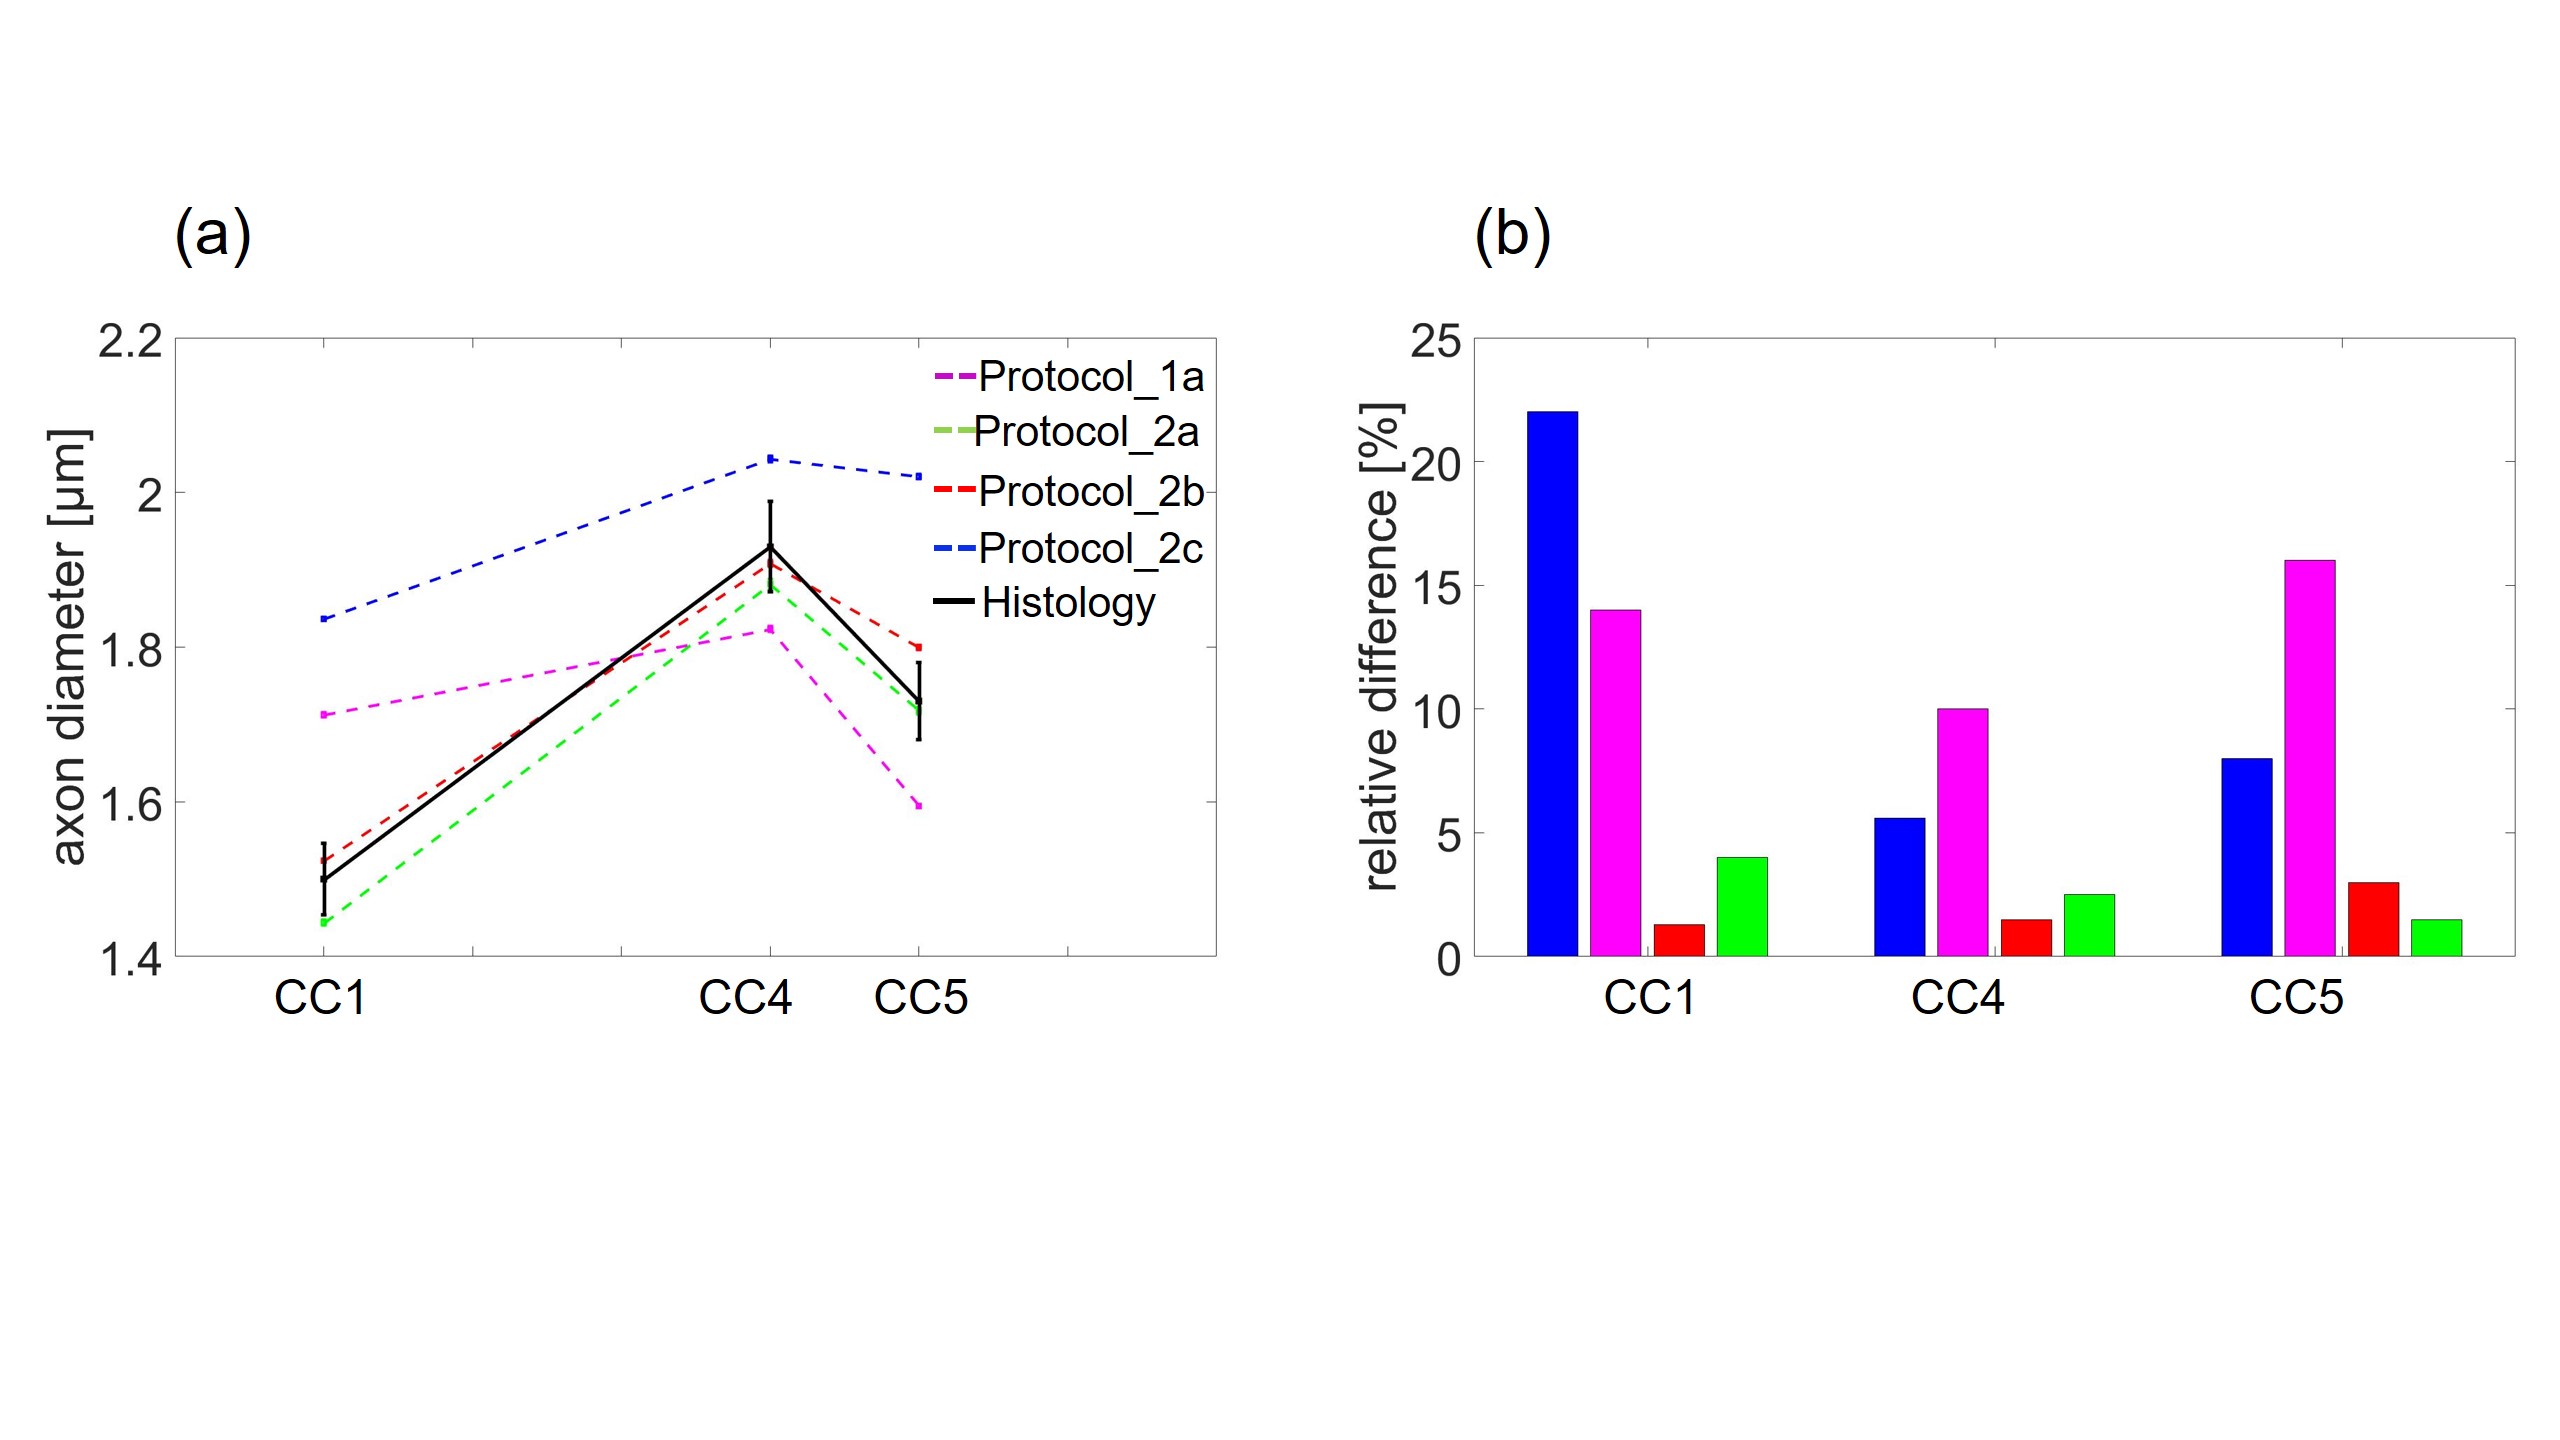
The theoretical resolution limit14 of MRI-based ADI estimation was the smallest for protocol_2a (1 µm) and the largest for protocol_2c (1.73 µm) (figure 2). The mean ADI in the CC subregions followed the well-known12 low-high-low trend for all protocols (figure 3a). However, the mean ADI estimated from protocols with larger gradients (protocol_2a and 2b) resembled closely the corresponding histological axon diameters. This was particularly apparent for the genu where the frequency of small-diameter axons is larger (figure 3b). The error of the Bland-Altman plot between MRI-based ADI and effective mean from gold standard varied between protocols (figure 4), it was the smallest for protocol_2a (0.04 µm), intermittent for protocol _2b (0.13 µm), and the largest for protocol_1 and 2c (0.36 µm). The relevance of better SNR vs. higher gradient strength and b-value, could be measured when comparing the OC sample in protocols 1b and 2b. ADI measured with protocol_1b with higher SNR but lower maximal b-value and gradient strength had a larger difference to histology ( ΔADI = 0.18 µm, figure 4a) than when using protocol 2b ( ΔADI = 0.12 µm , figure 4c).Conclusion
Our results show that the error in fiber space with protocols_2a and b, is small enough to distinguish between white matter tracts with varying effective axon diameters (e.g. between genu, 1.5 µm and posterior body, 1.93 µm). On the opposite, these fiber pathways would be indistinguishable for MRI-based ADI using protocol_1 and 2c. The small error for protocols_2a and b could be due to the larger gradient strength which increases the resolution limit7,14 or due to the suppression of the signal from the extra-axonal space3. To the best of our knowledge, this is the first study that puts an error margin on the MRI-based ADI and thus allows to assess its ability in distinguishing of ADIs of different fiber pathways. However, the presented preliminary results need further validation because they may be affected by the low number of samples and unkown inter-subject varibility (i.e. histological literature values were compared with MRI-based ADI from our samples).Acknowledgements
Acknowledgments: This work was supported by the German Research Foundation (DFG Priority Program 2041 "Computational Connectomics”, [AL 1156/2-1;GE 2967/1-1; MO 2397/5-1; MO 2249/3–1], by the Emmy Noether Stipend: MO 2397/4-1) and by the BMBF (01EW1711A and B) in the framework of ERA-NET NEURON and the Forschungszentrums Medizintechnik Hamburg (fmthh; grant 01fmthh2017). The research leading to these results has received funding from the European Research Council under the European Union's Seventh Framework Programme (FP7/2007-2013) / ERC grant agreement n° 616905References
1. Alexander, D.C. et al. Orientationally invariant indices of axon diameter and density from diffusion MRI. NeuroImage, 52(4):1374–1389, 2010.
2. Assaf, Y. et al. AxCaliber: a method for measuring axon diameter distribution from diffusion MRI. Magn Reson Med, 59:1347–1354, 2008.
3. Veraart, J. et al. Validating MR axon diameter mapping using confocal microscopy. ISMRM 2019.
4. Daducci, A. et al. COMMIT: Convex optimization modeling for microstructure informed tractography. IEEE transciption on medical imaging, 34(1): 246-257, 2015.
5. Daducci, A. et al. Accelerated Microstructure Imaging via Convex Optimization (AMICO) from diffusion MRI data. Neuroimage, 105:32–44, 2015.
6. Ashtarayeh, M. et al. Estimation of Axon diameter index estimation in fixed human optic chiasm: voxel or streamline space ?. OHBM 2019.
7. Dyrby, Tim B. et al. Contrast and Stability of the Axon Diameter Index from Microstructure Imaging with Diffusion MRI. Magnetic Resonance in Medicine 70:711–721, 2013.
8. Sepehrband, F. et al. Towards higher sensitivity and stability of axon diameter estimation with diffusionweighted MRI, NMRM Biomed, 29(3): 293-308, 2016.
9. Tournier, J-D. et al. MRtrix3: A fast, flexible and open software framework for medical image processing and visualization. NeuroImage, 202, 2019.
10. Glen, J. et al. Segregated hemispheric pathways through the optic chiasm distinguish primates from rodents. Neuroscience, 157 (3), 2008.
11. Jonas, JB. et al. Histomorphometry of the Human Optic Nerve. Investigative Ophthalmology & Visual Science,31,1990.
12. Aboitiz, F. et al. Fiber composition of the human, corpus callosum, Biol Res 25:51-61, 1992.
13. Panagiotaki, E. et al. Compartment models of the diffusion MR signal in brain white matter: A taxonomy and comparison. NeuroImage, 59(3):2241–2254, 2012.
14. Nilsson, M. et al. Resolution limit of cylinder diameter estimation by diffusion MRI: The impact of gradient waveform and orientation dispersion. NMR in biomedicine 30(7), 2017.
15. Benjamini, Dan. et al. White matter microstructure from non parametric axon diameter distribution mapping. NeuroImage,135: 333-344,2016.
16. Burcaw, L.M, et al. Mesoscopic structure of neuronal tracts from time-dependent diffusion, NeuroImage, 114:18–37,2015.
17. Bland, M. et al. Statistical methods for assessing agreement between two methods of clinical measurement, The LANCET,327:307-310,1986.
18. Schutter, D. et al. The corpus callosum: A commissural road to anger and aggression. Neuroscience & Biobehavioral Reviews 37:2481-2488,2013.
Figures