4426
Improving neural soma imaging using the power spectrum of the free gradient waveforms1Cardiff University Brain Research Imaging Centre (CUBRIC), School of Psychology, Cardiff University, Cardiff, United Kingdom, 2Centre for Medical Image Computing, Department of Computer Science, University College London, London, United Kingdom, 3Clinical Sciences Lund, Radiology, Lund University, Lund, Sweden, 4Mary MacKillop Institute for Health Research, Faculty of Health Sciences, Australian Catholic University, Melbourne, Victoria, 3065, Australia
Synopsis
Diffusion magnetic resonance imaging is a non-invasive technique to probe the microstructural features of tissue. Conventional diffusion encoding is unable to disentangle different microstructural features; therefore, multidimensional diffusion encoding has been proposed previously to solve this problem. Here we investigate different combinations of b-tensor encoding in a three-compartment model called SANDI. To estimate the size of soma in this model, we use frequency domain analysis because optimized b-tensor encoding waveforms do not provide a well-defined diffusion-time. The results show that different combinations of linear, planar, and spherical tensor encoding can improve the estimation of a specific parameter.
INTRODUCTION
Diffusion magnetic resonance imaging (dMRI) is a non-invasive technique widely used to study brain microstructure. Biophysical modeling is often used to solve the inverse problem of inferring relevant tissue features (such as cell size, shape, and orientation) from the measured dMRI signal1-3. However, when complex multi-compartment models are used, such an inverse problem can be highly ill-posed and give rise to degeneracies in the model-parameter estimation4,5.In this work, we focus on a recently proposed three-compartment model for non-invasive neural soma imaging called SANDI6, which assumes that it is possible to decompose the measured dMRI signal into three main sources: neurites, cell bodies (namely soma); and extra-cellular space where the diffusion in each of these compartments will have a time-dependence if there is any sensitivity to the size of that compartment.
Unfortunately, SANDI, like any other multi-compartment model4, may suffer from degeneracy of the model parameters. However, multidimensional diffusion encoding7 has been recently proposed to resolve such degeneracies8-11. For example, Gyori et al.11 used LTE+STE in a SANDI-like model. This study aims to investigate whether, and which combination of, multidimensional diffusion encodings can be used to effectively resolve the degeneracy of SANDI model parameter estimation.
METHODS
In the SANDI framework, the dMRI signal measured in brain tissue is assumed to arise from three main non-exchanging compartments: intra-neurite (modeled as diffusion in sticks), intra-soma (modeled as restricted diffusion in a sphere) and extra-cellular (modeled as isotropic Gaussian diffusion).For a general B-matrix, the diffusion-weighted MR signal is:
$$S(\mathbf{B})/S_0=f_{ic}(f_{in}\int_{\mathbb{S}^2}W(\kappa,\mathbf{n})e^{-\mathbf{B}:\mathbf{D_i}(\mathbf{n})} d\mathbf{n}+f_{is}S_{is}(D_{is}(t),\mathbf{B}))+f_{ec}e^{-bD_{ec}}\quad(1)$$
where $$$f_{in}$$$, $$$f_{ec}$$$, $$$f_{is}$$$, $$$\mathbf{D_i}(\mathbf{n})=D_{in}\mathbf{n}\mathbf{n}^T$$$, $$$D_{ec}$$$ and $$$D_{is}$$$ are the intra-neurite, extra-cellular, and intra-soma signal fractions and diffusivities, respectively. $$$f_{ic}$$$ is the intracellular signal fraction where $$$f_{ic}+f_{ec}=1$$$ and $$$f_{in}+f_{is}=1$$$. $$$S_{is}$$$12 is intra-soma diffusion signal, $$$W(\mathbf{n})$$$ is the Watson orientation distribution function (ODF) and $$$\kappa$$$ is the dispersion parameter. $$$B=b/3(1-b_\Delta)I_3+bb_\Delta\mathbf{g}\mathbf{g}^T$$$, where $$$\mathbf{g}$$$ is the diffusion gradient direction and the b-value, $$$b$$$, is the trace of the b-matrix. For linear (LTE), planar (PTE) and spherical (STE) tensor encoding, $$$b_\Delta$$$=1, -1/2, and 0 respectively13.
The powder-averaged signal is:
$$S/S_0=f_{ic}(f_{in}\frac{\sqrt{\pi}e^{-\frac{b}{3}D_{in}(1-b_\Delta)}erf(\sqrt{bb_\Delta D_{in}})}{2\sqrt{b b_\Delta D_{in}}}+f_{is}S_{is}(D_{is}(t),b_{\Delta}))+f_{ec}e^{-bD_{ec}}\quad(2)$$
Here, we use numerical simulations and experiments in-vivo in healthy volunteers to investigate the potential of combining efficient gradient waveforms for LTE, PTE and STE to improve the estimation of the five model parameters $$$f_{in}$$$, $$$f_{ec}$$$, $$$D_{in}$$$, $$$D_{ec}$$$ and $$$D_{is}$$$. As we analyze the direction-averaged signal, we don’t need to estimate dispersion. For these complex gradient waveforms, the diffusion time is ill-defined and therefore we consider the diffusion spectrum $$$D_{is}(\omega )$$$14-16 in our analyses of compartment size.
The restricted diffusion signal inside the sphere is, $$$S_{is}=\exp{(-\beta)}$$$ where $$$\beta$$$ is15, 16:
$$\beta=\frac{1}{2\pi}\int_{-\infty}^{\infty}\mathbf{F}^T(\omega)D_{is}(\omega)\mathbf{F}(-\omega)d\omega\quad(3)$$
where $$$\mathbf{F}(\omega)=\int_{0}^{\tau}\mathbf{F}(t)e^{-i\omega t}dt$$$, $$$\mathbf{F}(t)=\gamma\int_{0}^{t}\mathbf{g}(t')dt'$$$, $$$\mathbf{g}(t)$$$ is the gradient waveform, and $$$\gamma$$$ is the gyromagnetic ratio. $$$D_{is}(\omega)$$$ is given by15:
$$D_{is}(\omega)=\sum_iB_i\frac{a_iD_0\omega^2}{a_i^2D_0^2+\omega^2}\quad(4)$$
where $$$a_i=(\mu_i/R_s)^2$$$, $$$B_i=2(R_s/\mu_i)^2/(\mu_i^2-2)$$$, $$$R_s$$$ is the sphere radius and $$$\mu_i s$$$ are the roots of the derivatives of the first order spherical Bessel function $$$j_1'(\mu_i)= 0$$$. $$$D_{0}$$$=2 $$$\mu m^2/ms$$$, as proposed in6.
Simulations. The numerical simulations were performed using the model in (1), with 100 different physically plausible combinations of the five parameters randomly distributed in the intervals: 0.25<$$$f_{in}$$$<0.75, 0.25<$$$f_{ec}$$$<0.75, 0.6<$$$D_{in}$$$ and $$$D_{ec}$$$<2.5$$$\mu m^2 /ms$$$, 3<$$$R_s$$$<10 $$$\mu m$$$ and $$$\kappa$$$=11. The simulated protocol comprised one b=0 and 15 shells (b=1-15$$$ms/ \mu m^2$$$ with step size of 1$$$ms/ \mu m^2$$$) for LTE and 12 shells ($$$b_{max}$$$=12 $$$ms/ \mu m^2$$$) for PTE of 60 directions each and 5 shells for STE ($$$b_{max}$$$=5 $$$ms/ \mu m^2$$$) of 3 directions each and SNR = 50 with Rician noise. The diffusion signal was direction-averaged over the same b-value and b-tensor shapes.
Experiments. In vivo data were collected using a 3T Connectom scanner with a maximum gradient strength of 300 $$$mT/m$$$. The imaging protocol was the same as the simulation. One healthy participant was scanned with TE=88ms and TR=3000ms. The imaging matrix was $$$78×78×22$$$ and the voxel size 3mm isotropic.
RESULTS
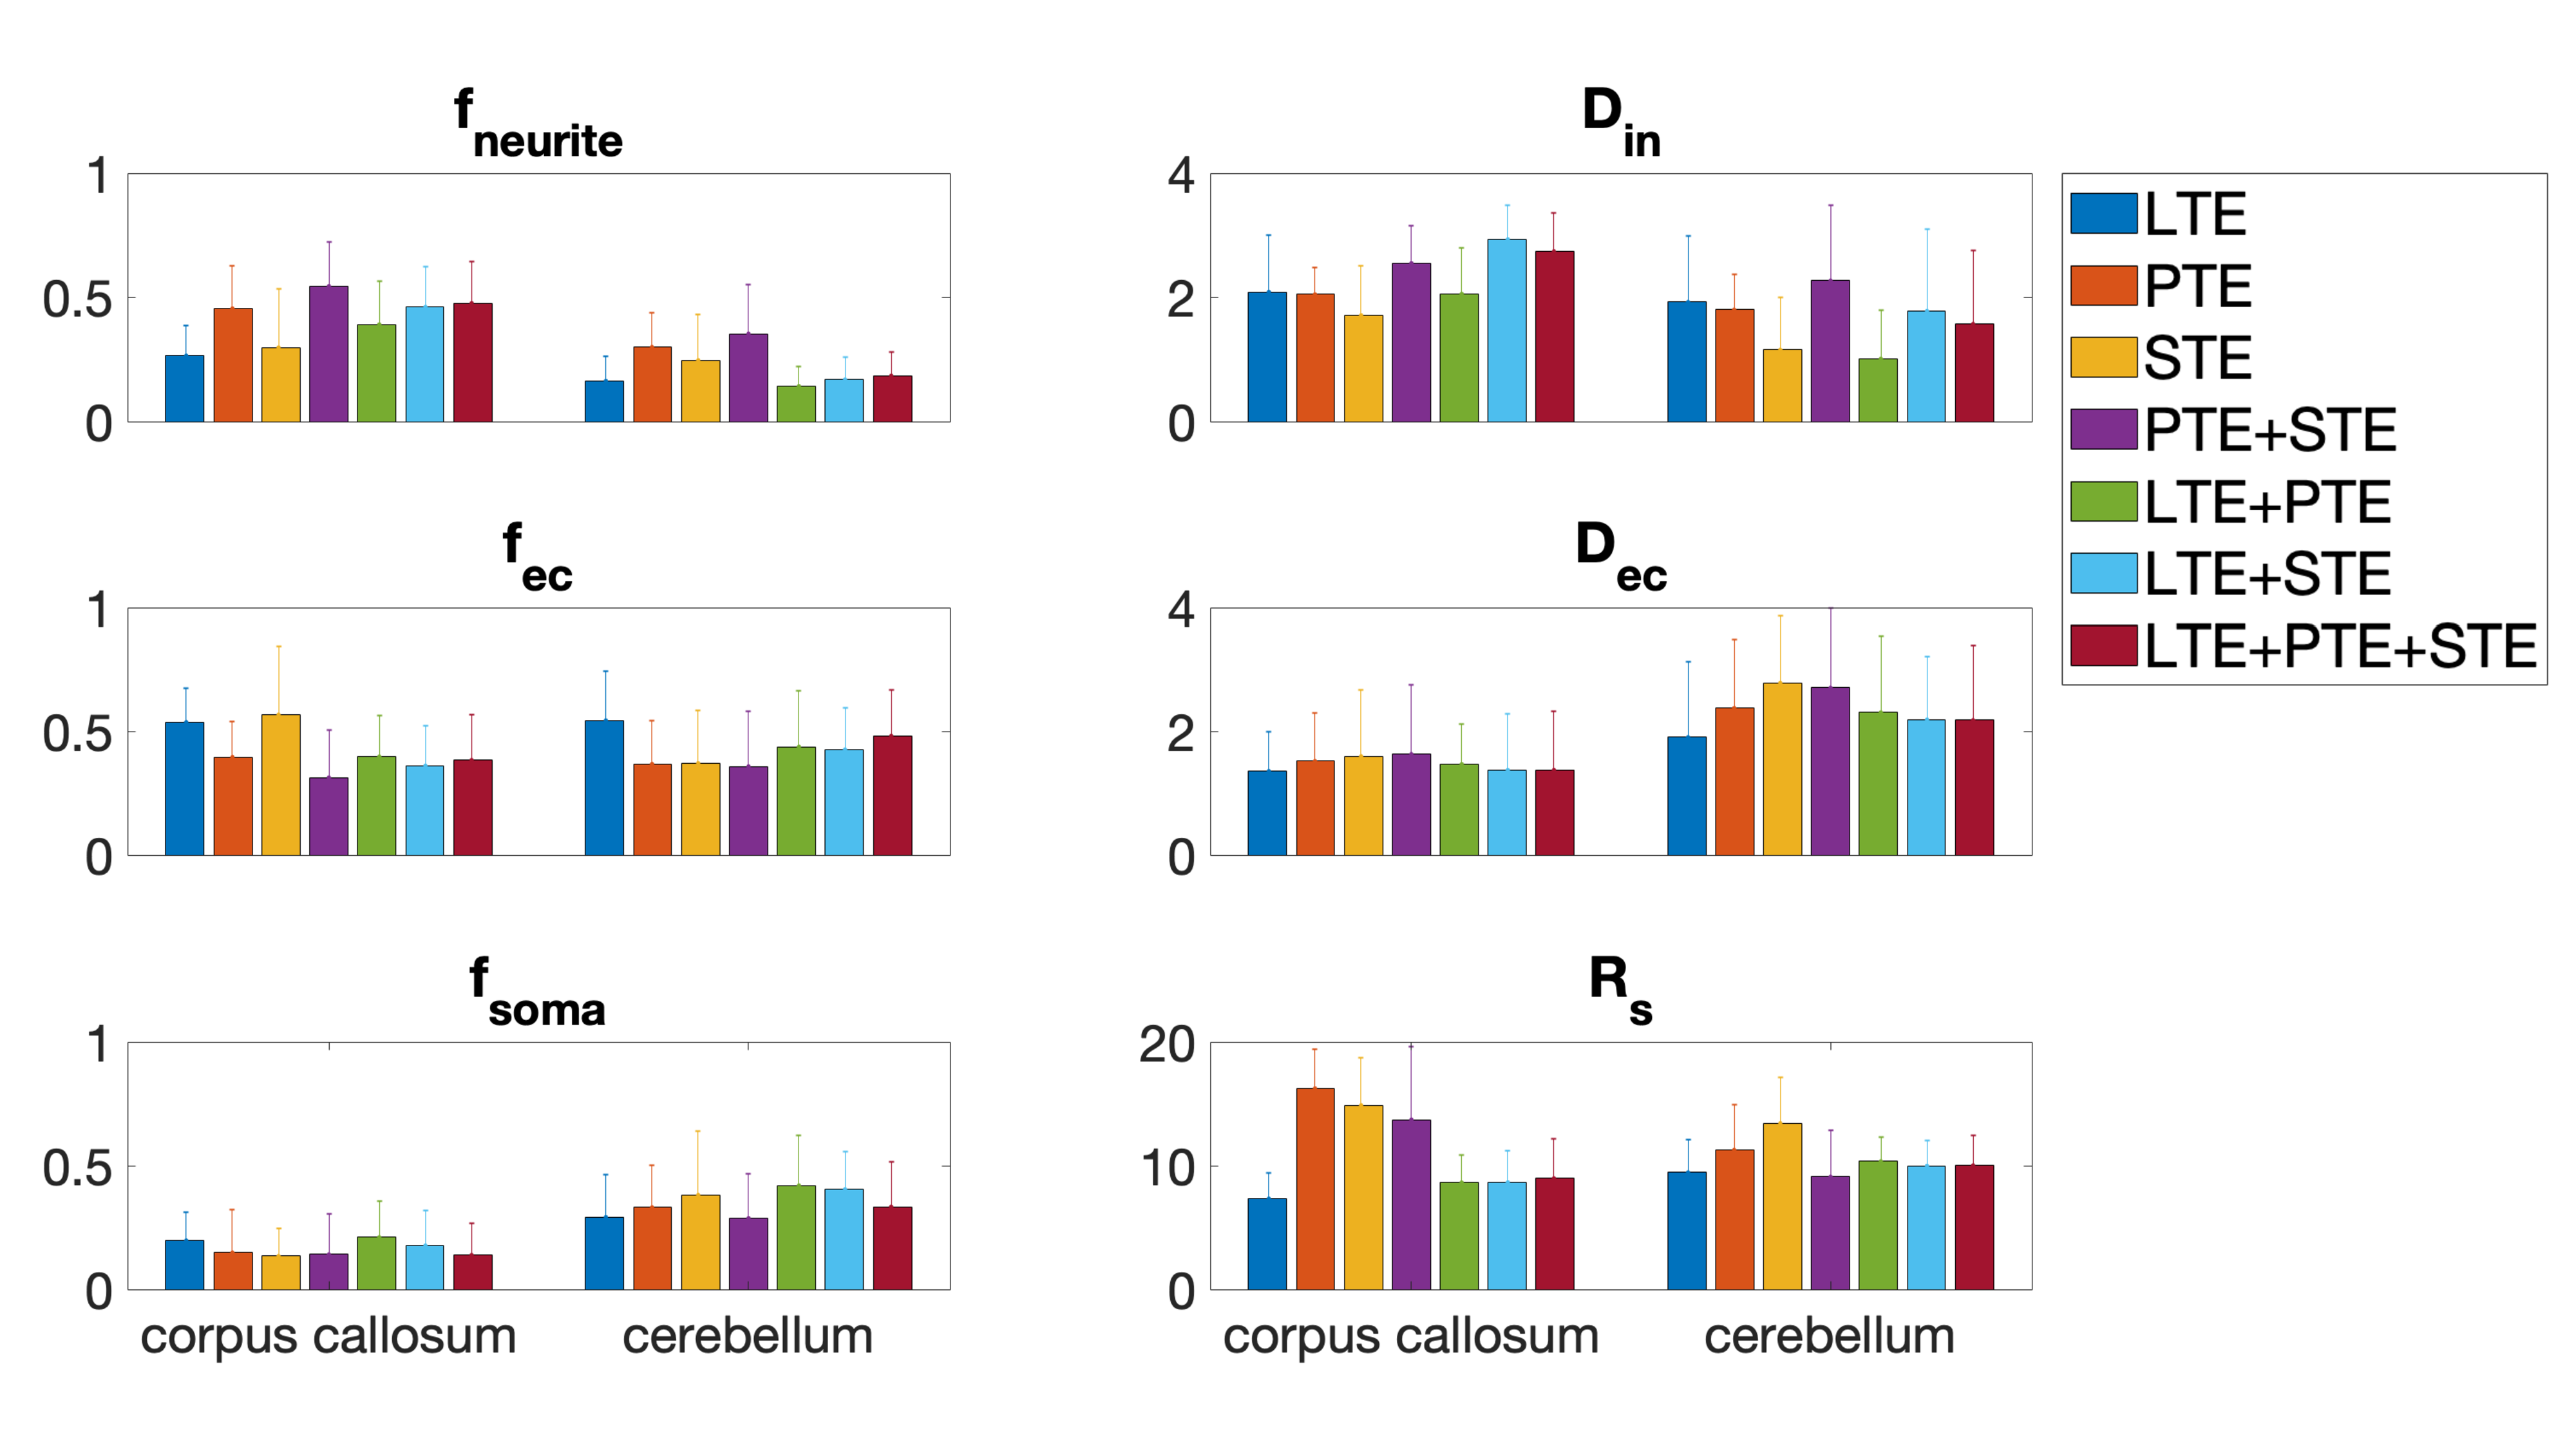
Fig. 1 shows the free gradient waveforms of the linear, planar, spherical tensor encoding and the corresponding spectrum. Fig. 2 illustrates the signal decay inside the spherical and cylindrical compartments using different encoding schemes. Fig. 3 shows the results of the simulation. Different combinations of tensor encoding have been compared and the combination of LTE+PTE+STE gives the best estimation of the signal fractions. For $$$D_{in}$$$, LTE+PTE is the best and finally, LTE provides the best estimation of $$$D_{ec}$$$ and $$$R_s$$$. Fig. 4 shows the estimated parameters of the three-compartment model for the in vivo brain image. Fig. 5 illustrates the mean and std of the parameters in the corpus callosum and cerebellum. Note with 3 mm isotropic resolution, partial volume effects from CSF can be substantial, which may be addressed in future work by including a CSF compartment in the model (and additional low b-value measurements to aid its fitting).DISCUSSION AND CONCLUSION
In this study, we used the frequency domain approach to identify the combination of b-tensor encodings that maximizes the accuracy of estimates of the SANDI model parameters. Our results extend and complement existing SANDI work, showing (in vivo and in silico) that different combinations of b-tensor encodings provide optimal estimates for different SANDI parameters, and provide the first ever in vivo estimates of soma size using the frequency domain.Acknowledgements
The data were acquired at the UK National Facility for In Vivo MR Imaging of Human Tissue Microstructure funded by the EPSRC (grant EP/M029778/1), and The Wolfson Foundation. MA and DKJ are supported by a Wellcome Trust Investigator Award (096646/Z/11/Z) and a Wellcome Trust Strategic Award (104943/Z/14/Z). The authors would like to thank Filip Szczepankiewicz for providing the pulse sequences for b-tensor encoding. DCA is supported by UK EPSRC (EP/M020533/1, EP/N018702/1, EP/R006032/1), EU Horizon 2020 (634541-2); GHZ and MP are supported by UK EPSRC EP/N018702/1.References
1. Mitra PP, Sen PN, Schwartz LM, LeDoussal P. Diffusion propagator as a probe of the structure of porous media. Phys. Rev. Lett. 1992;68:3555–3558.
2. Basser PJ, Mattiello J, Le Bihan D. Estimation of the Effective Self-Diffusion Tensor from the NMR Spin Echo. J. Magn. Res. B. 1994;103:247–254.
3. Wiegell MR, Larsson HB, Wedeen VJ. Fiber Crossing in Human Brain Depicted with Diffusion Tensor MR Imaging. Radiology. 2000;217:897–903.
4. Jelescu IO, Veraart J, Fieremans E, Novikov DS. Degeneracy in model parameter estimation for multi‐compartmental diffusion in neuronal tissue. NMR in Biomedicine. 2016 Jan;29(1):33-47.
5. Novikov DS, Kiselev VG, Jespersen SN. On modeling. Magnetic resonance in medicine. 2018 Jun;79(6):3172-93.
6. Palombo, Marco, et al. "SANDI: a compartment-based model for non-invasive apparent soma and neurite imaging by diffusion MRI." arXiv preprint arXiv:1907.02832 (2019).
7. Westin, Carl-Fredrik, et al. "Q-space trajectory imaging for multidimensional diffusion MRI of the human brain." NeuroImage 135 (2016): 345-362.
8. Reisert M, Kiselev VG, Dhital B. A unique analytical solution of the white matter standard model using linear and planar encodings. Magnetic resonance in medicine. 2019 Jun;81(6):3819-25.
9. Coelho, S., Pozo, J. M., Jespersen, S. N., Jones, D. K., & Frangi, A. F. (2019). Resolving degeneracy in diffusion MRI biophysical model parameter estimation using double diffusion encoding. Magnetic resonance in medicine, 82(1), 395-410.
10. Fieremans E, Veraart J, Ades‐Aron B, Szczepankiewicz F, Nilsson M, Novikov DS. Effects of combining linear with spherical tensor encoding on estimating brain microstructural parameters In Proceedings of the 26th Annual Meeting of ISMRM, Paris, France, 2018:0254.
11. Gyori N. G. et al., In-vivo Neural Soma Imaging Using B-tensor Encoding and Deep Learning, In Proceedings of the 27th Annual Meeting of ISMRM, 2019.
12. Murday, J. S., and Robert M. Cotts. "Self‐diffusion coefficient of liquid lithium." The Journal of Chemical Physics 48.11 (1968): 4938-4945.
13. Topgaard, D. "Multidimensional diffusion MRI." Journal of Magnetic Resonance 275 (2017): 98-113.
14. Sjölund, Jens, et al. "Constrained optimization of gradient waveforms for generalized diffusion encoding." Journal of Magnetic Resonance 261 (2015): 157-168.
15. Stepišnik J. Time-dependent self-diffusion by NMR spin-echo. Phys. B. 1993;183:343–350.
16. Lundell, H., et al. "Multidimensional diffusion MRI with spectrally modulated gradients reveals unprecedented microstructural detail." Scientific Reports 9.1 (2019): 9026.
17. Duval, T., Stikov, N. and Cohen-Adad, J., 2016. Modeling white matter microstructure. Functional neurology, 31(4), p.217.
Figures
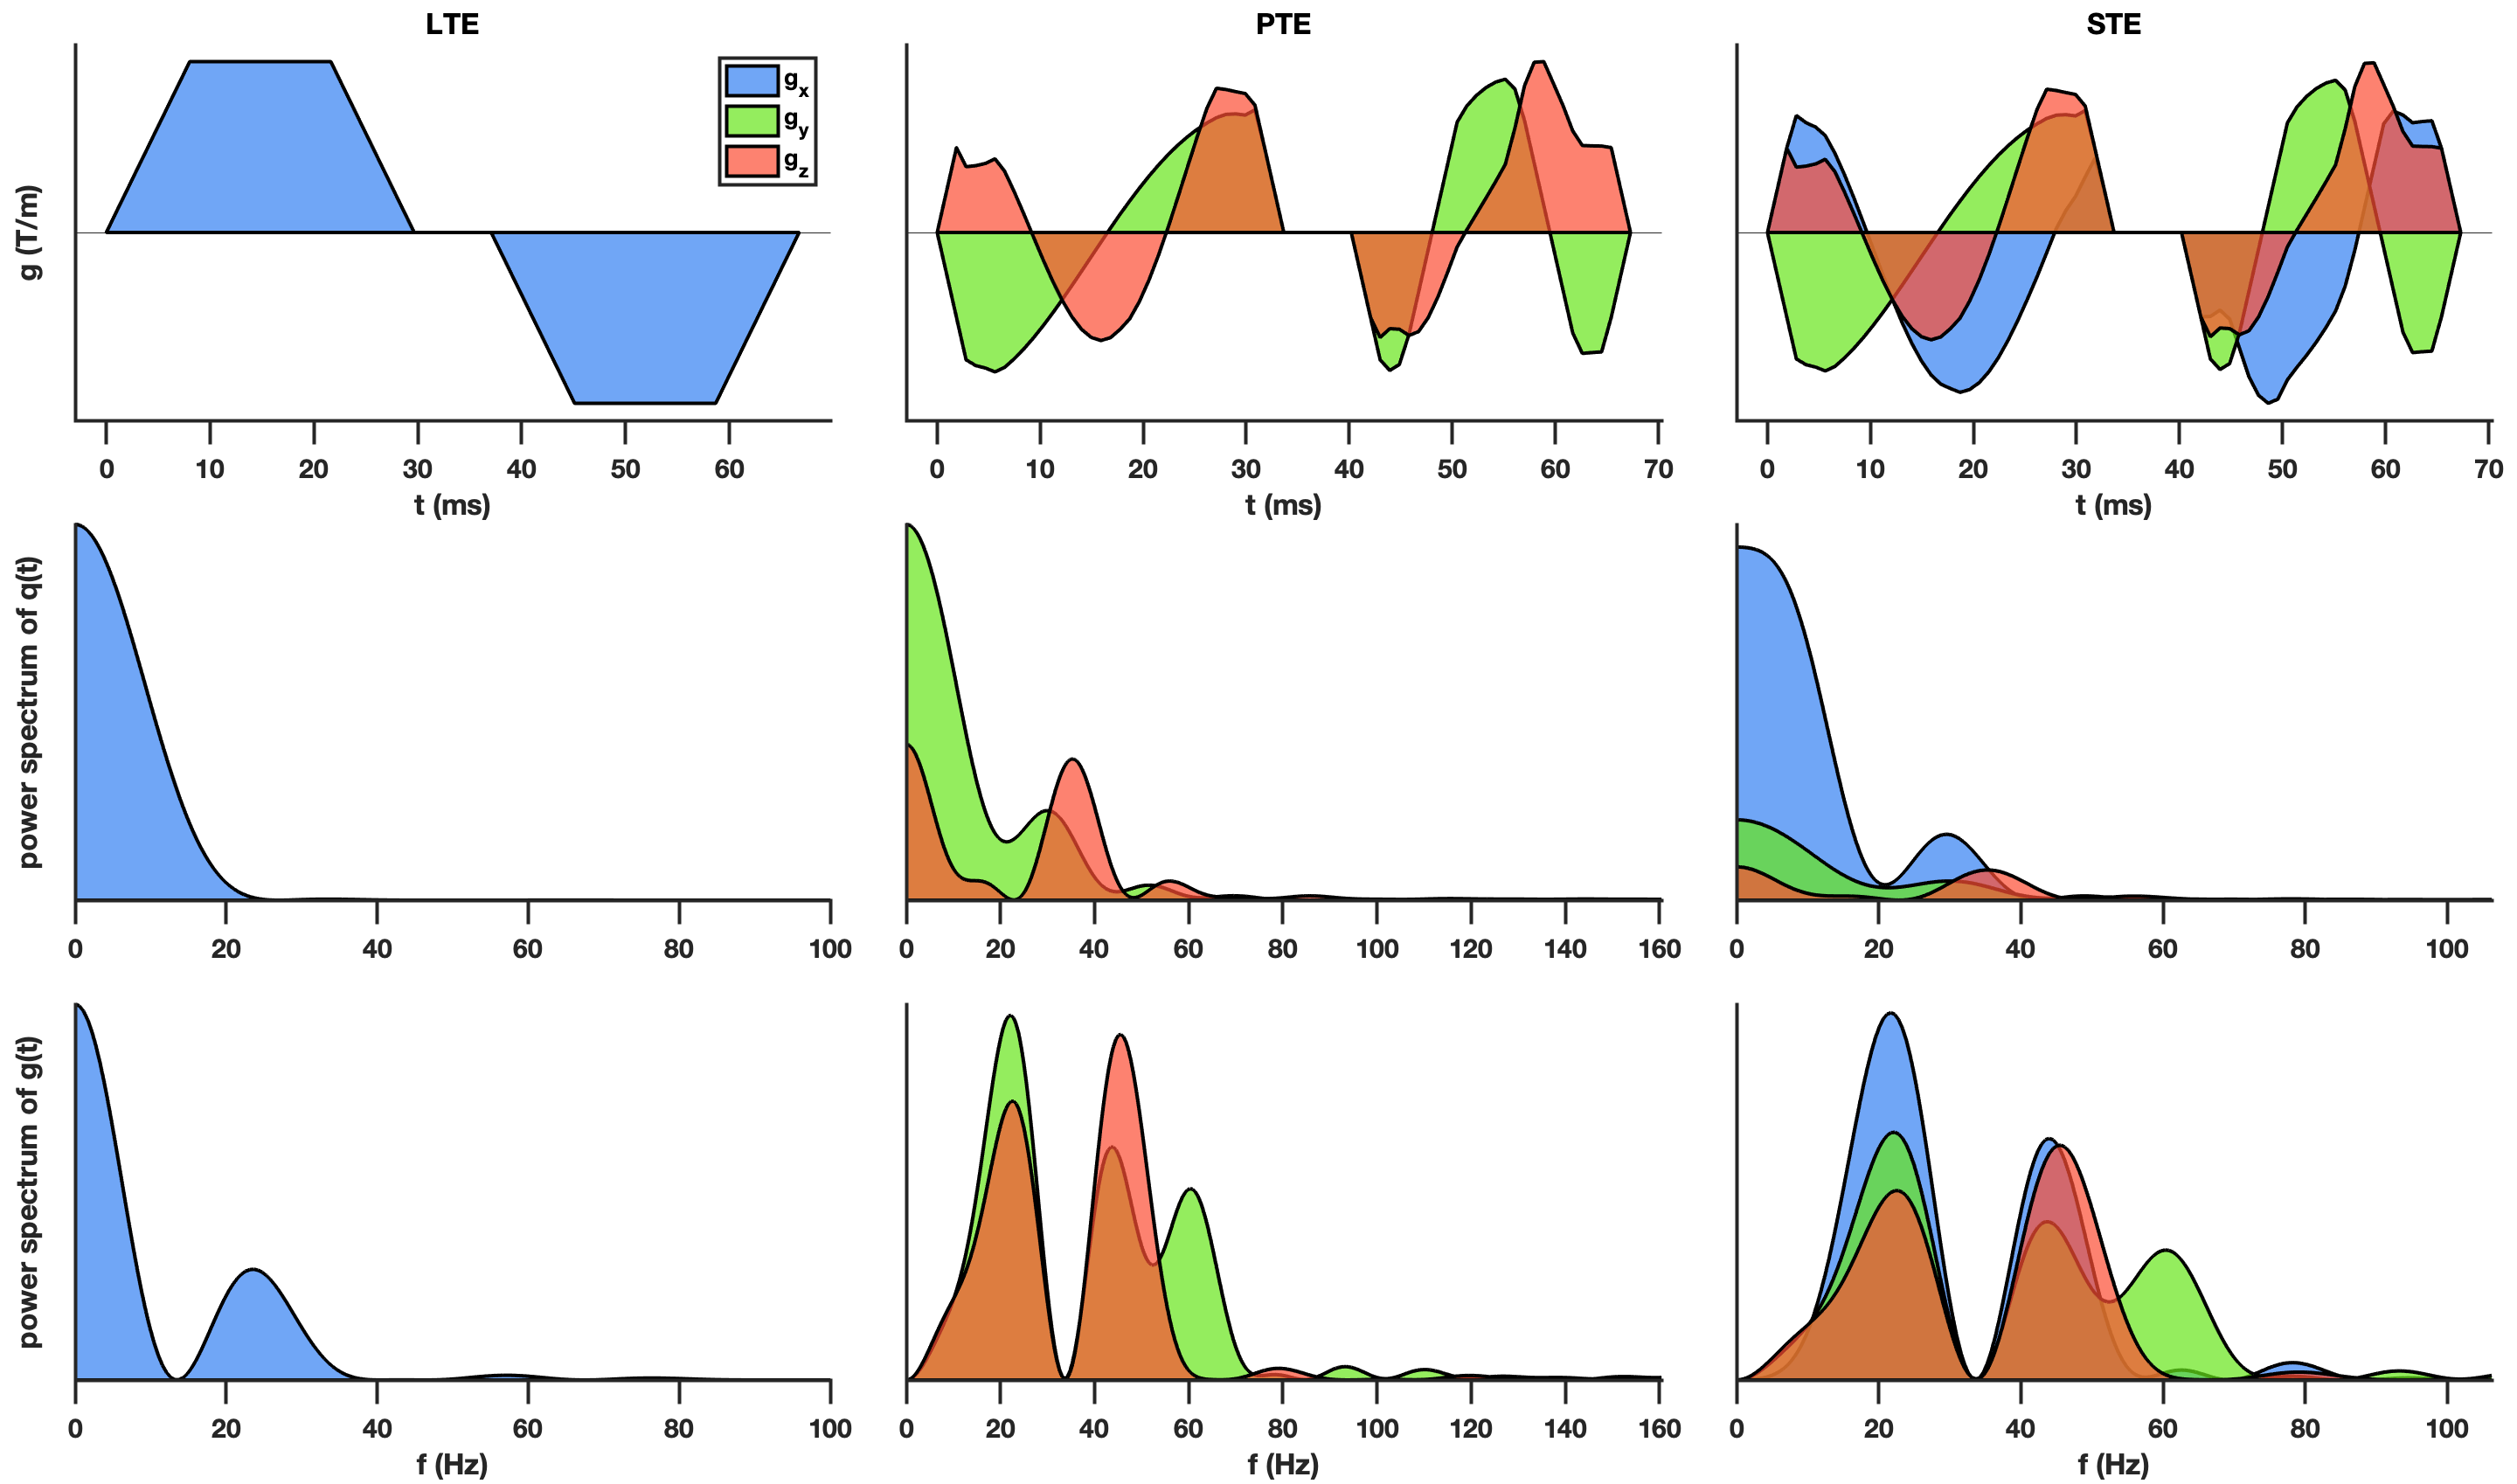


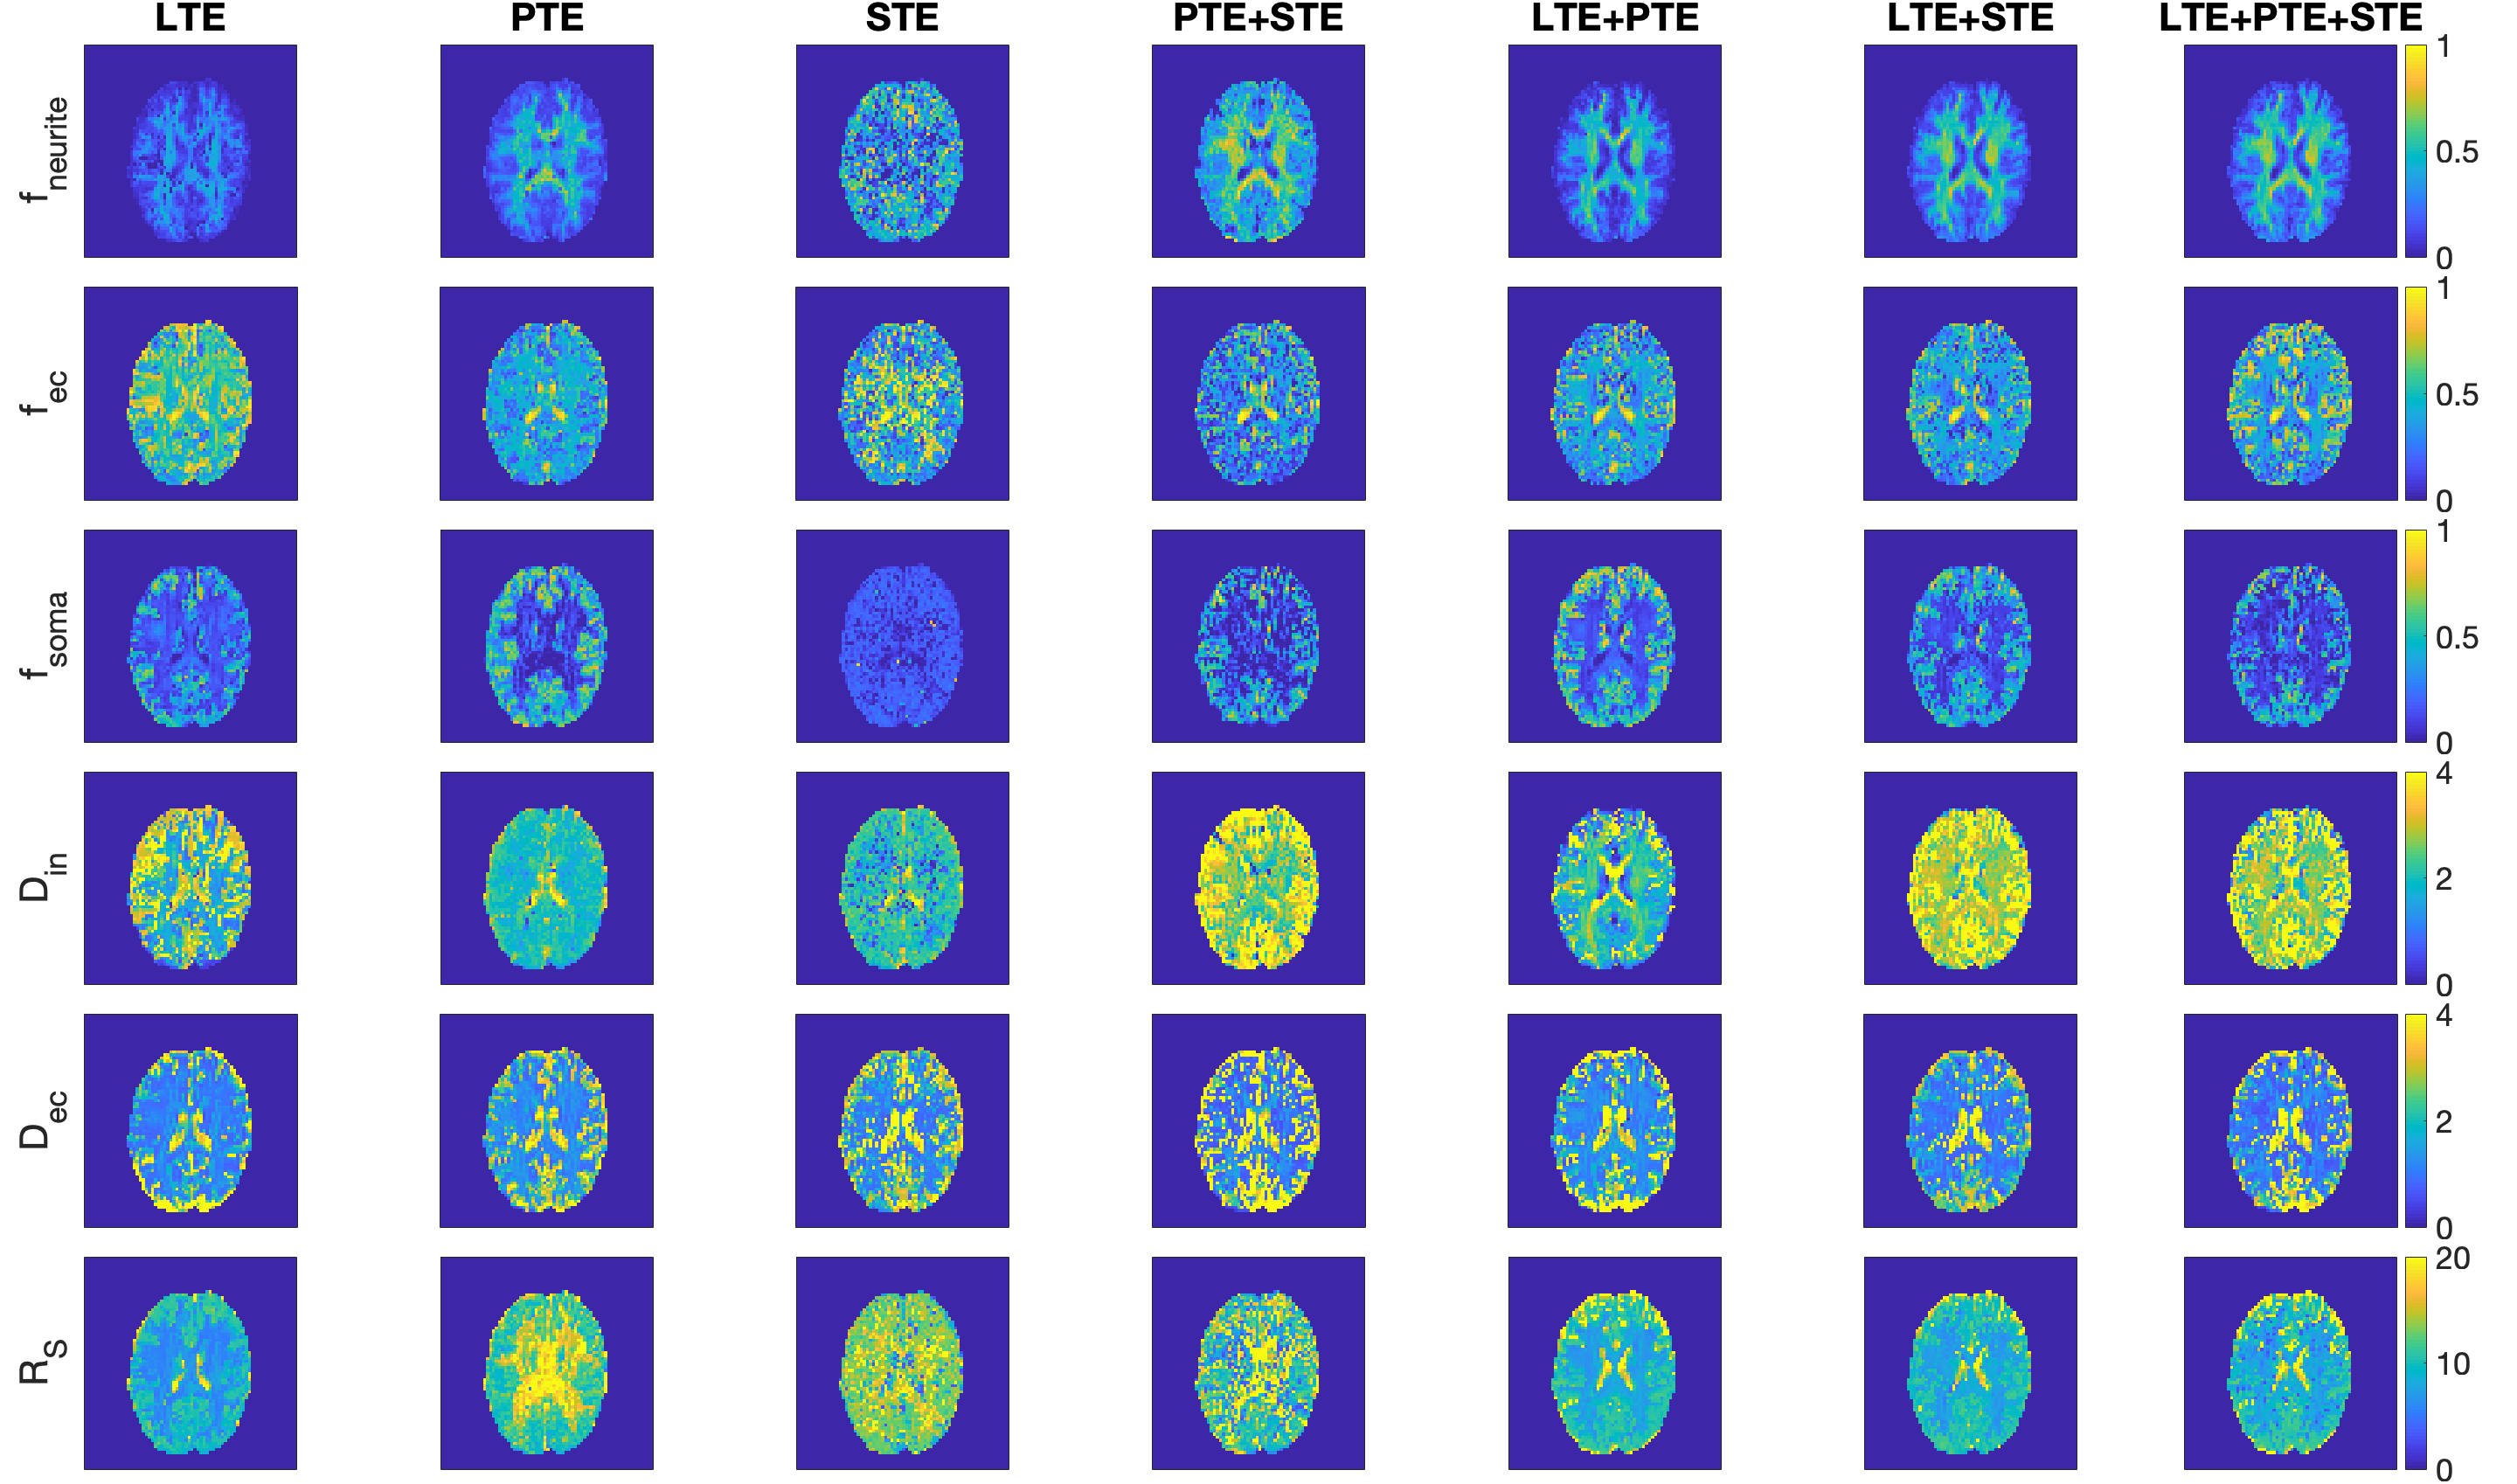
Fig. 4. Estimated parameters of the model for in vivo brain image using different combinations of b-tensor encoding. The estimated apparent sphere radius is around 5 $$$\mu m$$$ in the white matter and 11 in the gray matter which is compatible with typical sizes of oligodendrocytes and neuron soma, respectively. The estimated signal fraction of the spherical compartment is around 0.17 in the WM17 while this value changes to around 0.5 in GM. These values are compatible with the expected soma densities in WM17 (mostly due to oligodendrocytes) and GM (mostly due to neurons and glia).