4425
Skeletal Muscle Diffusion Modeling to Identify Age Related Remodeling of Muscle Microstructure1Physics, UC San Diego, La Jolla, CA, United States, 2Radiology, UC San Diego, La Jolla, CA, United States, 3Physics, San Diego State University, San Diego, CA, United States
Synopsis
Diffusion modelling of the time dependence of the skeletal muscle diffusion eigenvalues derived from DTI allows one to probe tissue microstructure. We applied the Random Permeable Barrier Model to the time dependent diffusion data to identify age related remodeling in skeletal muscle microstructure. Model derived volume fraction (measure of the membrane’s ability to hinder diffusion) decreased with age while diffusion time and residence time in a cell increased with age while other model parameters such as the free diffusion coefficient, the fiber size, and membrane permeability did not.
Introduction:
Diffusion tensor imaging has been established as a viable technique to monitor skeletal muscle architecture and more recently, the Random Permeable Barrier Model (RPBM) approach has been applied successfully to extract tissue microstructure in normal and disease conditions1. Here, we apply the RPBM method to identify microstructural changes with age. We report here the measurements of the time dependence of skeletal muscle diffusion eigenvalues ($$$\lambda_{1}, \lambda_{2}, \lambda_{3}$$$) using a custom-built STEAM-EPI DTI sequence and the reports of the fit of the RPBM model to the time dependent eigenvalues to extract tissue microstructure in young and senior subjects.Methods:
All imaging studies were performed after IRB approval on a GE 3T scanner on seven young (31 ± 8 years) and six senior (75 ± 5 years) subjects. The DTI protocol used a custom-built STEAM-EPI DTI sequence (Figure 1) with a water selective RF pulse for fat suppression. Six non-collinear gradient directions with a nominal b-factor of 400s/mm2 were used to map the direction dependent diffusion at ten values of the mixing time, TM (20 ms to 600 ms). Imaging parameters were TE/TR): 32ms / 4000ms with 2 signal averages. Diffusion data were pre-processed for eddy current mis-registration and denoised by applying joint-Rican LMMSE filter2 prior to computing the diffusion tensor and the diffusion eigenvalues. The corrected full b-matrix that accounted for the diffusion, imaging and spoiler gradients was calculated as outlined in Ref. 3. The RPBM model1 was fitted by fixing the free diffusion coefficient $$$D_{0}$$$ at the long diffusion time limit of the primary eigenvalue ($$$\lambda_{1}$$$) to extract the following parameters: the membrane permeability $$$\kappa$$$, and the membrane surface to volume ratio $$$S/V$$$. The myofiber size is derived from the surface to volume ratio as: $$$4 \cdot V/S$$$ while others such as the volume fraction $$$\zeta$$$, effective thickness $$$l$$$, diffusion time $$$\tau_\textit{D}$$$ and residence time $$$\tau_\textit{D}$$$ are derived from $$$\kappa$$$ and $$$S/V$$$. The RPBM fits were made to the time dependence of the average of $$$\lambda_{2}$$$, and $$$\lambda_{3}$$$ ($$$D_{\perp}$$$); the values of $$$D_{\perp}$$$ were the average over the medial gastrocnemius (MG) muscle segmented from all three slices.Results:
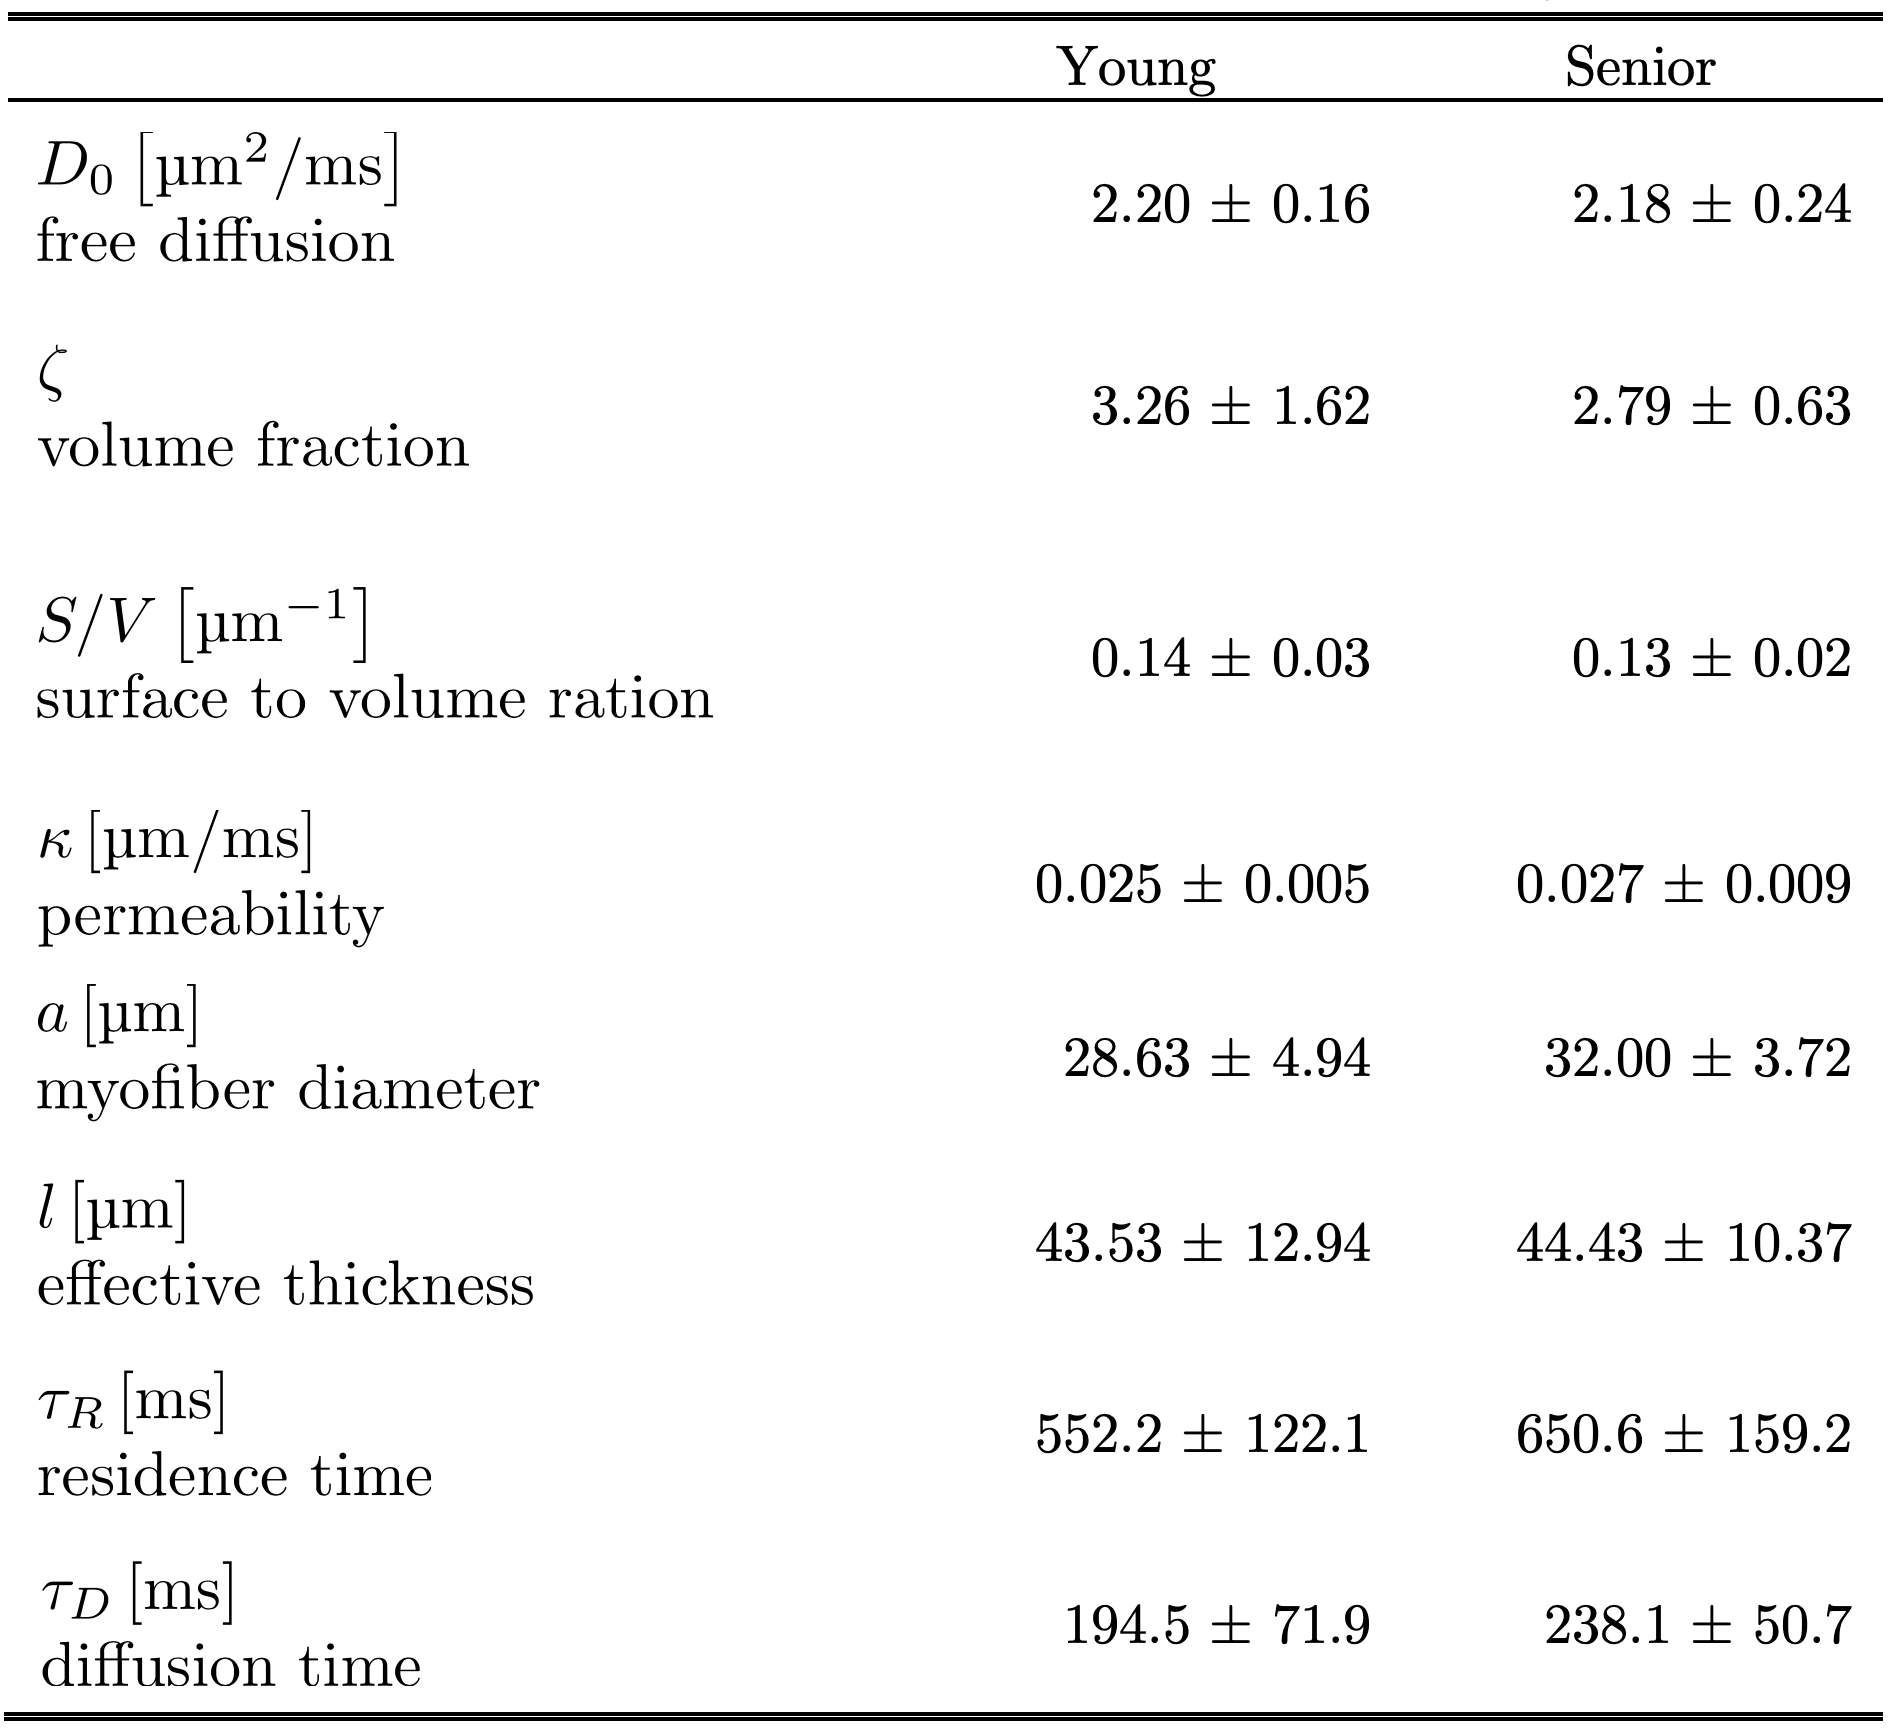
For the nominal b=0 images, the b-value varied from 1.7s/mm2 at TM=20 ms to 22s/mm2 at TM=600ms and for the nominal b=400 s/mm2 images, the b-value varied from 371s/mm2 at TM=20ms to 547s/mm2 at TM=600ms, emphasizing the need for full b-matrix calculation. Excellent fat suppression was seen in all the STEAM DTI data (Figure 2). Figure 2 shows parametric $$$D_{\parallel}$$$ and $$$D_{\perp}$$$ maps for a young and for a senior subject at two TMs. Table 1 summarizes the eigenvalues for the MG in the young and senior cohort at the ten mixing times TM. Larger changes with diffusion time are seen in $$$\lambda_{2}$$$, and $$$\lambda_{3}$$$ (compared to $$$\lambda_{1}$$$). The RPBM fits to the time dependence of $$$D_{\perp}$$$ for a subject from the young cohort and from the senior cohort are shown for the Figure 3. Table 2 is a list of model derived muscle microstructure parameters; volume fraction decreased with age while diffusion time and residence time in a cell increased with age while other model parameters such as the fiber size and membrane permeability increased with age but did not reach significance.Discussion:
The values of the model derived parameters are in general agreement with that reported for the MG in an earlier study1. The RPBM model yields a lower volume fraction for the aging muscle which is a measure of the membrane’s ability to hinder diffusion. It is possible that aging muscle may have compromised sarcolemma integrity that makes it more permeable and thus poses less of a barrier to diffusion. Based on the fact that muscle atrophies with age a decrease in fiber diameter with age is expected. However fiber diameters derived from the RPBM model did not show anticipated changes. A sarcolemma with compromised integrity (as seen here in aging muscle) may potentially affect lateral transmission of force, the latter is mediated by proteins in the sarcolemma.Conclusions:
We have successfully applied the RPBM model to time dependent diffusion data and applied it to study age related skeletal muscle remodeling.Acknowledgements
This work was supported by the National Institute of Arthritis and Musculoskeletal and Skin Diseases Grant R01AG056999-01References
[1] Fieremans E, et al. NMR Biomed. 2016; 30(3).
[2] Tristán-Vega A, et al. Medical Image Analysis. 2010; 14(2):205-218.
[3] Mattiello J, et al. MRM 1997; 37:292-300.
Figures