4424
Single-shell derived tissue signal fraction maps show increased contrast between hippocampal subfields compared to multi-shell analysis.1Department of Radiology & Medical Imaging, Division of Neuroradiology, University of Virginia Health System, University of Virginia, Charlottesville, VA, United States, 2Brain Institute, University of Virginia, Charlottesville, VA, United States, 3The Florey Department of Neuroscience, University of Melbourne, Melbourne, Australia, 4The Florey Institute of Neuroscience and Mental Health, Melbourne, Australia
Synopsis
Recent advances in the analysis of diffusion MRI have allowed for the estimation of 3 tissue compartments in the brain from data with only a single non b=0 shell. There is currently no published quantitative comparison between signal fractions derived from either single- or multi-shell methods. Applying both single-shell analysis and multi-shell analysis to the same dataset shows high b-value single-shell analysis may increase contrast between different hippocampal subfields. While this effect may occur due to differences in microstructure between ROIs it should be a noted factor when applying either model and deserving of further study.
Introduction
Quantitative 3-tissue signal fractions derived from constrained spherical deconvolution (CSD) based analysis of diffusion MRI are a recently developed means to assess tissue microstructure in the brain1-3. By measuring the relative contribution of white matter (WM), grey matter (GM), and CSF-like diffusion signals in each voxel, it is possible to both assess underlying tissue composition and improve WM tractography3,4. 3-tissue CSD was first performed using Multi-Shell, Multi-Tissue CSD (MSMT-CSD)5, which requires a multi-shell diffusion acquisition scheme to successfully tease apart contributions from three tissue compartments1. However, a range of studies, for reasons both historical and clinical do not collect multi-shell diffusion data, and instead only acquire single-shell data. To obtain the full benefits of 3-tissue CSD from single-shell data, an iterative CSD approach termed Single-Shell 3-Tissue CSD (SS3T-CSD)1 was proposed. Both MSMT-CSD and SS3T-CSD deconvolve 3 tissue response functions from the data, and both calculate a WM fiber orientation distribution (FOD) for use in either tractography or as part of 3-tissue signal fractions. To date though there has not been a comprehensive investigation into differences between the signal fractions obtained from either method. Because diffusion MRI data suitable for MSMT-CSD is also able to be analyzed by SS3T-CSD, it is possible to compare outputs of both methods from the same dataset (if it is multi-shell). In this work, we evaluate the ability of 3-tissue signal fractions from MSMT-CSD and SS3T-CSD in 7 hippocampal subregions to generate contrast between anatomically distinct brain areas.Methods
MRI images were collected as part of a separate study2 at the University of Virginia. 118 total diffusion images from healthy controls were acquired using a Siemens Prisma 3T scanner with an isotropic voxel size of 1.7⨉1.7⨉1.7mm3, TE=70ms and TR=2900ms; using a multi-shell protocol, 10 b=0 images and 64 gradient directions at both b=1500s/mm2 and b=3000s/mm2 were acquired. This multi-shell dataset was split into two single-shell subsets by retaining the b=0 images and extracting all diffusion images at either b=1500s/mm2 or b=3000s/mm2.The multi-shell dataset was analyzed using MSMT-CSD5 implemented in the open source software MRtrix6 and the two single-shell datasets were analyzed using (SS3T-CSD)1 as available in MRtrix3Tissue (https://3tissue.github.io/), a fork of MRtrix3. Several preprocessing steps utilized FSL7. Diffusion images were denoised8, corrected for Gibbs ringing9, susceptibility distortions10, motion11, and eddy currents12. Average response functions were generated for white matter (WM), grey matter (GM), and CSF from the images in each of the 3 image sets13 and the fiber orientation distribution (FOD) calculated for each voxel1,5. 3-tissue signal fractions were calculated from the FODs3.
In order to compare images across all datasets and subjects, a group average population template was constructed by non-linear, affine transformation and reorientation of the WM FODs generated by MSMT-CSD. The identical warps that transformed the subject images from native space to template space were then applied to each signal fraction map output from MSMT-CSD and SS3T-CSD, ensuring that each voxel moved identically with its partner from each analysis group. A diffusion template generated to match MNI space14 was then registered to the population template and cytoarchitectonic maps of 7 hippocampal subdivisions15 (CA1, CA2, CA3, Dentate Gyrus, Entorhinal Cortex, and the Hippocampal-Amygdala Transition Area; all thresholded at 50% probability) were applied to calculate average signal fractions for each ROI.
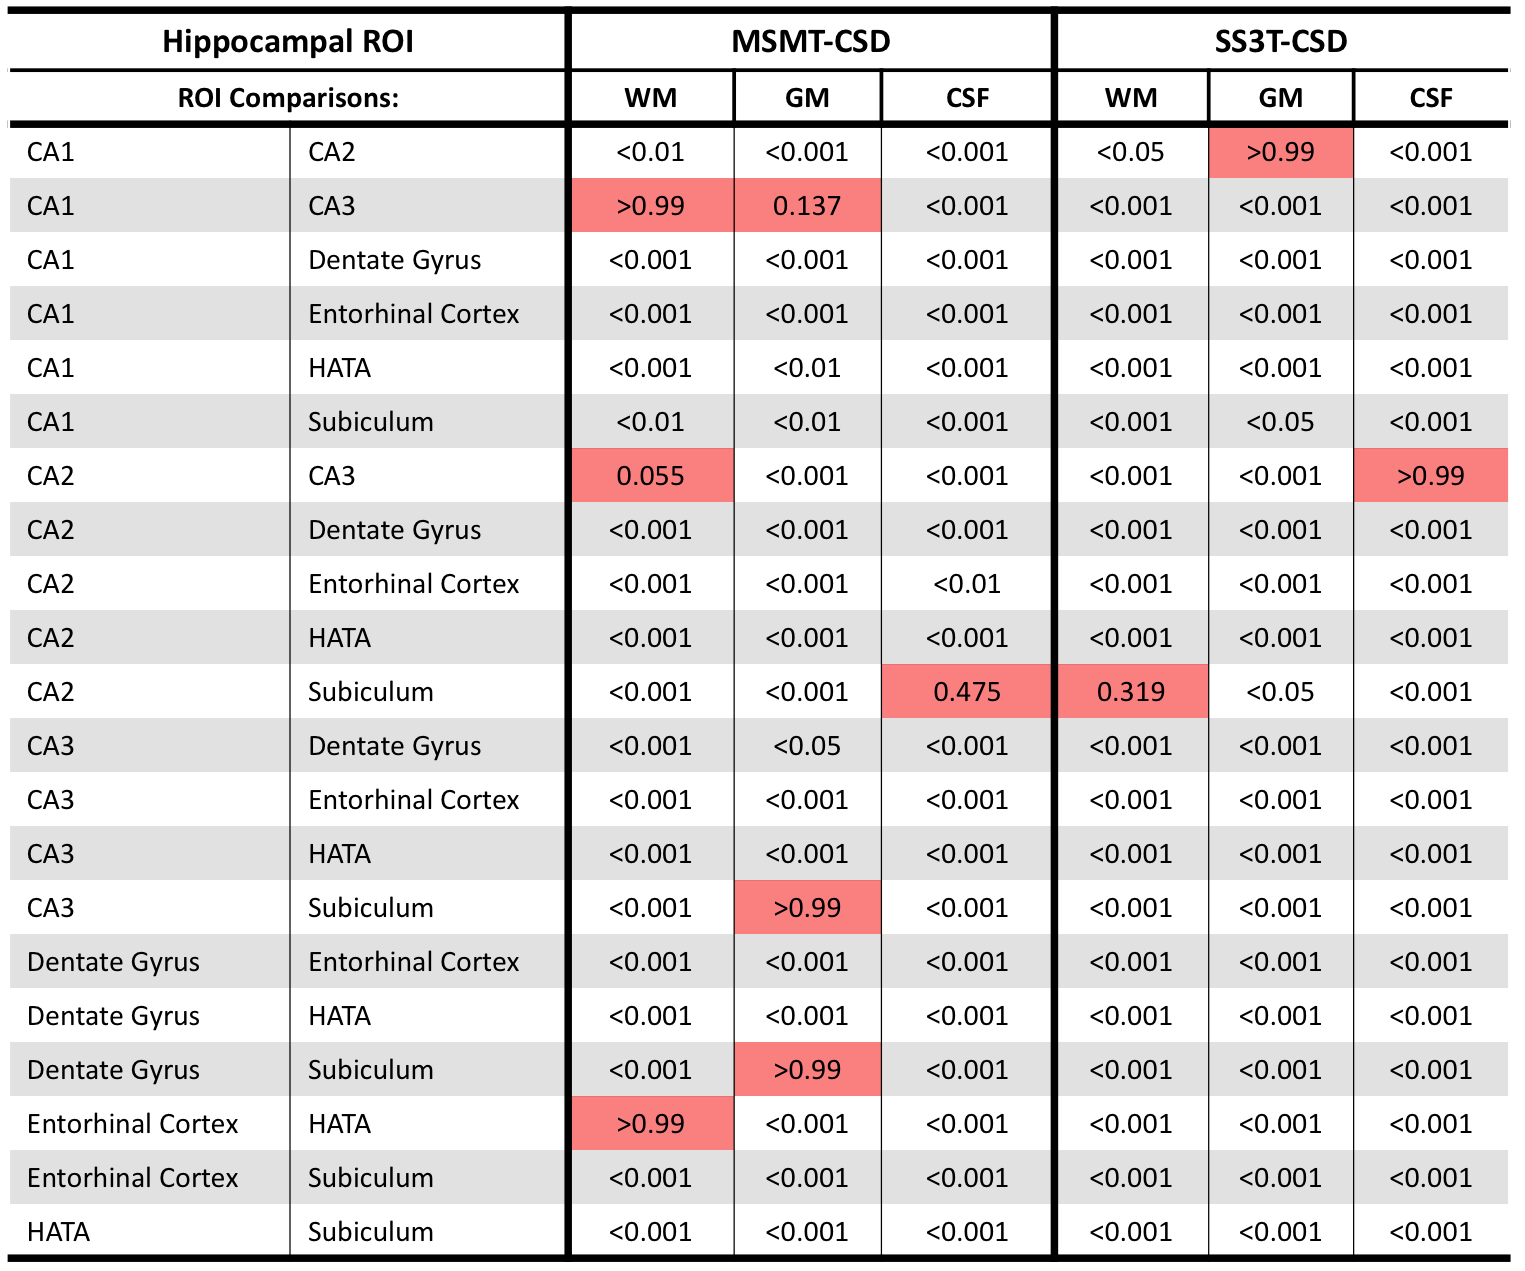
Given that the higher b-value shell would be more likely be utilized in analysis, Kolmogorov–Smirnov tests with Bonferroni corrections were performed between MSMT-CSD and SS3T-CSD at b=3000s/mm2 results from each hippocampal area from each tissue compartment. This calculation examined the discriminability between areas, if the signal fractions were sufficiently different to be drawn from a separate distribution it would indicate that the signal fraction analysis method would have sufficient contrast to discriminate between hippocampal subfields.
Results
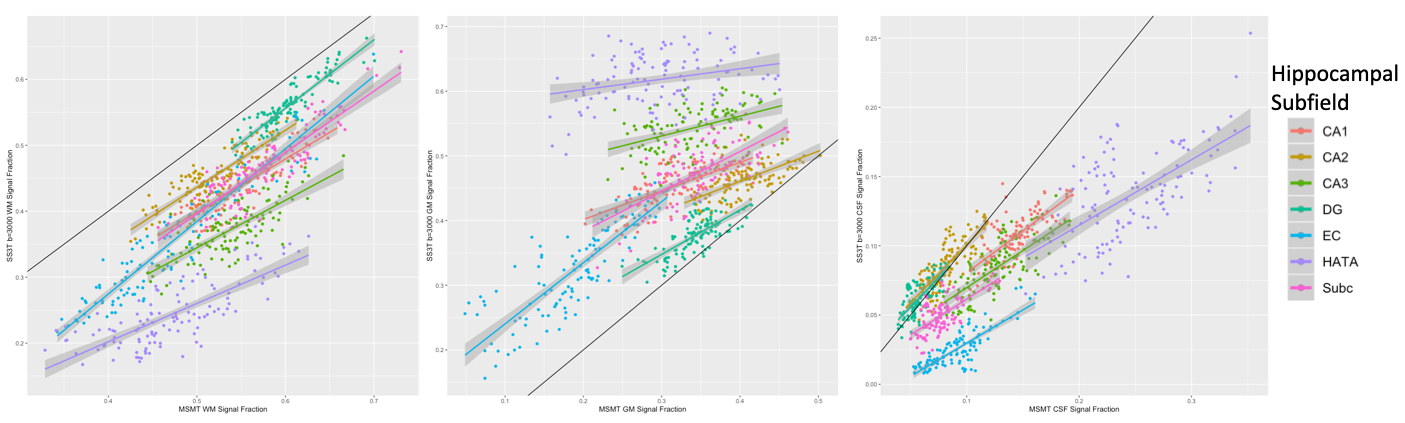
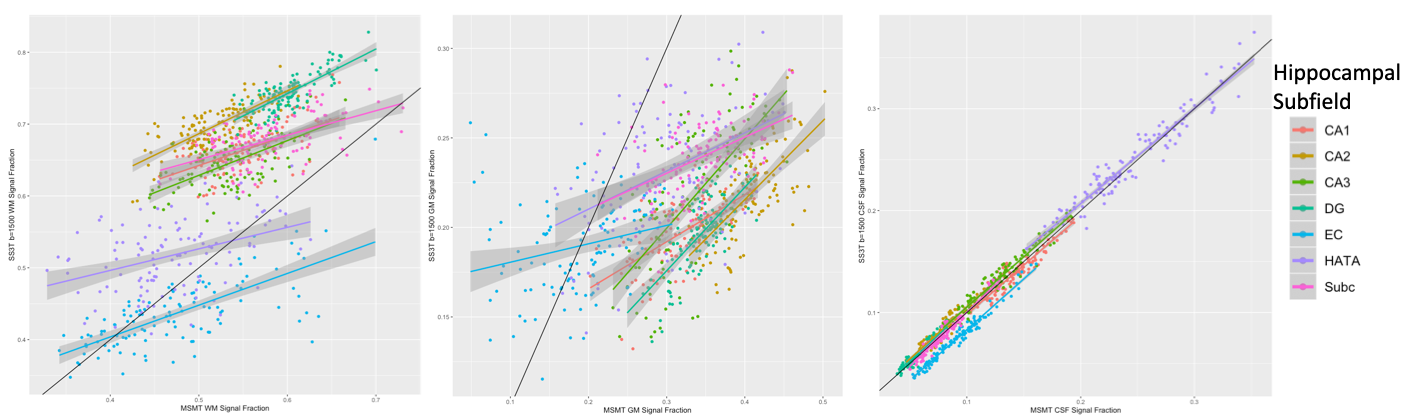
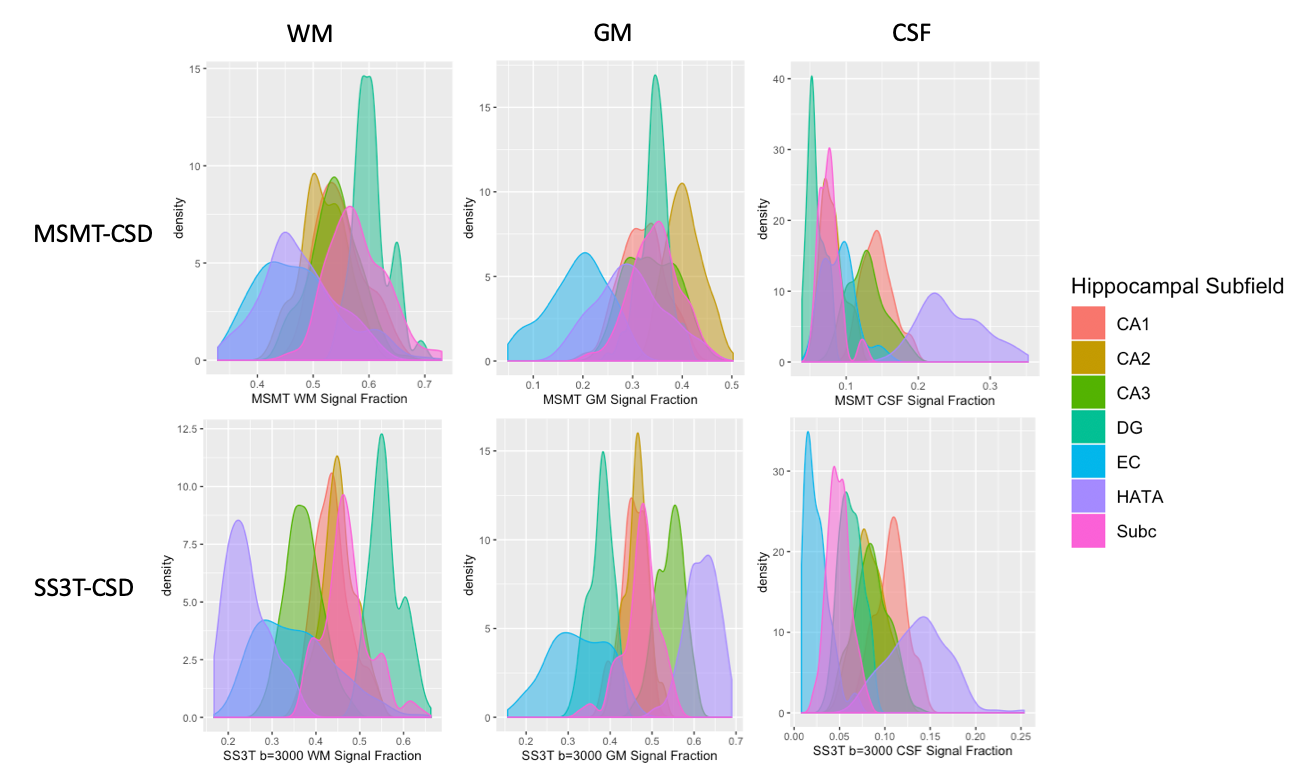
There was a significant difference between each of the measured signal fractions across all subregions of the hippocampus depending on method (Figure 1 & 2), with the exception of the CSF signal fraction derived from MSMT-CSD and SS3T-CSD at b=1500s/mm2 (T-test; p = 0.794). In each of the signal fractions calculated from the diffusion MRI data (Figure 3), SS3T-CSD at b=3000s/mm2 was able to successfully discriminate an individual distribution from 5 of the 7 hippocampal subareas examined. MSMT-CSD in contrast, was not able to discriminate an individual distribution from any of the WM-like signal fraction areas; 3 of the 7 GM-like subareas; and 5 of the 7 CSF-like signal fraction areas (Figure 4).Conclusion
We found that SS3T-CSD reveals greater contrast between hippocampal subareas compared to MSMT-CSD, by relying on high b-value single-shell data.Acknowledgements
No acknowledgement found.References
1. Dhollander, T., & Connelly, A. (2016). A novel iterative approach to reap the benefits of multi-tissue CSD from just single-shell (+ b=0) diffusion MRI data. In Proc ISMRM (Vol. 24, p. 3010).
2. Newman, B. T., Dhollander, T., Reynier, K. A., Panzer, M. B., & Druzgal, T. J. (2019). Test-retest reliability and long-term stability of 3-tissue constrained spherical deconvolution methods for analyzing diffusion MRI data. bioRxiv, 764506.
3. Mito, R., Dhollander, T., Raffelt, D., Xia, Y., Salvado, O., Brodtmann, A., ... & Connelly, A. (2018). Investigating microstructural heterogeneity of white matter hyperintensities in Alzheimer’s disease using single-shell 3-tissue constrained spherical deconvolution. In Proceedings of the 26th annual meeting of the International Society of Magnetic Resonance in Medicine (p. 135).
4. Aerts, H., Dhollander, T., & Marinazzo, D. (2019). Evaluating the performance of 3-tissue constrained spherical deconvolution pipelines for within-tumor tractography. bioRxiv, 629873.
5. Jeurissen, B., Tournier, J. D., Dhollander, T., Connelly, A., & Sijbers, J. (2014). Multi-tissue constrained spherical deconvolution for improved analysis of multi-shell diffusion MRI data. NeuroImage, 103, 411-426.
6. Tournier, J. D., Smith, R., Raffelt, D., Tabbara, R., Dhollander, T., Pietsch, M., ... & Connelly, A. (2019). MRtrix3: A fast, flexible and open software framework for medical image processing and visualisation. NeuroImage, 116137.
7. Jenkinson, M., Beckmann, C. F., Behrens, T. E. J., Woolrich, M. W., & Smith, S. M. (2012). FSL. NeuroImage, 62(2), 782-790.
8. Veraart, J., Fieremans, E., & Novikov, D. S. (2016). Diffusion MRI noise mapping using random matrix theory. Magnetic resonance in medicine, 76(5),1582-1593.
9. Kellner, E., Dhital, B., Kiselev, V. G., & Reisert, M. (2016). Gibbs‐ringing artifact removal based on local subvoxel‐shifts. Magnetic resonance in medicine, 76(5), 1574-1581.
10. Smith, S. M., Jenkinson, M., Woolrich, M. W., Beckmann, C. F., Behrens, T. E., Johansen-Berg, H., ... & Niazy, R. K. (2004). Advances in functional and structural MR image analysis and implementation as FSL. NeuroImage, 23, S208-S219.
11. Andersson, J. L., Graham, M. S., Zsoldos, E., & Sotiropoulos, S. N. (2016). Incorporating outlier detection and replacement into a non-parametric framework for movement and distortion correction of diffusion MR images. NeuroImage, 141, 556-572.
12. Andersson, J. L., & Sotiropoulos, S. N. (2016). An integrated approach to correction for off-resonance effects and subject movement in diffusion MR imaging. NeuroImage, 125, 1063-1078
13. Dhollander, T., Raffelt, D., & Connelly, A. (2016). Unsupervised 3-tissue response function estimation from single-shell or multi-shell diffusion MR data without a co-registered T1 image. In ISMRM Workshop on Breaking the Barriers of Diffusion MRI(Vol. 5).
14. Hsu, Y. C., Lo, Y. C., Chen, Y. J., Wedeen, V. J., & Isaac Tseng, W. Y. (2015). NTU‐DSI‐122: A diffusion spectrum imaging template with high anatomical matching to the ICBM‐152 space. Human brain mapping, 36(9), 3528-3541.
15. Amunts, K., Kedo, O., Kindler, M., Pieperhoff, P., Mohlberg, H., Shah, N. J., ... & Zilles, K. (2005). Cytoarchitectonic mapping of the human amygdala, hippocampal region and entorhinal cortex: intersubject variability and probability maps. Anatomy and embryology, 210(5-6), 343-352.
Figures