4423
Optimisation of Temporal Diffusion Ratio (TDR) to maximise its potential to map large axons: Insight from simulations1CMIC, Computer Science Department, University College London, London, United Kingdom, 2NatBrainLab, King's College London, London, United Kingdom
Synopsis
Temporal Diffusion Ratio (TDR) is a novel technique introduced by Dell’Acqua et al. at ISMRM 2019, with potential for mapping areas with large diameter axons in the human brain. We aim to maximise TDR signal in practical applications by optimizing the sequence parameters used. Working in simulation, it is found that the highest TDR signal for a given axon diameter is produced by contrasting signal from sequences with as disparate as possible shapes: a tall/narrow gradient shape should be contrasted with a short/wide gradient to produce the best contrast.
Introduction
This work aims to identify the optimal sequences maximizing Temporal Diffusion Ratio (TDR) in practical applications. TDR is a novel contrast proposed at ISMRM 20191 by Dell’Acqua et al to map areas of the brain with large axons. This could be of high clinical importance since existing axon diameter techniques such as AxCaliber2 or ActiveAx3 are of limited clinical value, as the signal does not have sufficient sensitivity for accurate diameter estimations4-6. TDR does not aim to estimate axon diameter accurately, but maps the areas where diameter is larger than the resolution limit, hence not requiring such high sensitivity and yet providing a meaningful measure. Here we focus on maximising the potential of the TDR approach by optimising the pulse sequences used to generate the contrast. We investigate the effect of all pulse sequence parameters, finding the optimal combinations that provide maximum sensitivity and hence the maximum TDR ratio.Methods
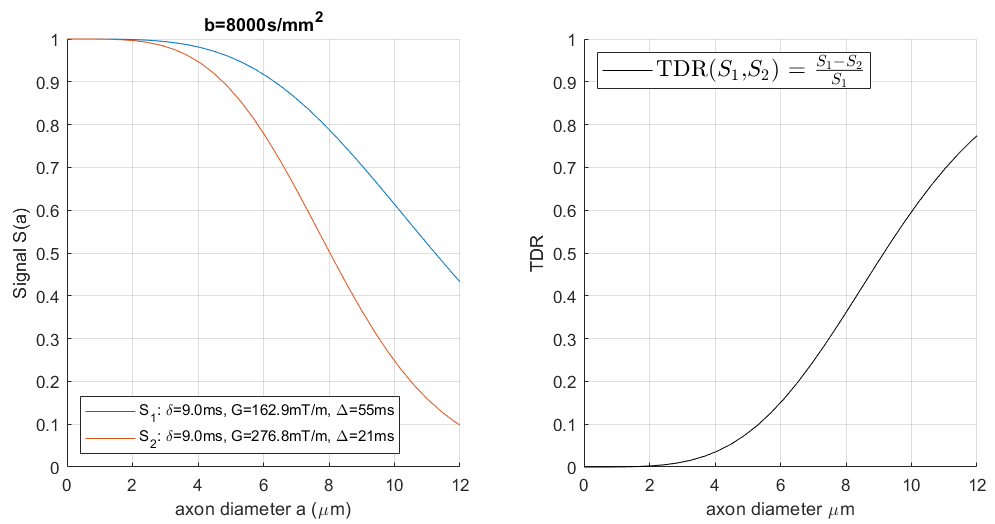
TDR contrast is evaluated by contrasting diffusion-MRI signals collected under two different sets of diffusion parameters as described in Dell’Acqua1 (Figure[1]). Dell’Acqua’s approach uses multi-directional HARDI-signals, normalised to corresponding non-diffusion weighted signals and spherical-averaged. TDR is calculated for each voxel and assumes a distribution of axons. However, for ease of interpretation we calculate TDR assuming one gradient direction (perpendicular to the fibre), and voxels with single axon diameter. Simulations on a two-compartment white matter model (with non-permeable, parallel infinite cylinders) are used to investigate a space of clinically plausible PGSE sequence parameters. We use b-values larger than 7000s/mm2 so that the extra-axonal space is fully nulled7,8. We explore sequence parameters: δ=[0-60ms]; G= [0-300mT/m] and Δ=[10-60ms]. We set diffusion coefficient D=1.7×10⁹m2/s, axon diameter a=[0-12μm] and T2=70ms to match standard values in the white matter at 3T. The simulations are done using open source software MISST9-11, available at ”http://www.nitrc.org/projects/misst''.Results
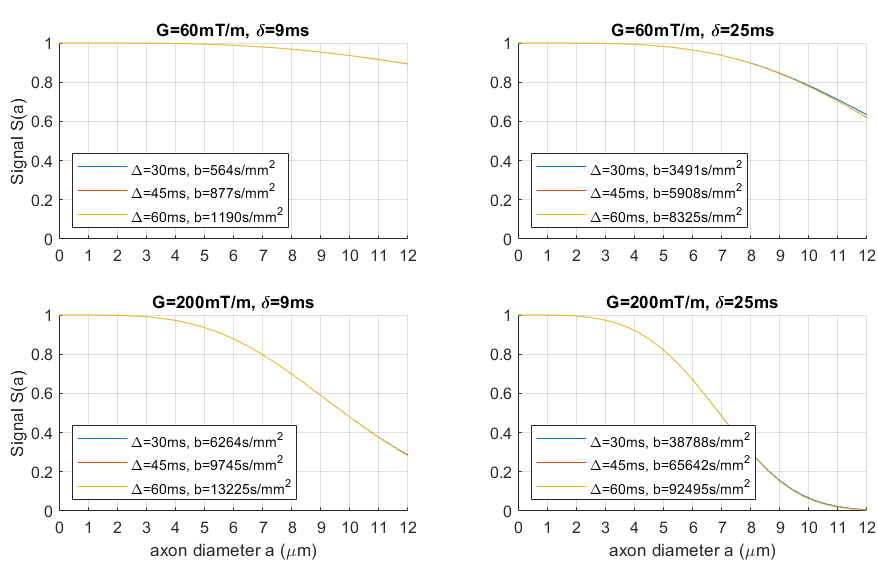
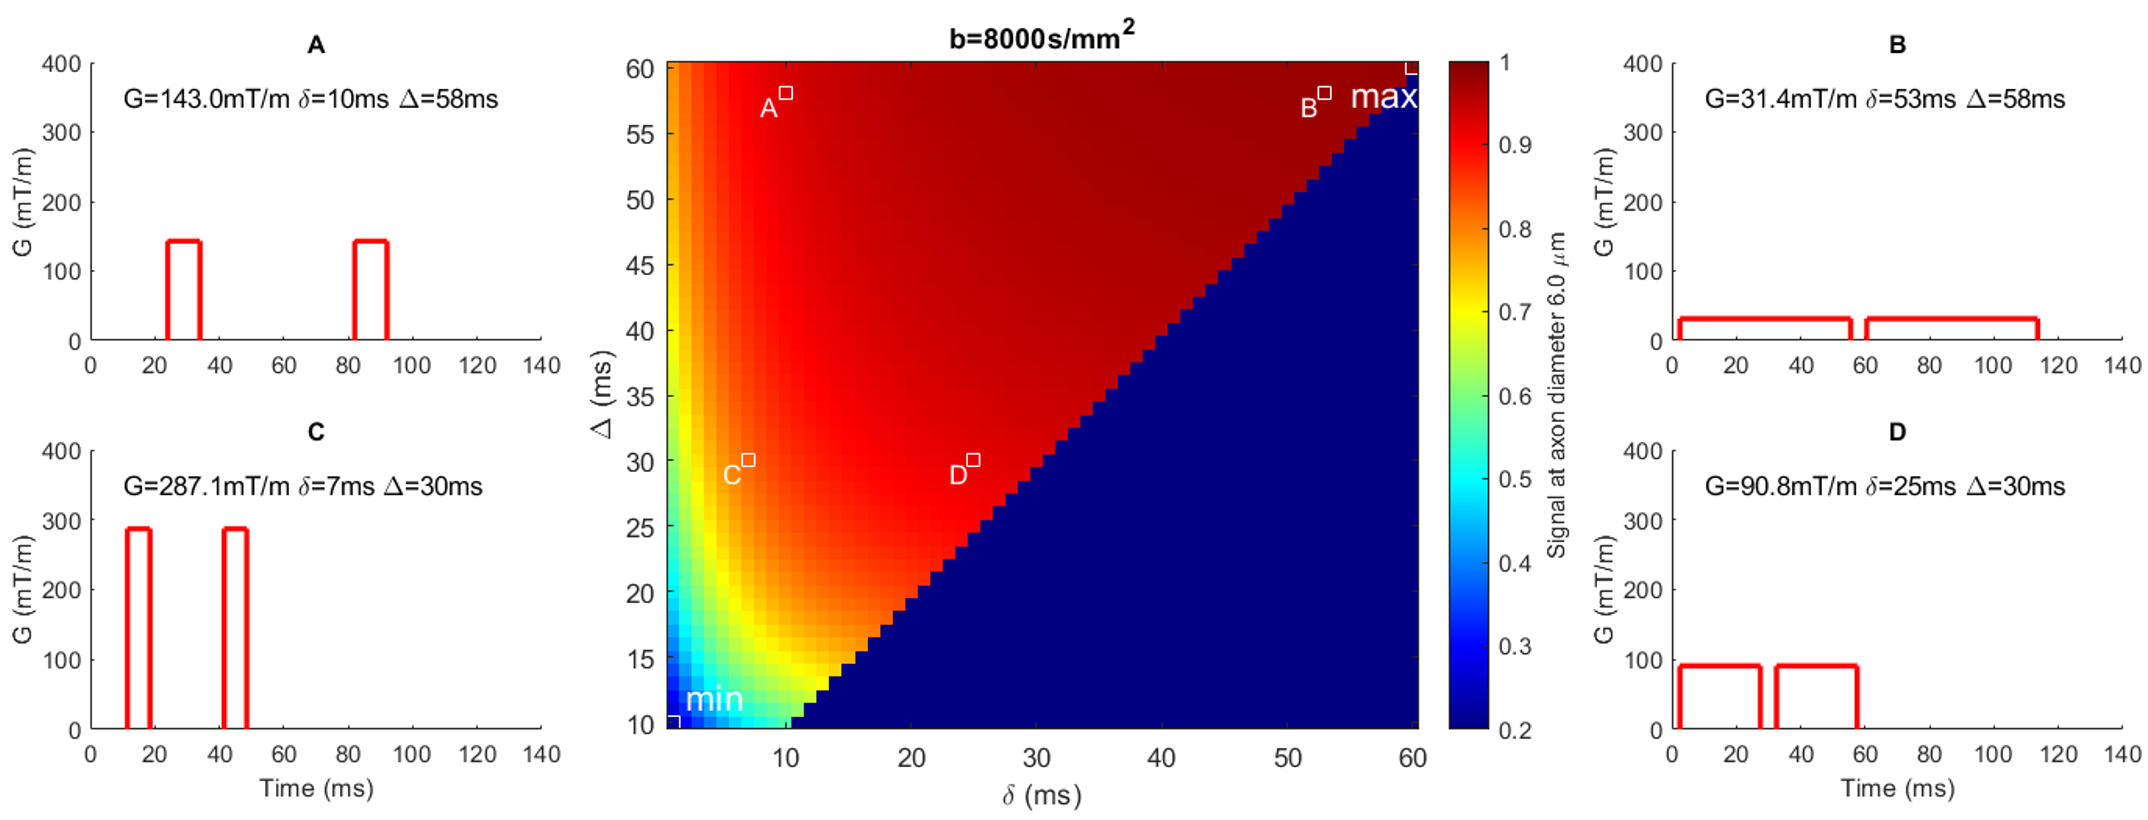
Experiment 1 shows (Figure[2]) that the axon diameter sensitivity is not affected by variation in Δ and b-value but is only dependent on the shape of the gradient waveform, i.e. parameters δ and G.Experiment 2 determines which combination of gradient shapes is optimal for producing a TDR at a fixed b-value (i.e. which combination maximises signal difference, and hence has the highest sensitivity to a single axonal diameter). Figure[3] shows it is the combination of the tallest/narrowest and the shortest/longest possible gradient shapes for a given b-value. This can be seen by the position of the maximum and minimum signal values which are situated in the bottom-left and the top-right corners.
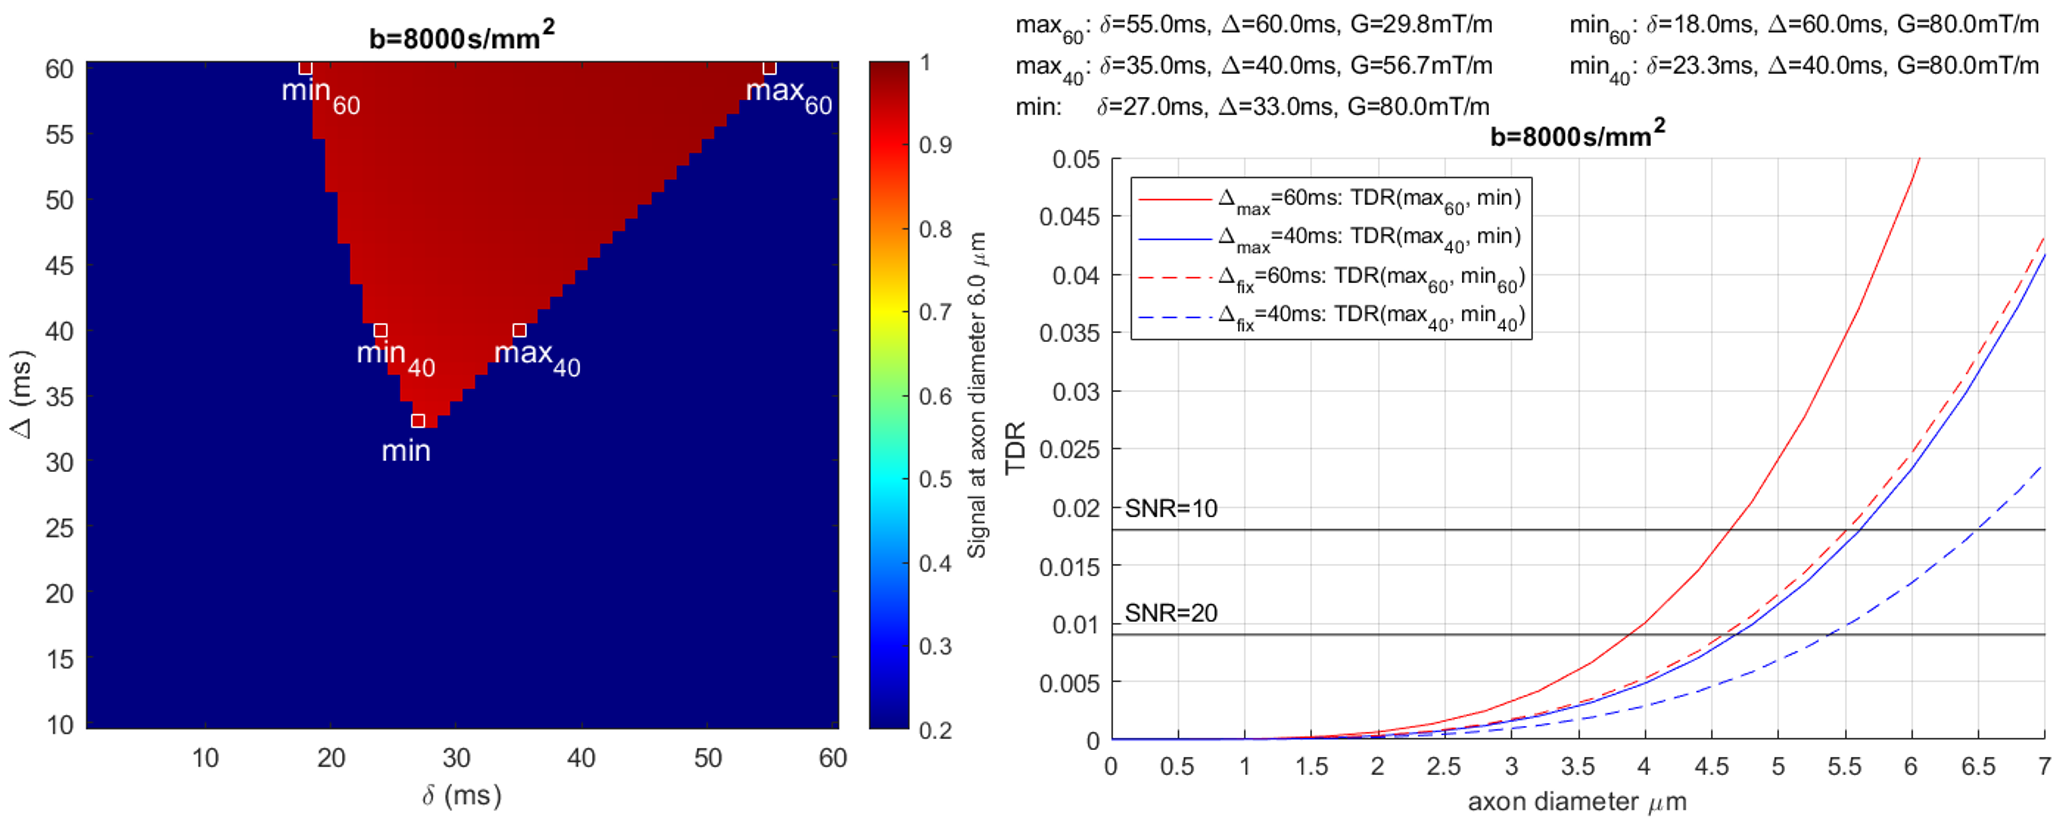
Experiment 3 determines optimal sequence values that maximise the signal difference for Gmax=[80mT/m, 300mT/m] and a range of fixed b-values (only b=8000s/mm2 shown). TDR curves are shown for various optimal sequence parameter combinations (Δfix cases minimise effect of exchange and curvature on TDR). Figure[4a] shows that the best result (i.e. the highest TDR) is for Δmax=60ms, followed by Δmax=30ms and Dell’Acqua-ISMRM2019. Δfix cases fare the worst. Figure[4b] shows similar results for Gmax=80mT/m. Horizontal lines in the figure indicate where SNR=10 and SNR=20 (calculated for TEmax=120ms). Since TDR index here is calculated for a single diameter, the crossing of TDR and SNR curves are just suggestive of sensitivity TDR could at best have to single axon diameters; in practice a voxel is likely to contain a distribution of diameters all contributing to the signal.
Discussion
Axon diameter sensitivity of diffusion-MRI signal has previously been shown not to be affected by changes in Δ,5 a finding confirmed here (Figure[2]). Nevertheless, the choice of Delta is still important in order to achieve the optimal combination of tallest/narrowest and the shortest/longest gradient shapes at a fixed b-value. For an optimal choice of parameters, TDR resolution limit closely matches the axon diameter resolution limit reported previously4,5, suggesting that for 300mT/m and a typical SNR of 10, TDR cannot map the areas with axon diameter below 3μm.It is possible that a certain amount of contamination of TDR would occur because of exchange, undulation, dispersion and curvature of the axons12,13. Since typical exchange times are around 100ms, this can be mitigated by using Δ and δ that are comparatively small, i.e. below 30ms. Hence, TDR in Figure[4a] for Δmax=30ms could be considered “purer“ axon diameter contrast. Another potential solution is fixing Δ, which as seen in Figure[4] provides sensible solutions, however with lower contrast. Further simulations modelling dispersion and curvature are needed to evaluate the size of these effects and determine the fully optimal solution. Future work will also include optimisation for axon diameter distributions and HARDI acquisitions.
Conclusions
TDR is a new imaging contrast with potentially important clinical and neuroscience applications. This work maximises TDR contrast across clinically plausible diffusion MRI sequence parameters. It finds that the optimal combination that maximises the distance between the two signal curves (and hence TDR) is a tallest/narrowest gradient shape versus the lowest/longest gradient shape combined with any Δ that accommodates that. Δ should be lower than 30ms or fixed between the two sequences to minimise dispersion and curvature effect. These optimal solutions can easily be tailored to different scanners and provide numerical guidelines for the optimal use of TDR.Acknowledgements
This project has received funding from Engineering and Physical Sciences Research Council (EPSRC EP/N018702/1, and an EPSRC studentship for William Warner), and has been supported by the NIHR UCLH Biomedical Research Centre.
References
1. Dell’Acqua, F., Dallyn, R., Chiappiniello, A., Beyh, A., Tax, C., Jones, D.K. and Catani, M. (2019) Temporal Diffusion Ratio (TDR): A Diffusion MRI technique to map the fraction and spatial distribution of large axons in the living human brain. Presented at ISMRM 2019
2. Assaf, Y., Blumenfeld-Katzir, T., Yovel, Y. and Basser, P.J. (2008) AxCaliber: A Method for Measuring Axon Diameter Distribution from Diffusion MRI. Magnetic Resonance in Medicine 2008;59:1347-1354
3. Alexander, D.C., Hubbard, P.L., Hall, M.G., Moore, E.A., Ptito, M., Parker, G.J.M. and Dyrby, T.D. (2010) Orientationally invariant indices of axon diameter and density from diffusion MRI. NeuroImage Oct 2010;52(4):1374-1389
4. Nilsson, M., Lasič, S., Drobnjak, I., Topgaard, D. and Westin, C.F. (2017) Resolution limit of cylinder diameter estimation by diffusion MRI: The impact of gradient waveform and orientation dispersion. NMR Biomed. March 2017;30(7):e3711
5. Drobnjak, I., Zhang, H., Ianus, A., Kaden, E. and Alexander, D.C. (2016) PGSE, OGSE, and Sensitivity to Axon Diameter in Diffusion MRI: Insight from a Simulation Study. Magnetic Resonance in Medicine Feb 2016;75(2):688–700
6. Huang, S.Y., Nummenmaa, A., Witzel, T., Duval, T., Cohen-Adad, J., Wald, L.L. and McNab, J.A. (2015) The impact of gradient strength on in vivo diffusion MRI estimates of axon diameter. NeuroImage February 2015;106: 464-472
7. Veraart, J., Fieremans, E. and Novikov, D.S. (2019) On the scaling behavior of water diffusion in human brain white matter. NeuroImage Jan 2019;185:379-387
8. Kroenke, C.D., Ackerman, J.J. and Yablonskiy, D.A. (2004) On the nature of the NAA diffusion attenuated MR signal in the central nervous system. Magnetic Resonance in Medicine Nov 2004;52(5):1052–1059
9. Drobnjak, I., Siow, B. and Alexander, D.C. (2010) Optimizing gradient waveforms for microstructure sensitivity in diffusion-weighted MR. Journal of Magnetic Resonance Sept 2010;206(1):41-515
10. Drobnjak, I., Zhang, H., Hall, M.G. and Alexander, D.C. (2011) The matrix formalism for generalised gradients with time-varying orientation in diffusion NMR. Journal of Magnetic Resonance May 2011;210(1):151-1576
11. Ianus, A., Siow, B., Drobnjak, I., Zhang, H. and Alexander, D.C. (2013) Gaussian phase distribution approximations for oscillating gradient spin echo diffusion MRI. Journal of Magnetic Resonance Feb 2013;227:25-34
12. Özarslan, E., Yolcu, C., Herberthson, M., Knutsson, H. and Westin, C.F. (2018) Influence of the Size and Curvedness of Neural Projections on the Orientationally Averaged Diffusion MR Signal. Frontiers in Physics, March 2018;https://doi.org/10.3389/fphy.2018.00017
13. Fieremans, E., Novikov, D.S., Jensen, J.H. and Helpern, J.A. (2010) Monte Carlo study of a two‐compartment exchange model of diffusion. NMR Biomed. Sept 2010;23(7):711-724
Figures