4422
TE-dependence of NODDI-derived parameters and its modelling with compartmental T2 relaxation times1Center for Brain Imaging Science and Technology, College of Biomedical Engineering and Instrumental Science, Zhejiang University, Hangzhou, China, 2Department of Computer Science & Centre for Medical Image Computing, University College London, London, United Kingdom, 3Department of Imaging Sciences, University of Rochester, Rochester, NY, United States
Synopsis
Compartment-based models of diffusion MRI signals have become popular for probing tissue microstructure. However, the standard models do not explicitly model compartment-specific T2 relaxation. This has been shown to cause a TE-dependence of DTI-derived measures in white matter, which can confound the interpretation and quantification of results. Here we explored the TE-dependence of the widely used NODDI model and proposed a technique to determine parameter estimates that are TE-independent. This could be useful in investgateing diseases where changes of T2 and signal fraction interact.
Introduction
Given the multi-compartment nature of MRI signals, some studies have shown that intra-neurite water has a longer T2 compared to extra-neurite water[1-2]. However, most multi-compartment models in diffusion MRI, while providing more specific characterization of microstructural properties of white matter (WM), have not taken the compartment-specific T2 values into consideration. This might cause T2-weighted, thus TE-dependent, estimation of model-derived parameters, hampering interpretation and quantification of studies. For example, for models with an isotopic compartment for the CSF, the much longer T2 in CSF has been shown to cause an overestimation of CSF fraction in WM[3]; however this study does not account for the T2 difference between tissue compartments. In this study, we explored the TE dependence of the parameters derived from neurite orientation dispersion and density imaging (NODDI)[4] and proposed a technique to produce parameter estimates that are T2-independent.Method
TheoryThe NODDI’s three-compartment model:$$A=(1-f_{iso})(f_{in}A_{in}+(1-f_{in})A_{en})+f_{iso}A_{iso}, (1)$$ where $$$A_{in}$$$, $$$A_{en}$$$ and $$$A_{iso}$$$ are the normalized signals of intra-neurite, extra-neurite and CSF compartments; the $$$A_{in}$$$ is modelled as orientation-dispersed sticks, from which the orientation dispersion index (ODI) can be derived; $$$f_{in}$$$ and $$$f_{iso}$$$ are the normalized signal fractions of the intra-neurite and CSF compartments, which are relaxation-weighted and defined as: $$f_{in}=\frac{{S_{in}^0}{e^{-TE/T_2^{in}}}}{{{S_{in}^0}e^{-TE/T_2^{in}}+S_{en}^0}e^{-TE/T_2^{en}}}, (2)$$ $$f_{iso}=\frac{{S_{iso}^0}{e^{-TE/T_2^{iso}}}}{{{S_{in}^0}e^{-TE/T_2^{in}}+{S_{en}^0}e^{-TE/T_2^{en}}+{S_{iso}^0}e^{-TE/T_2^{iso}}}}, (3)$$
where $$$S_{in}$$$, $$$S_{en}$$$ and $$$S_{iso}$$$ represent signals at b=0 and TE=0 for each compartment, and $$$T_2^{in}$$$, $$$T_2^{en}$$$ and $$$T_2^{iso}$$$ are compartment T2 times. By defining the non-T2-weighted relative intra-neurite and CSF signal fractions as $$$f_{in}^0=\frac{{S_{in}^0}}{{{S_{in}^0}+{S_{en}^0}}}$$$ and $$$f_{iso}^0=\frac{{S_{iso}^0}}{{{S_{in}^0}+{S_{en}^0}+{S_{iso}^0}}}$$$ , the T2-weighted fractions can then be modelled as:
$$f_{in}(TE)=\frac{{f_{in}^0}{e^{-TE/T_2^{in}}}}{{{f_{in}^0}e^{-TE/T_2^{in}}+(1-f_{in}^0})e^{-TE/T_2^{en}}}, (4)$$ $$f_{iso}(TE)=\frac{{f_{iso}^0}{e^{-TE/T_2^{iso}}}}{{f_{iso}^0}{e^{-TE/T_2^{iso}}}+(1-f_{iso}^0)[{{f_{in}^0}e^{-TE/T_2^{in}}+(1-f_{in}^0})e^{-TE/T_2^{en}}]}, (5)$$
Eqn (4) shows that the TE-independent intra-neurite signal fraction, together with the compartment-specific T2 values, can be determined with this equation alone.In contrast, Eqn (5) shows that $$$f_{in}$$$ contributes to the TE-dependence of $$$f_{iso}$$$; hence, estimating $$$f_{in}^0$$$ is prerequisite to $$$f_{iso}^0$$$.
Data
Data were collected on a Siemens 3T Prisma scanner (Siemens, Erlangen, Germany) with a 64-channel head-neck coil. One healthy subject underwent diffusion-weighted imaging sequence at TE=68, 78, 88, 98, 108, 118 and 132 ms. The protocols in each TE session were as follows : three b = 0 s/mm2 images, and monopolar diffusion weightings of b =1000, 2000 and 3000 s/mm2 applied along 30 isotropically distributed directions; three b = 0 images in the reversed phase-encoding direction. The diffusion times were fixed, with δ∕Δ=17.1∕32.5 ms for all b-values and TE’s. Other imaging parameters: TR = 4000 ms; FOV = 225 × 225 mm2; slice number = 50; resolution = 2.5 × 2.5 × 2.5 mm3; slice acceleration factor = 2; phase acceleration factor = 2; bandwidth = 2416 Hz/pixel. Total imaging time was 50 min.
Processing
For diffusion data from each TE session, correction of B0 inhomogeneity, eddy current and motion were done with TOPUP[5] and EDDY[6] in FMRIB Software Library (FSL, University of Oxford, UK), followed by the fitting of NODDI-derived parameters. For analysis, anatomical ROIs in subject space were extracted from the JHU WM atlas[7] by non-linear registration.
After demonstrating the TE dependence of NODDI-derived parameters in WM ROIs, we estimated $$$f_{in}^0$$$, $$$T_2^{in}$$$ and $$$T_2^{en}$$$ from Eqn (4) using the NODDI estimates of the 7 TE's. We initialized each fit using one random starting point sampled from following parameter ranges: 0.4<$$$f_{in}^0$$$<0.6, 80<$$$T_2^{in}$$$<120 ms, 50<$$$T_2^{en}$$$<70 ms, which are in accordance with the central ranges of these parameters given in [1]. We fit Eqn (5) using a fixed $$$T_2^{iso}$$$ of 1000 ms, and the estimated values from (4) to get a corrected $$$f_{iso}^0$$$ in WM ROIs. The termination tolerance of all fittings on residual sum of squares and estimated coefficients are 10-10 with a maximum iteration of 1000 times.
Results & Discussion
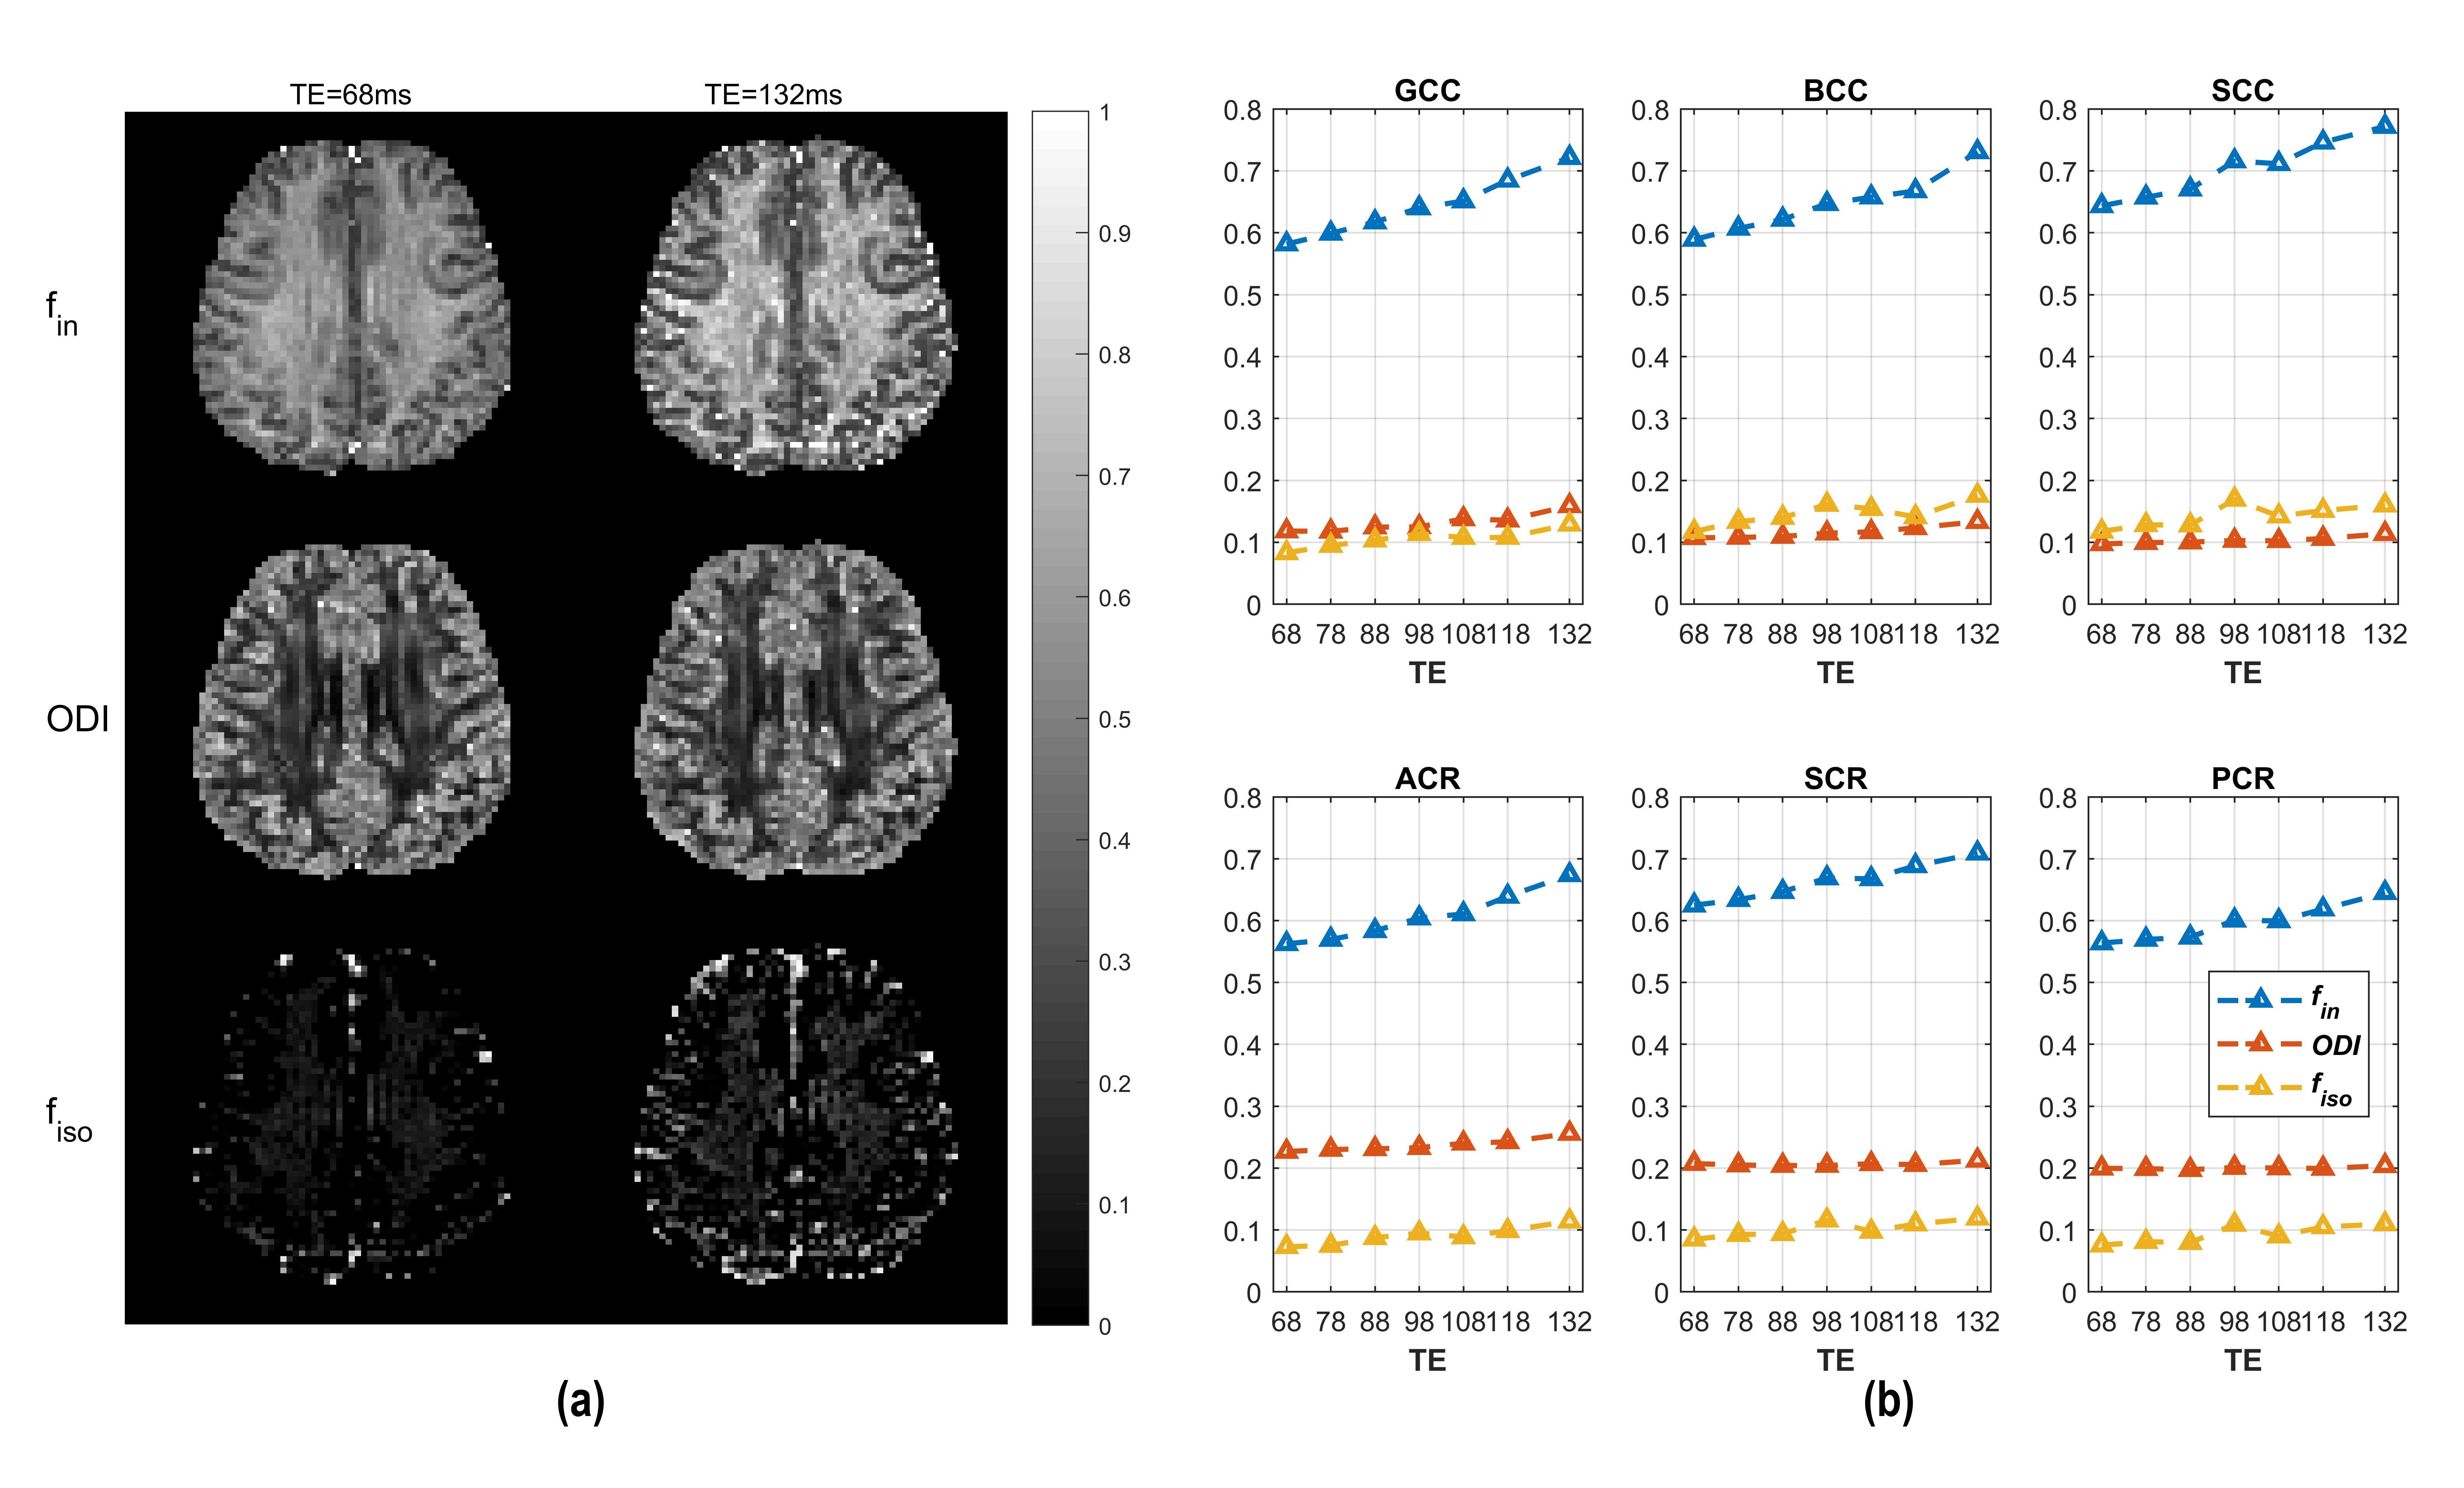
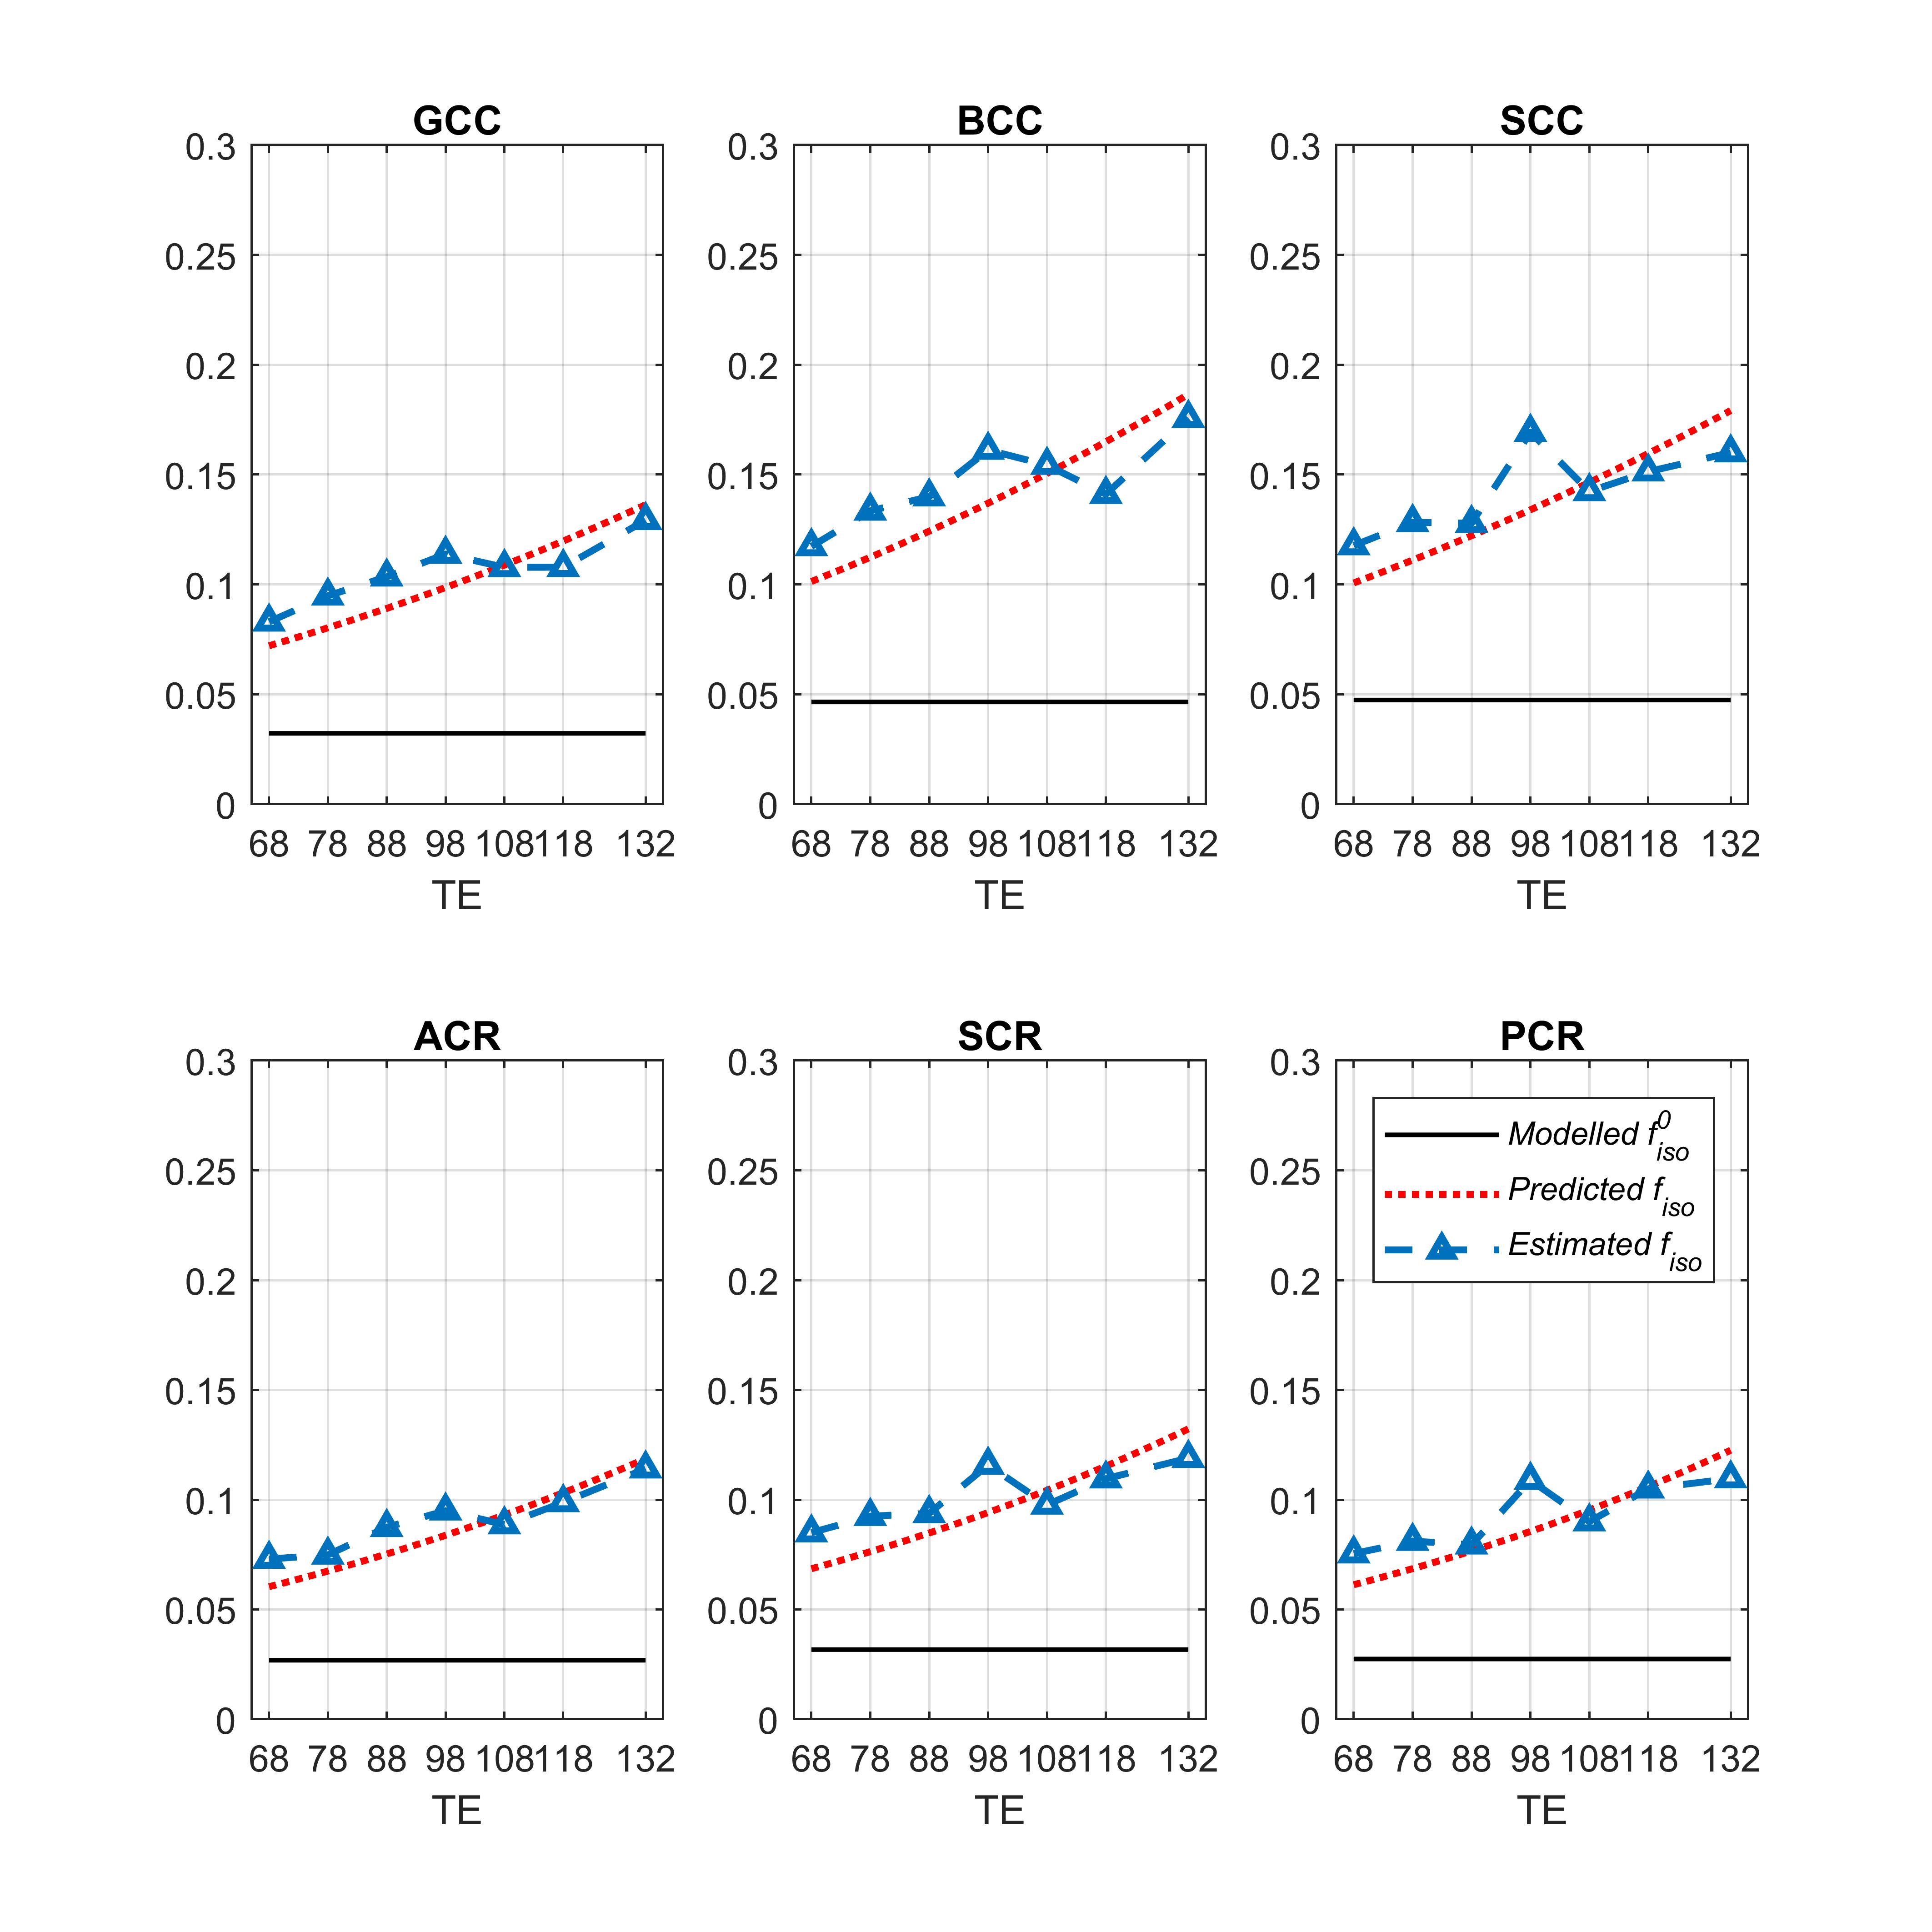
The NODDI model does not model relaxation explicitly, which causes TE dependence of its relaxation-weighted signal fractions (Figure 1). These T2 weighted signal fractions will give overestimated relative intra-neurite and CSF fractions, because $$$T_2^{in}>T_2^{en}$$$ and $$$T_2^{iso} \gg T_2^{in}$$$ respectively (Figure 2-4).Compared to study [1] where diffusion time varies for different TE’s, the fixed diffusion time we use eliminates the possibility of diffusion time as a confounding factor. Compared to study [3] where the correction of CSF-fraction overestimation assumes a single T2 in tissue, our method will provide a more accurate correction by accounting for compartment-specific T2 within tissue compartments, and provide TE-independent estimates of intra-neurite fraction.
The contribution of the TE dependence of the CSF fraction mainly comes from the TE dependence of tissue. As $$$T_2^{iso}$$$ is considerably longer than the longest TE of our study, the CSF signal is only weakly sensitive to TE. Thus, using a fixed $$$T_2^{iso}$$$ is a reasonable choice. The fluctuation in the NODDI-estimated CSF fractions is not surprising, as in WM, the CSF fraction is expected to be small and its effective SNR low.
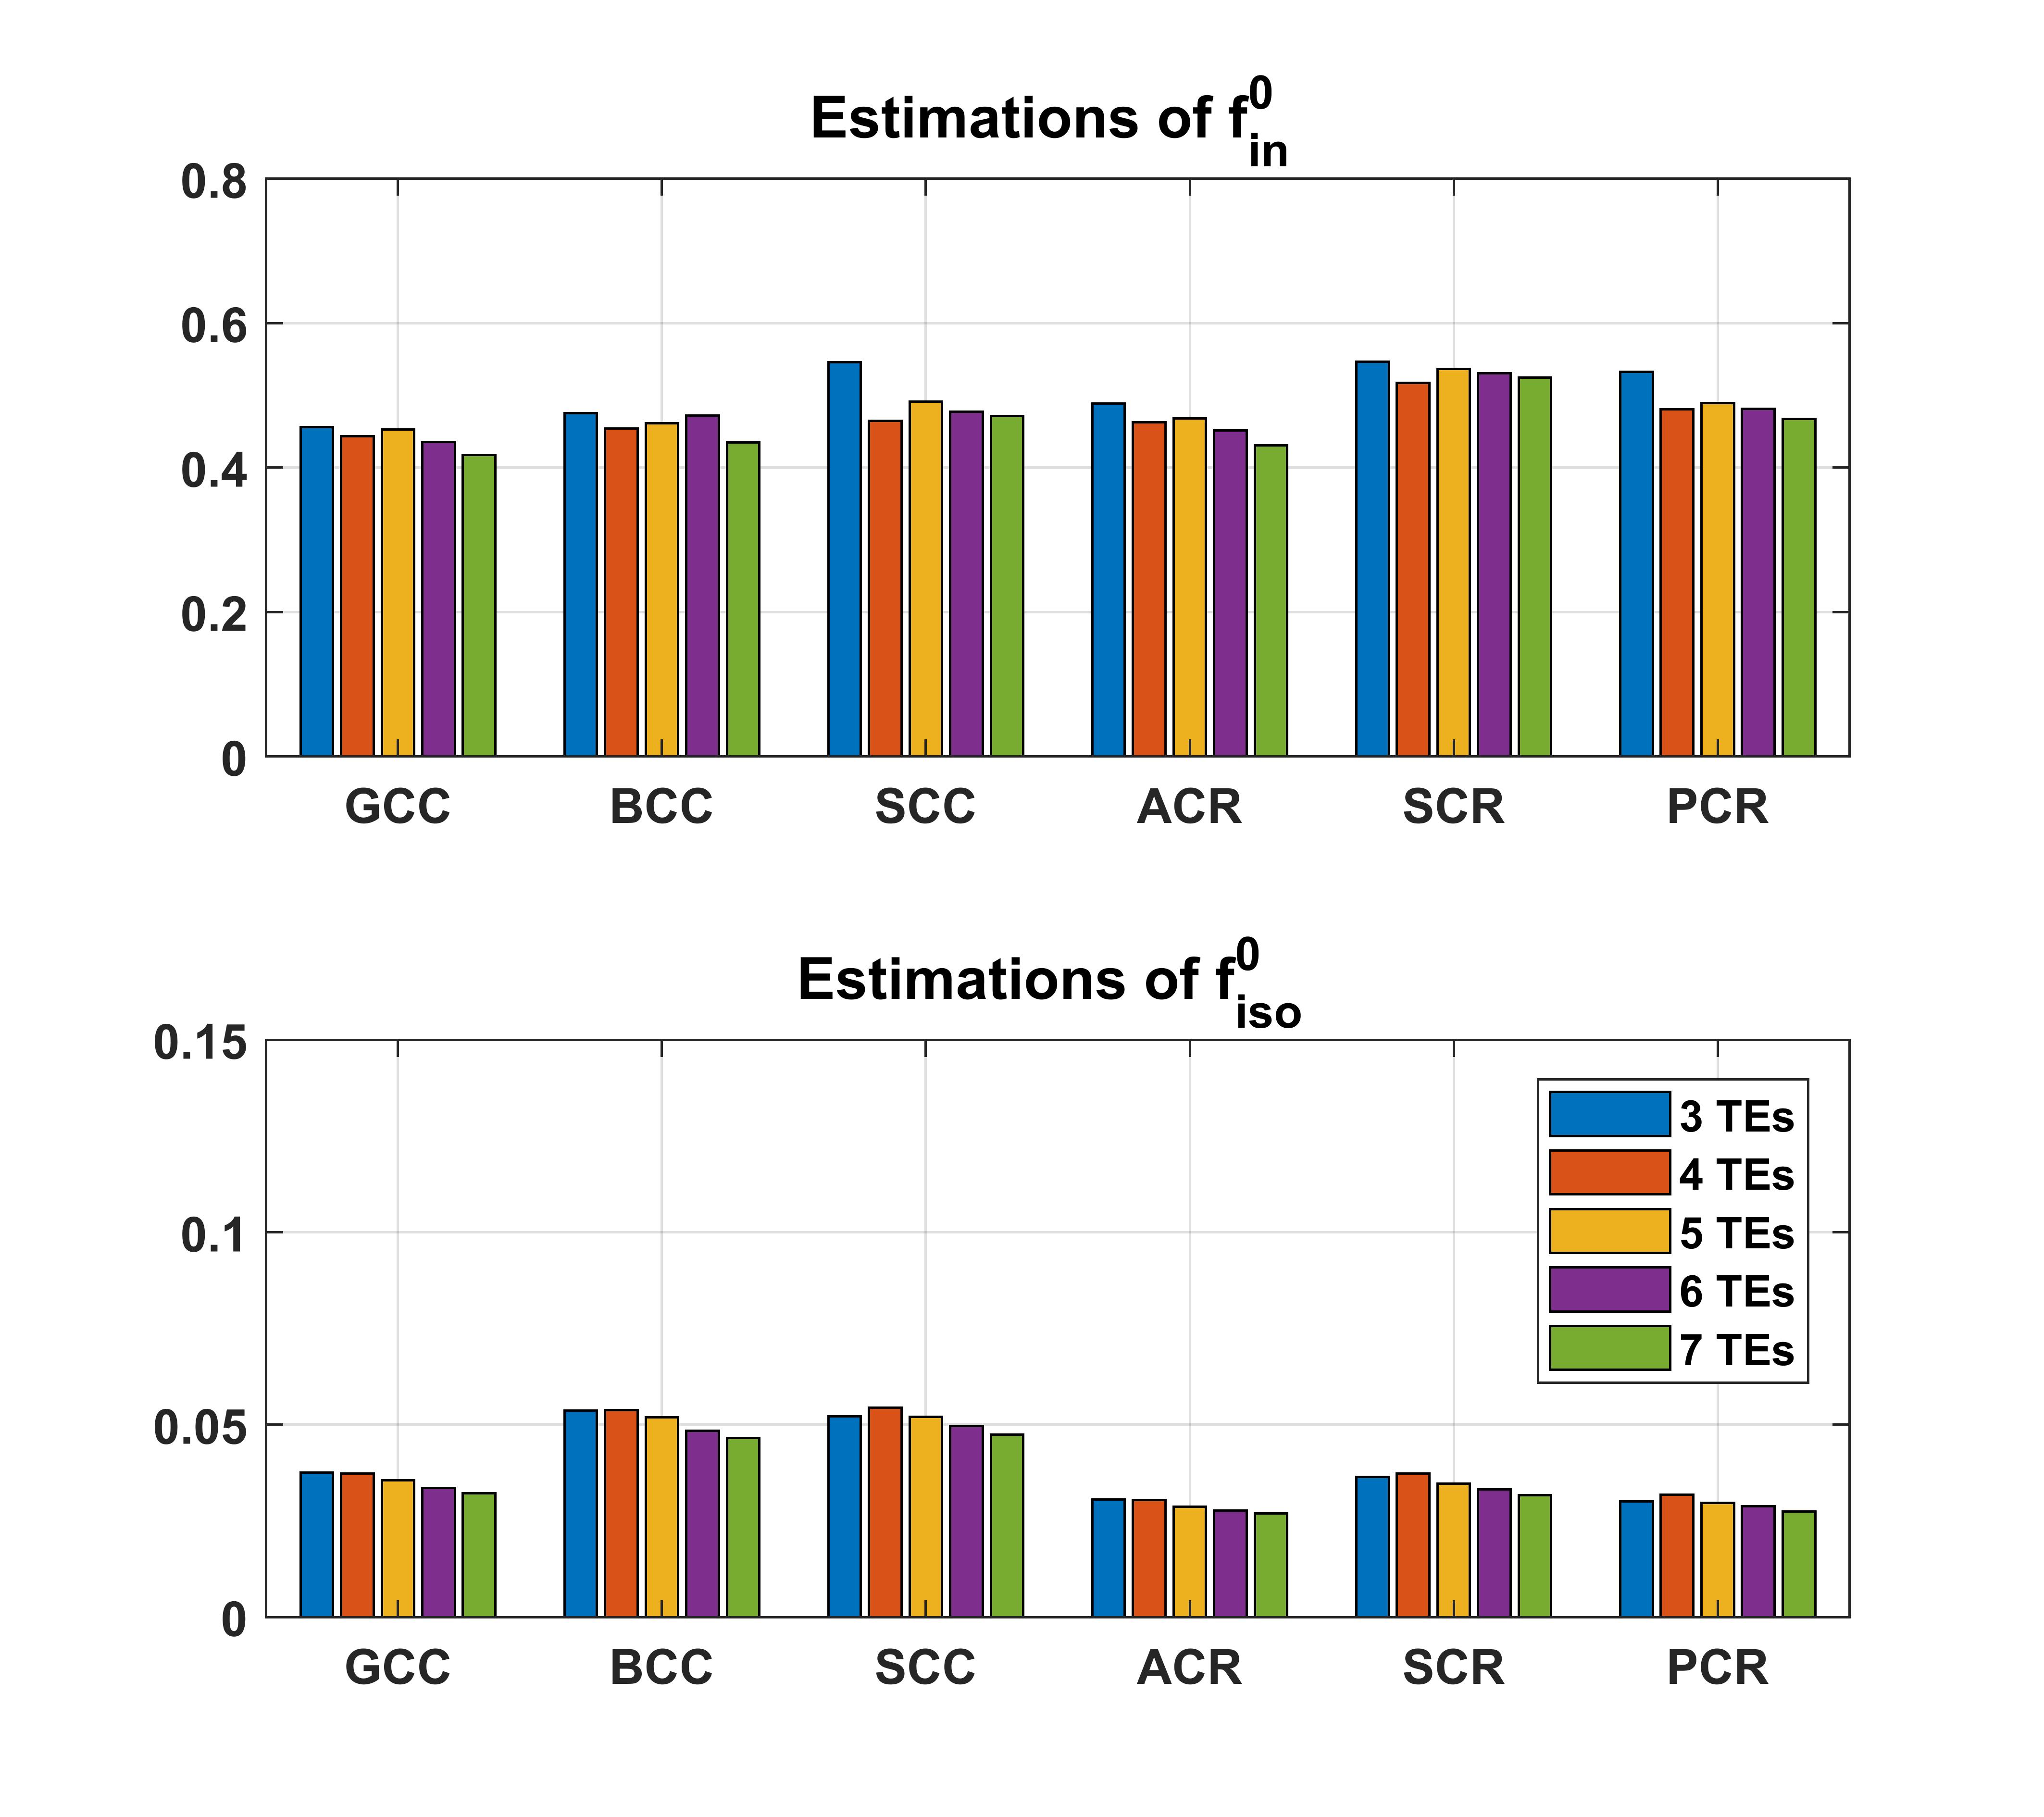
The number of TE could be reduced to 4 with an acceptable acquisition time of 30 minutes (Figure 5). The slight increase in ODI in some ROI’s suggests a potential limitation of the proposed technique. Future work will incorporate all the parameters into the process of voxel-wise NODDI estimation, and optimize the acquisition protocol.
Conclusion
This robust modelling of non-T2 weighted compartment fractions could be beneficial to inter-study comparison and also some diseases when alteration of fraction and T2 interacts.Acknowledgements
No acknowledgement found.References
[1] Veraart J, Novikov DS, Fieremans E. TE dependent Diffusion Imaging (TEdDI) distinguishes between compartmental T2 relaxation times. Neuroimage 2018
[2] Lin M, He H, Tong Q, et al. Effect of myelin water exchange on DTI-derived parameters in diffusion MRI: Elucidation of TE dependence. Magn. Reson. Med. 2018
[3] Bouyagoub S, Dowell NG, Hurley SA, Wood TC, Cercignani M. Overestimation of CSF fraction in NODDI: possible correction techniques and the effect on neurite density and orientation dispersion measures. In: 24th Annual Meeting of the International Society for Magnetic Resonance in Medicine. Singapore. ; 2016.
[4] Zhang H, Schneider T, Wheeler-Kingshott CA, Alexander DC. NODDI: Practical in vivo neurite orientation dispersion and density imaging of the human brain. Neuroimage 2012;61:1000–1016
[5] Andersson JLR, Sotiropoulos SN. An integrated approach to correction for off-resonance effects and subject movement in diffusion MR imaging. Neuroimage 2016;125:1063–1078
[6] Andersson JLR, Graham MS, Zsoldos E, Sotiropoulos SN. Incorporating outlier detection and replacement into a non-parametric framework for movement and distortion correction of diffusion MR images. Neuroimage 2016;141:556–572
[7] Mori S, Wakana S, Nagae-Poetscher LM, Van Zijl PC. MRI atlas of human white matter. American Journal of Neuroradiology. 2006;27(6):1384.
Figures