4420
Characterisation of microvascular blood velocity, exchange and structure using multi-diffusion time DWI1Division of Neuroscience and Experimental Psychology, University of Manchester, Manchester, United Kingdom, 2Quantitative Biomedical Imaging Laboratory, University of Manchester, Manchester, United Kingdom, 3Radiology, Cambridge University Hospitals NHS Foundation Trust, Cambridge, United Kingdom
Synopsis
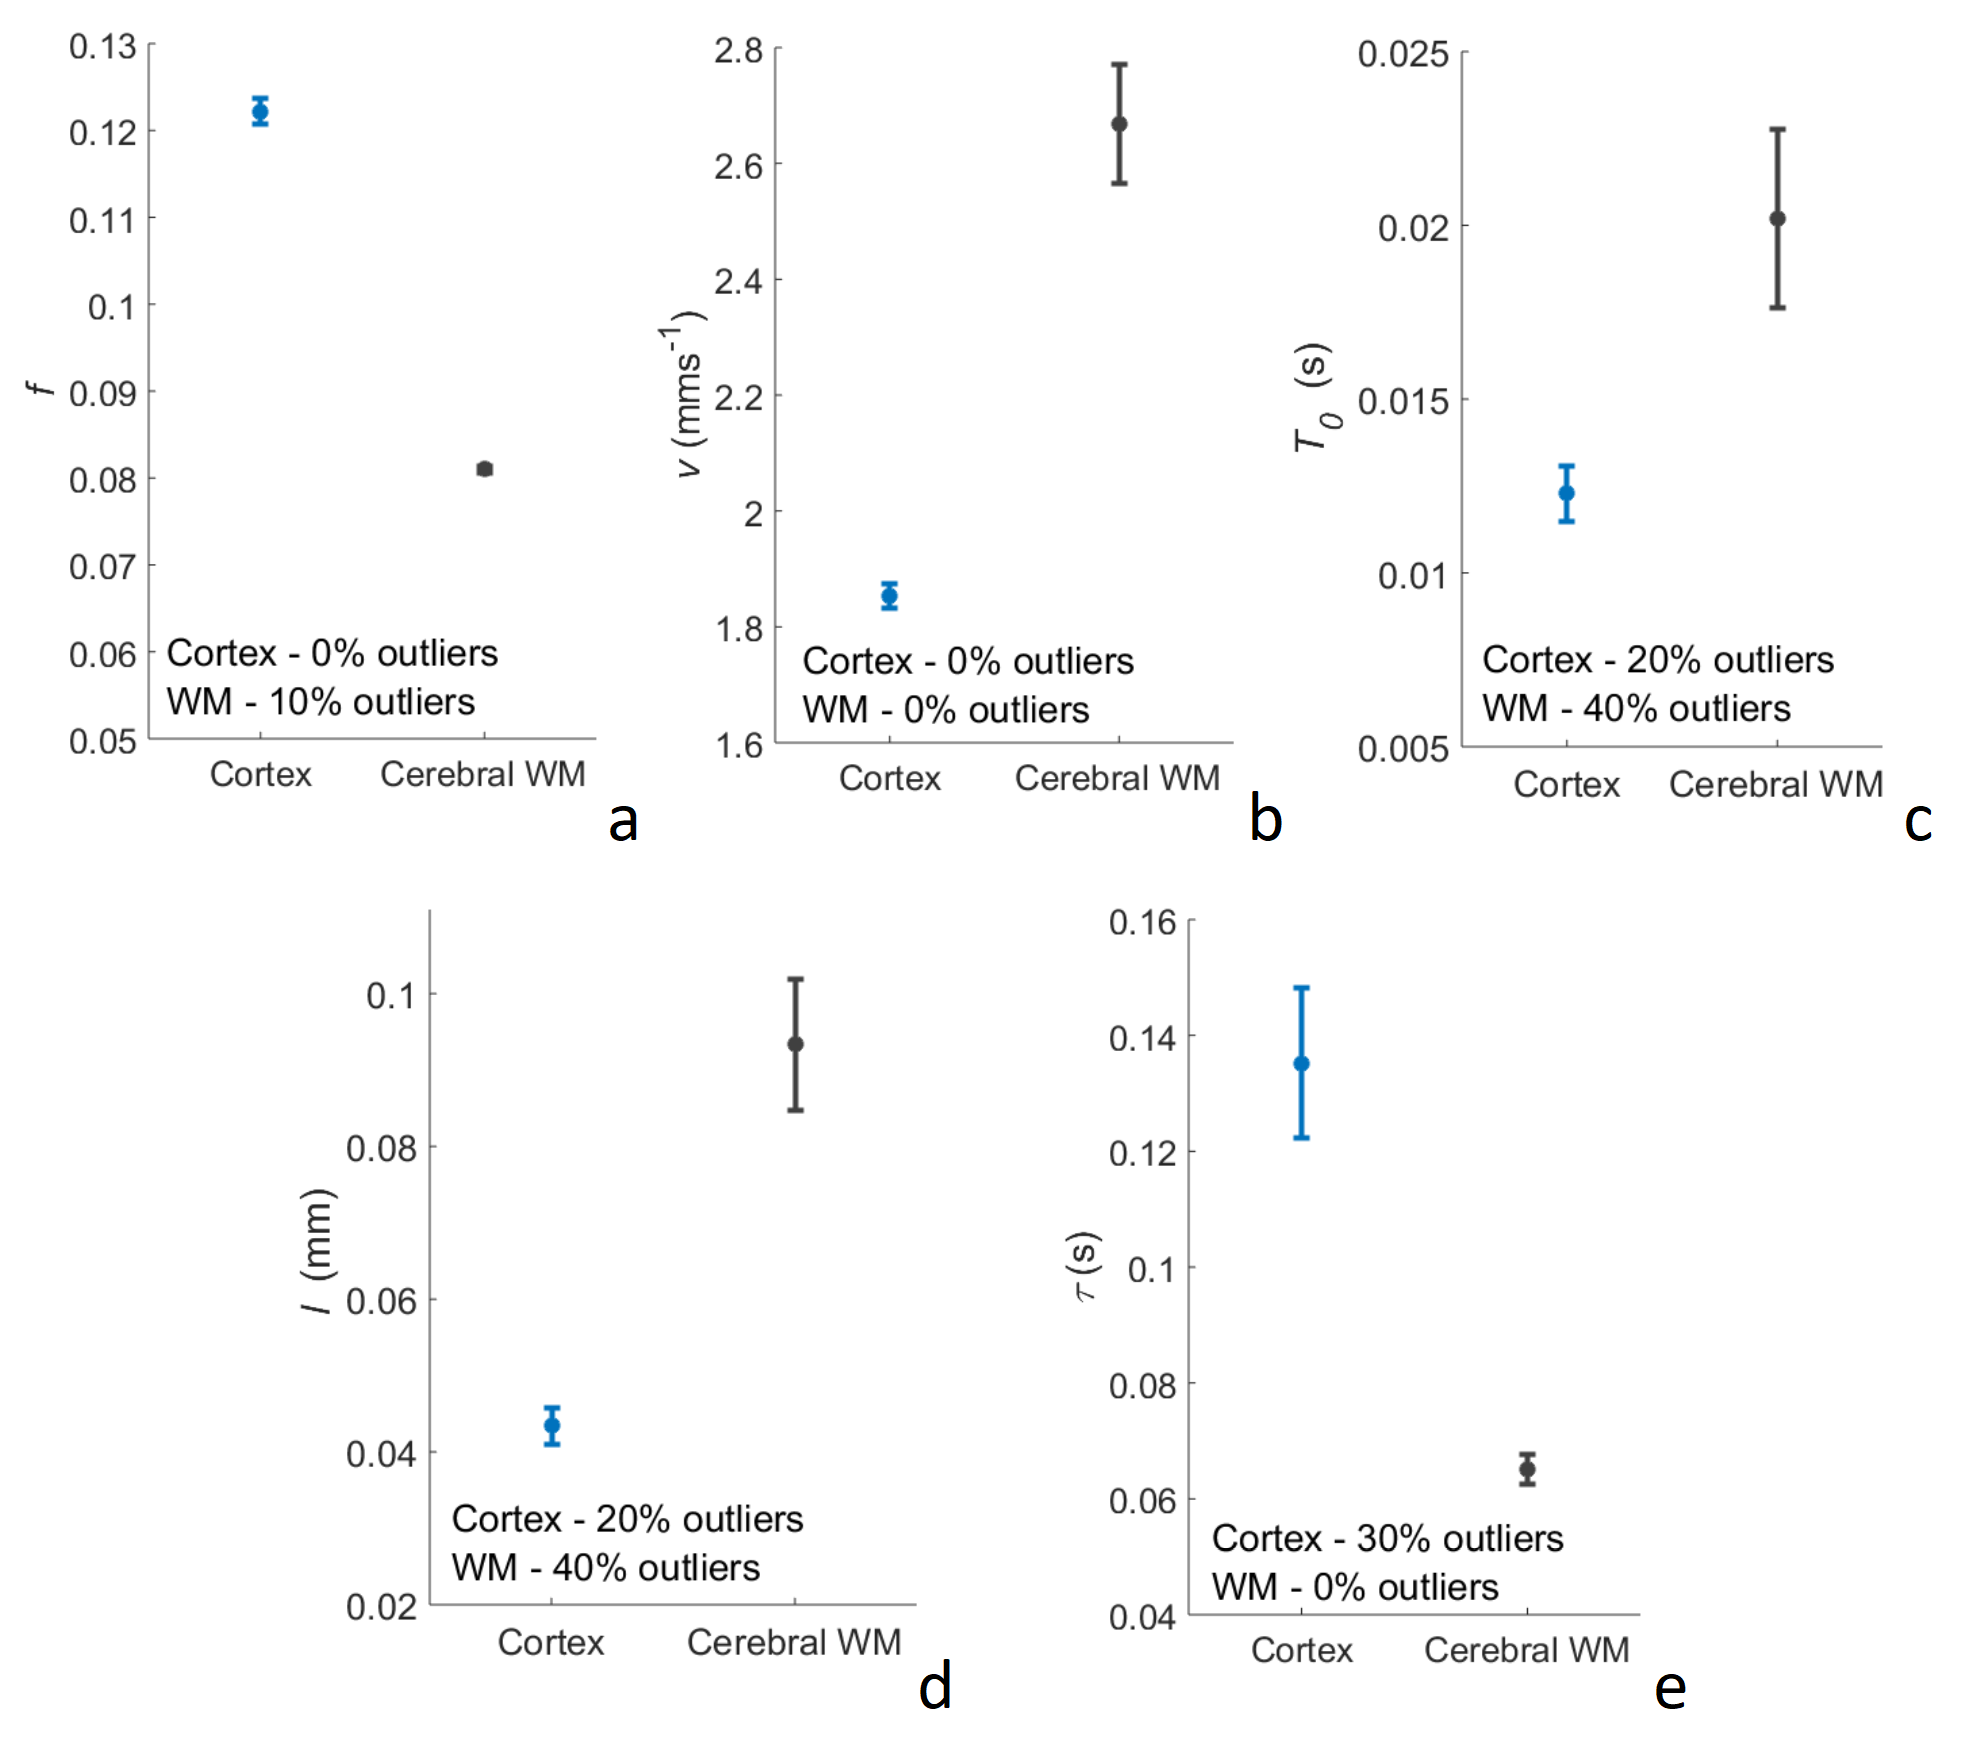
Diffusion-time (∆) dependence in the bi-exponential intra-voxel incoherent motion model of diffusion-weighted imaging (DWI) signal decay is generally not considered. However, by using multi-∆ signal acquisitions, blood flow dynamics across different flow regimes can be accessed. In this study, we use multi-∆ DWI and an adapted velocity autocorrelation model to estimate blood velocity (v), capillary segment length (l) and transvascular water exchange. Human cerebral cortex and white matter (WM) estimates of v (cortex: 1.85 ± 0.21 mms-1; WM: 2.67 ± 1.01 mms-1) and l (cortex: 43.4 ± 19.5 µm; WM: 93.3 ± 51.1 µm) are consistent with literature values.
Introduction
The role of microvascular pathology in the development and progression of several neurological disorders appears important1; and so methods of imaging microvessel structure and function are needed to investigate. Intra-voxel incoherent motion (IVIM)2 results in bi-exponential DW signal decay as a function of b-value, the two components describing the intravascular and extravascular signal contributions. Generally, the diffusion-time (∆) is not considered in IVIM studies, despite ∆ dependence being shown to exist in both compartments3,4,5. For the vascular compartment, varying ∆ allows access to blood flow dynamics across different flow regimes. For example, flow at high ∆ is dependent on vessel structure and average blood velocity (v), whereas, at low ∆ there is a dependence only on v. A further factor which has not been investigated, is the signal dependence on exchange of water between intra- and extra-vascular compartments. By considering these factors, more accurate characterisation of blood flow in the microcirculation can be developed. In this study, multi-∆ DW-MR data from healthy volunteers is analysed with a velocity-autocorrelation (VA) model6, modified to include an exchange term. Parameters extracted include velocity, the mean water residence time in the intravascular compartment, and the average capillary segment length. The diffusion coefficient and perfusion fraction of IVIM theory are also estimated.Theory
Signal attenuation was modelled as a bi-exponential, shown by Equation 1, with extravascular and intravascular contributions2 characterised by the diffusion coefficient, D(∆), and the effective perfusion coefficient, keff(Δ), respectively:$$ \frac{S}{S_0} = (1-f)e^{-bD(\Delta)} + fe^{-bk_{eff} + C}$$
D(∆) = Dinf + A/∆ where Dinf is the diffusion coefficient with infinite diffusion time (∆) and A is a structure dependent parameter independent of ∆3. C allows for a better fit to data by accounting for bias in extravascular parameters and a finite value of the b=0 image. The perfusion coefficient, k(∆), assumes pseudo-random orientation of the microcirculation and is described by a VA model6:
$$ k(∆) = v^2 T_0 \frac{δ^2 (Δ -δ/3)- 2δT_0^2 - T_0^3 ( 2e^{-Δ/T_0 }+ 2e^{-δ/T_0 }- e^{-(Δ+δ)/T_0 }- e^{-(Δ-δ)/T_0 }- 2 )}{3(Δ-δ/3) δ^2 } $$
where v is the average blood velocity, T0 is the time taken for blood flow to change direction (correlation time) and δ is the diffusion gradient duration. To model exchange, we assume k reduces as water leaves the vessel during ∆7 and is replaced by mostly unattenuated water from the extravascular space. Assuming water in the intravascular compartment has an exponential residue function, k in the presence of finite water exchange is given by:
$$ k_{eff} = k e^{-\Delta/\tau} $$
where τ is the mean water residence time in the intravascular compartment.
Methods
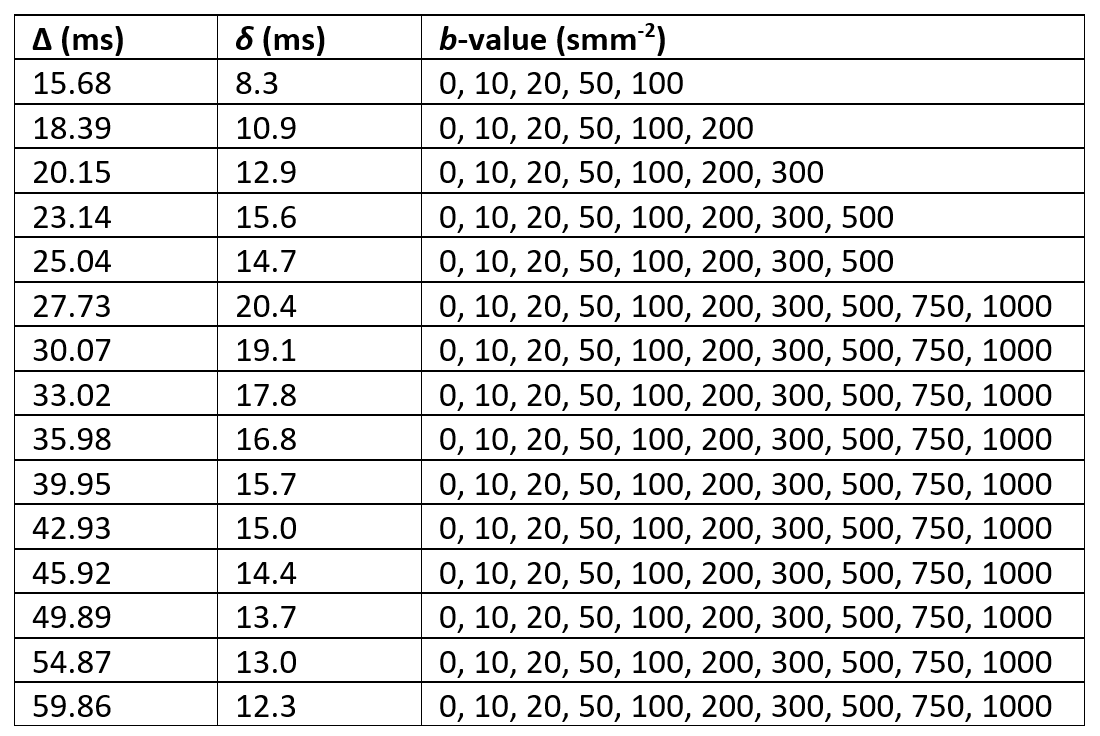
MR acquisition: Axial DW brain images were acquired over three directions for ten healthy volunteers (mean age 28.0 ± 5.8, 6 female, 4 male) on a GE PET-MR 3.0 T scanner with 32-channel NOVA head coil. b-values, ∆ and δ are shown in Table 1. TR: 5525 ms. TE: 95.3 ms. Voxel resolution = 0.81 x 0.81 x 4.0 mm3. Matrix size = 256 x 256 x 35. Images were acquired twice. A 3D SPGR T1-weighted image was acquired for image segmentation. FreeSurfer v68 was used for segmentation of cortical and white matter regions and SPM12 (http://www.fil.ion.ucl.ac.uk/spm) for re-slicing and co-registration with DW images.Data analysis: Signals were averaged over the three directions and normalised with b=0 signal. Least-squares fitting of the VA model to multi-∆ signals6 using a trust-region-reflective algorithm provided estimates of f, D, v, T0 and τ. Models were fitted in two-steps, first the extravascular component was isolated by estimating D(∆) and f using signals at b=500-1000 smm-2 and all corresponding ∆ values. Vascular parameters were then estimated using the intravascular signal (total normalised signal minus extravascular signal) at remaining b-values and all corresponding Δ-values. The average vessel segment length (l) was calculated using the relationship6: l=2vT0 . To visually represent the vascular contribution, keff was calculated by substituting estimates of v, T0 and τ into Equations 2 and 3. Outliers outside of three median absolute deviations of the median were removed for each parameter. Unpaired t-tests assuming unequal variance and analysis of covariance (ANCOVA) were used to test effects of region on parameter estimate.
Results and discussion
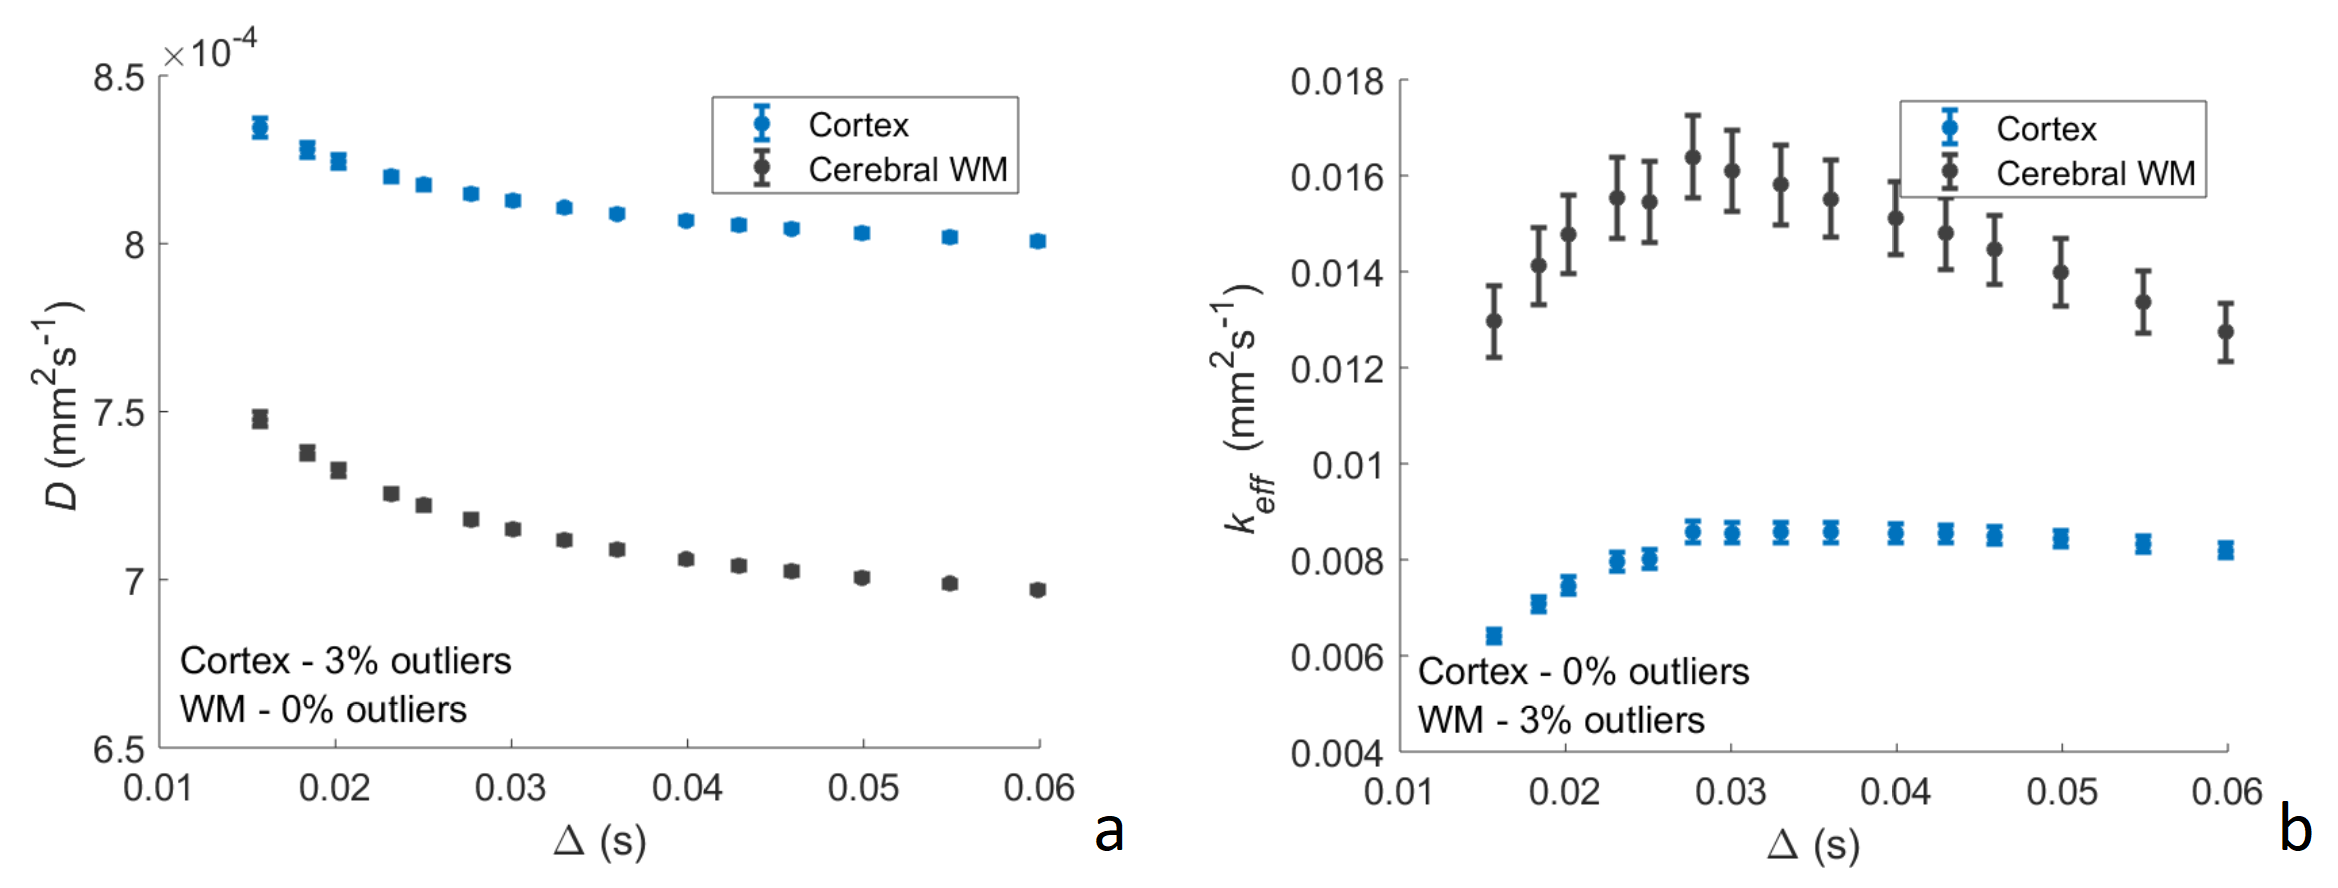
Average parameter estimates (Figures 1 and 2) lie within the expected range9,10 with exception of τ which is smaller than expected7. f is larger than generally expected in the brain9, but is similar to previous estimates using the general IVIM model2,11. ANCOVA showed significant effects of brain region on both D and f (p<0.0001), t-tests showed significant differences between the cerebral cortex and WM for f (p<0.0001) and v (p=0.033). Higher D is shown in the cerebral cortex for all ∆, an expected result due to restricted diffusion in white matter tracts. f is higher in the cortex, a result observed experimentally11,12, and v is higher in white matter- results which may be explained by different vascular structure in WM, for example, reduced branching and isotropy12, or reduced vessel size.Conclusions
Our approach of characterising blood flow using multi-∆ DW-MR produces reasonable estimates of f, D, v and l 9,10,11. Significant differences were found between the cortex and the cerebral white matter. Validation of the method is important.Acknowledgements
Medical Research Council (MRC), Engineering and Physical Sciences Research Council (EPSRC)References
1 Zlokovic BV, Neurovascular pathways to neurodegeneration in Alzheimer's disease and other disorders, Nat Rev Neurosci. 2011 Nov 3;12(12):723-38
2 Le Bihan D, Breton E, Lallemand D, Aubin ML, Vignaud J, Laval-Jeantet M, Separation of diffusion and perfusion in intravoxel incoherent motion MR imaging, Radiology. 1988 Aug;168(2):497-505
3 Reynaud O, Winters KV, Hoang DM, Wadghiri YZ, Novikov DS, Kim SG, Pulsed and oscillating gradient MRI for assessment of cell size and extracellular space (POMACE) in mouse gliomas, NMR Biomed. 2016 Oct;29(10):1350-63
4 Wu D, Zhang J, Evidence of the diffusion time dependence of intravoxel incoherent motion in the brain, Magn Reson Med. 2019 Dec;82(6):2225-2235
5 Scott L, Dickie B, Rawson S, Coutts G, Burnett T, Parker G, Allan S, Parkes L, Multi-diffusion time DWI to detect altered microvessel structure in a rat model of hypertension, Proc. Intl. Soc. Mag. Reson. Med. 27 (2019)
6 Kennan R, Gao J, Zhong J, Gore J, A general model of microcirculatory blood flow effects in gradient sensitized MRI, Med Phys 1994 Apr;21(4):539-45
7 Dickie B, Parker G, Parkes L, Measuring water exchange across the blood-brain barrier using MRI, Prog Nucl Mag Res Sp. ARTICLE IN PRESS, 10.1016/j.neuroimage.2018.09.030
8 Dale, A.M., Fischl, B., Sereno, M.I., 1999. Cortical surface-based analysis. I. Segmentation and surface reconstruction. Neuroimage 9, 179-194
9 Federau C, O'Brien K, Meuli R, Hagmann P, Maeder P, Measuring brain perfusion with intravoxel incoherent motion (IVIM): initial clinical experience, J Magn Reson Imaging. 2014 Mar;39(3):624-32
10 Unekawa M, Tomita M, Tomita Y, Toriumi H, Miyaki K, Suzuki N, RBC velocities in single capillaries of mouse and rat brains are the same, despite 10-fold difference in body size, Brain Res. 2010 Mar 12;1320:69-73
11 Wirestam R, Borg M, Brockstedt S, Lindgren A, Holtås S, Ståhlberg F, Perfusion-related parameters in intravoxel incoherent motion MR imaging compared with CBV and CBF measured by dynamic susceptibility-contrast MR technique, Acta Radiol. 2001 Mar;42(2):123-8
12 Wilhelm I, Nyúl-Tóth A, Suciu M, Hermenean A, Krizbai I, Heterogeneity of the blood-brain barrier, Tissue Barriers. 2016 Jan-Mar; 4(1): e1143544
Figures