4419
Quantifying Intra-Soma Diffusion Properties via Spherical Mean Spectrum Imaging1Department of Biomedical Engineering, UNC-Chapel Hill, Chapel Hill, NC, United States, 2Department of Radiology and BRIC, UNC-Chapel Hill, Chapel Hill, NC, United States
Synopsis
We propose a novel model to quantify intra-soma diffusion properties, including volume fractions and kurtosis. The model is flexible, allowing simultaneous modeling of multiple tissue compartments without the need for assumptions on the number of compartments and their diffusivities. We demonstrate that our method provides biologically meaningful contrasts that agree well with histological data.
Introduction
Most existing biophysical diffusion models aim to capture the diffusion patterns of intra- and extra-cellular diffusion pertaining to microstructural environments inside and outside axons. The lacking of consideration of neuronal cell bodies (somas) causes erroneous attribution of the signal from the cell body space to the extra-cellular compartment. Therefore, these models, while producing reasonable results in the white matter, might give an inaccurate account of tissue microstructure in gray matter.Recently Palombo et al. [1] proposed a model called SANDI for quantifying intra-soma diffusion. While promising, SANDI does not include a free-water diffusion compartment, uses isotropic diffusion to model extra-cellular compartment, and assumes the diffusivity of the intra-soma compartment to be equal to free-water diffusivity. These assumptions might not necessarily hold and could result in misestimation of microstructural properties.
In this abstract, we show that the recently introduced spherical mean spectrum imaging (SMSI) [2] can be employed to quantify intra-soma diffusion. We use SMSI to estimate the soma volume fraction and then show that the structuredness of the soma microenvironments can be characterized by excess kurtosis.
Method
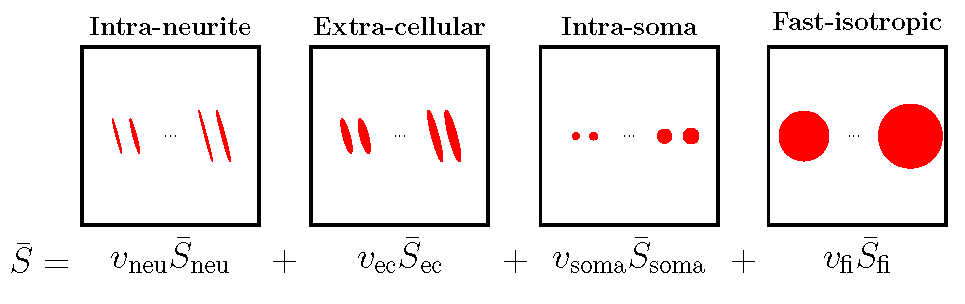
We employ SMSI to probe intra-soma diffusion. Details on SMSI can be found in [2]. Briefly, SMSI represents the spherical mean signal as a spectrum of fine- to coarse-scale diffusion processes.SMSI allows flexible division of the spectrum for more specific characterization of tissue compartments. Here, we consider four subspectra (see Fig. 1):
- Intra-neurite subspectrum with high axial and low to no radial diffusion, typical in white matter and commonly represented using ``sticks''.
- Extra-cellular subspectrum with high axial and moderate radial diffusion, typical in extra-cellular space and commonly represented using zeppelins.
- Intra-soma subspectrum with slow isotropic diffusion, represented by small spheres with $$$\lambda_{\parallel}=\lambda_{\bot} \leq 1 \, \mu \text{m}^2\text{/}\text{ms}$$$.
- Fast-isotropic subspectrum including free-water diffusion, represented by big spheres with $$$2 \, \mu \text{m}^2\text{/}\text{ms} \leq\lambda_{\parallel}=\lambda_{\bot} \leq 3 \, \mu \text{m}^2\text{/}\text{ms}$$$.
Once the intra-soma volume fraction $$$v_{\text{soma}}$$$ is computed based on SMSI, we can discard the signal from the non-soma compartments and the compute the apparent kurtosis $$$K_{\text{soma}}$$$ [3] and diffusivity $$$\lambda_{\text{soma}}$$$ of the intra-soma diffusion based on the signal contribution $$$\bar{S}_{\text{soma}}(b)$$$ from the soma, using the following relationship:
\begin{align}\ln \bar{S}_{\text{soma}}(b) &=-b\lambda_{\text{soma}}+\frac{b^{2}}{6}K_{\text{soma}}\lambda_{\text{soma}}^2.\end{align}
Results
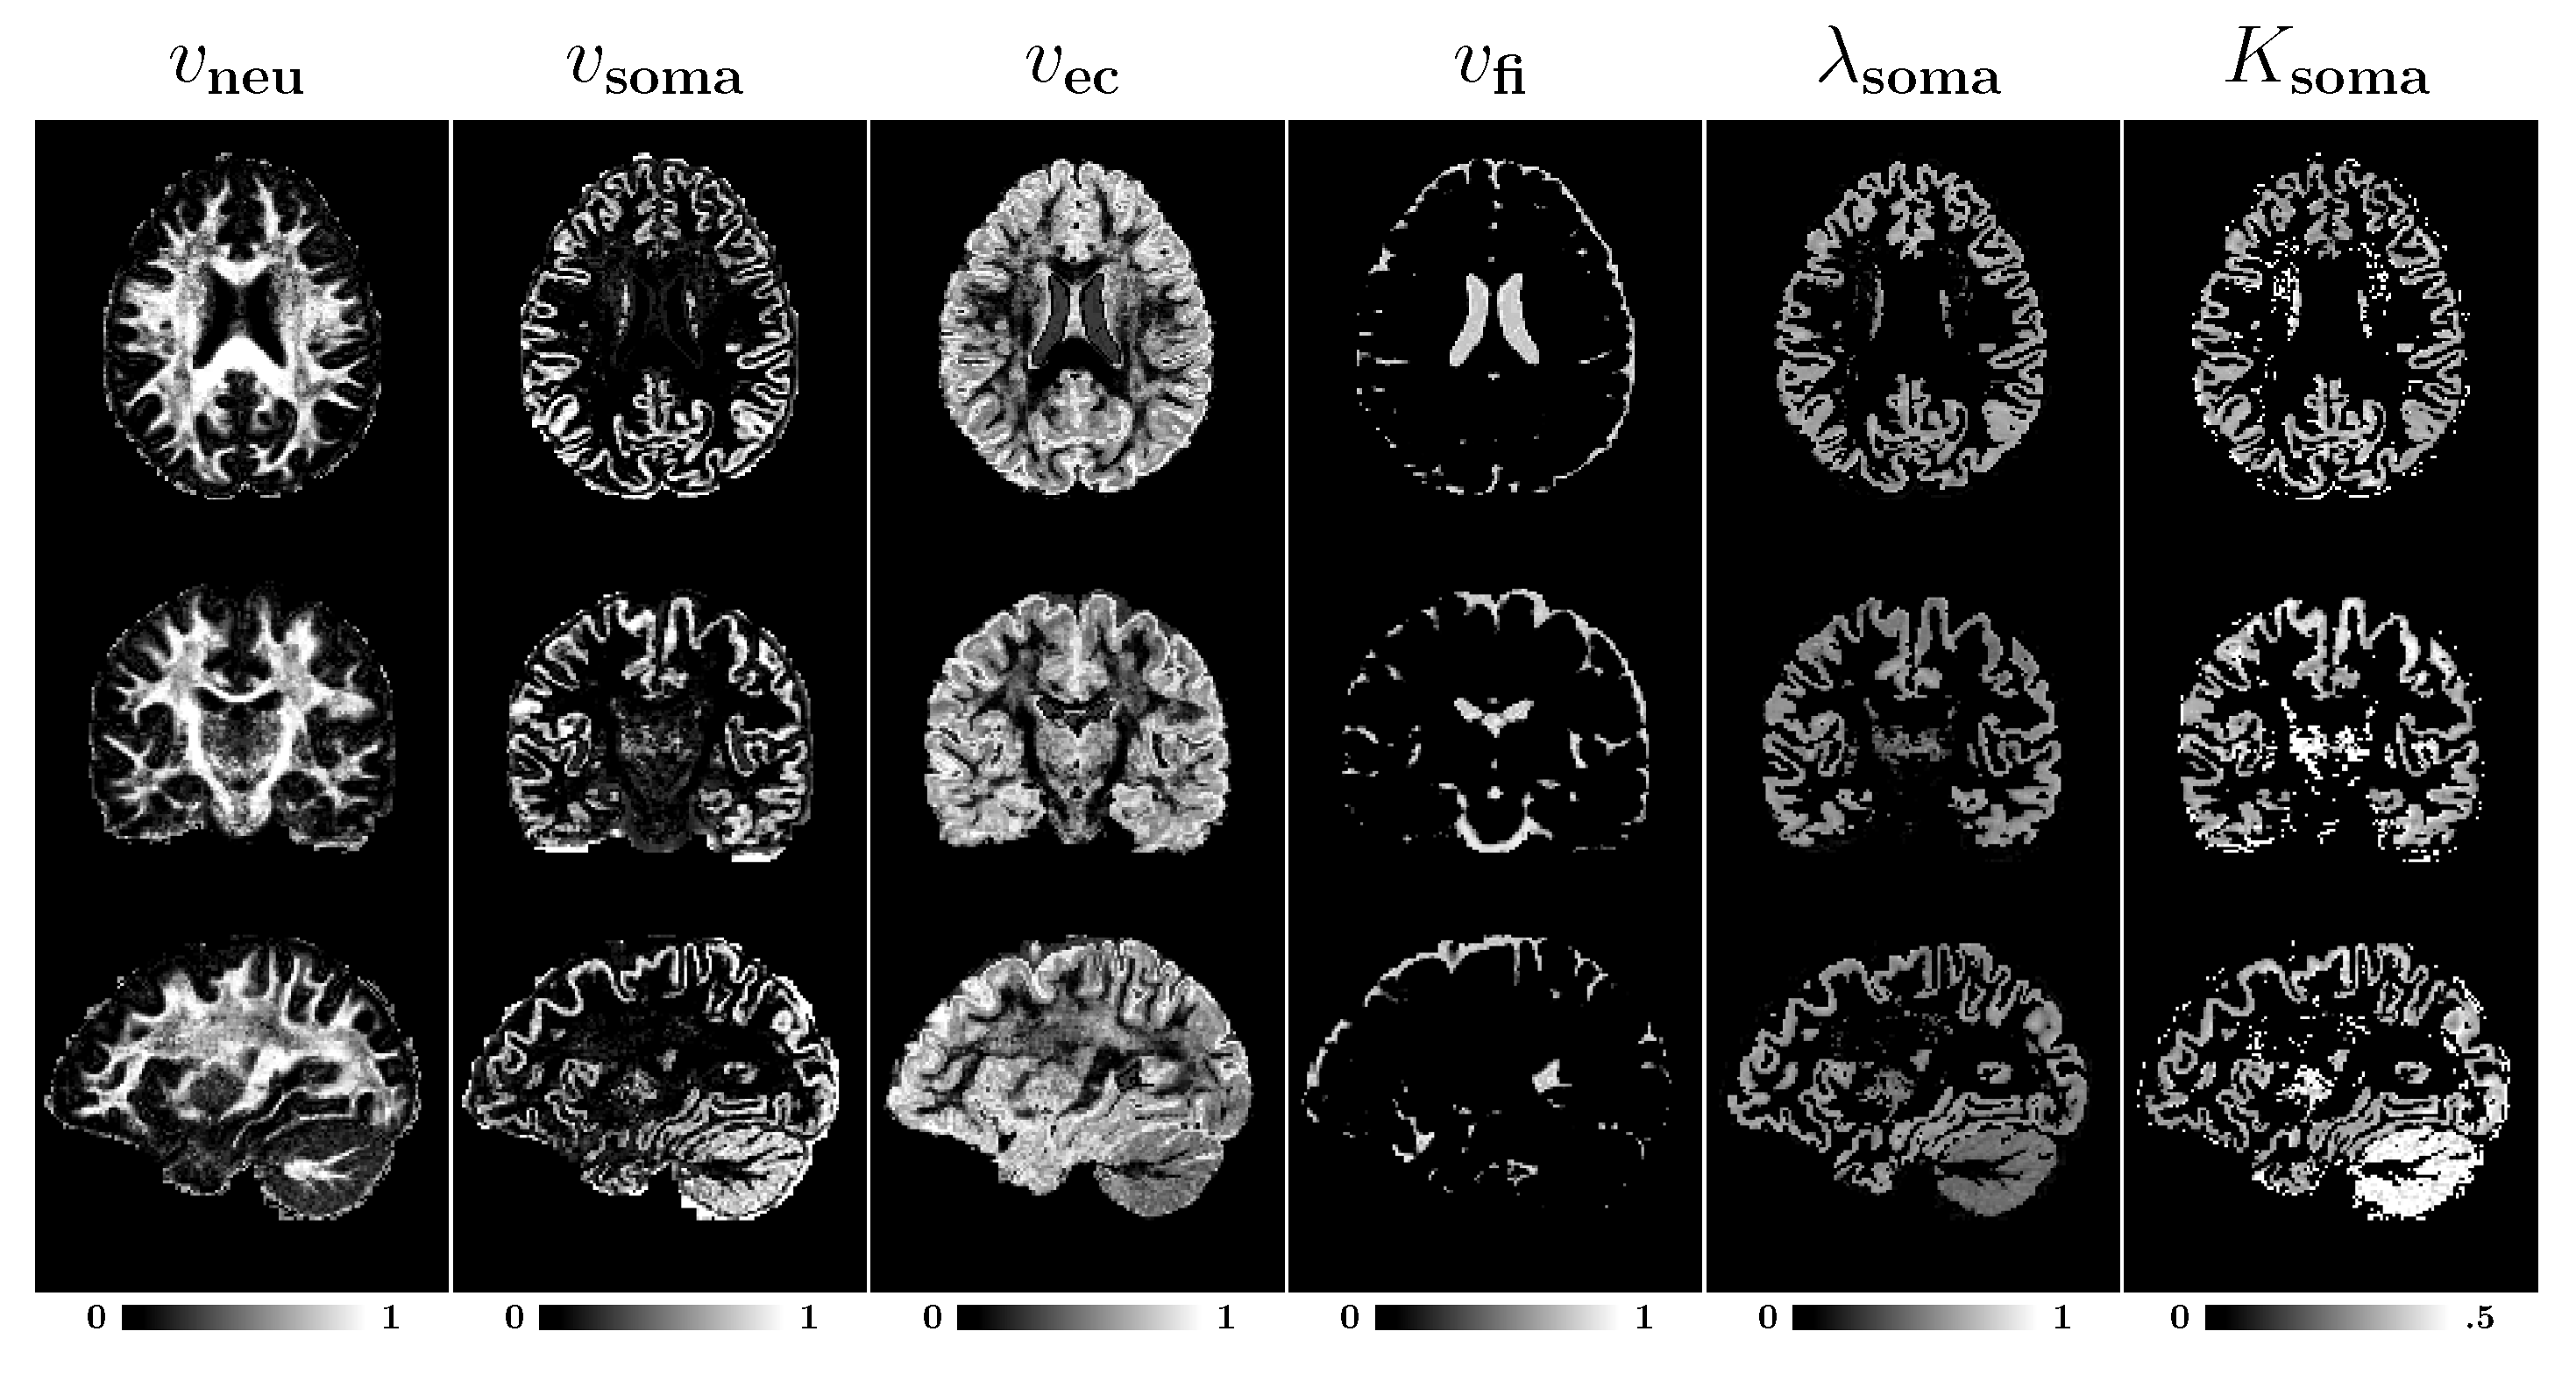
For evaluation, we used diffusion MRI data from 4 healthy adults, each has 12, 24, and 48 diffusion-weighted images respectively for $$$b=1000,2000,3000 \text{ s/mm}^2$$$ and 6 B$$$0$$$ images, to perform the analysis. The images were corrected for motion, eddy current, and off-resonance artifacts [4]. Then, a debiasing step was performed to break the Rician noise floor as described in [5].Microstructure maps: Fig. 2 presents the parametric maps for a representative subject. In white matter, the intra-neurite volume fraction ($$$v_{\text{neu}}$$$) is high, in line with previous findings that these regions contain mostly myelinated axons [5-7], giving a clear contrast for major fiber bundles such as forceps major, forceps minor, and cortical spinal tract. The extra-cellular volume fraction ($$$v_{\text{ec}}$$$) is higher in superficial white matter and some gray matter regions. The fast-isotropic volume fraction ($$$v_{\text{fi}}$$$) map highlight the ventricles and peripheral regions where there is little to no microscopic barriers to diffusion.
The intra-soma volume fraction ($$$v_{\text{soma}}$$$) is higher in the cortical ribbon. The typical value is between 0.1-0.2, which are in line with recent findings [1,8].
The soma diffusivity ($$$\lambda_{\text{soma}}$$$) is mostly around $$$0.6\mu \text{m}^2\text{/}\text{ms}$$$ in the cortex and is slightly lower in the cerebellum. The soma kurtosis ($$$K_{\text{soma}}$$$), although small, is non-zero, is highest in the cerebellum.
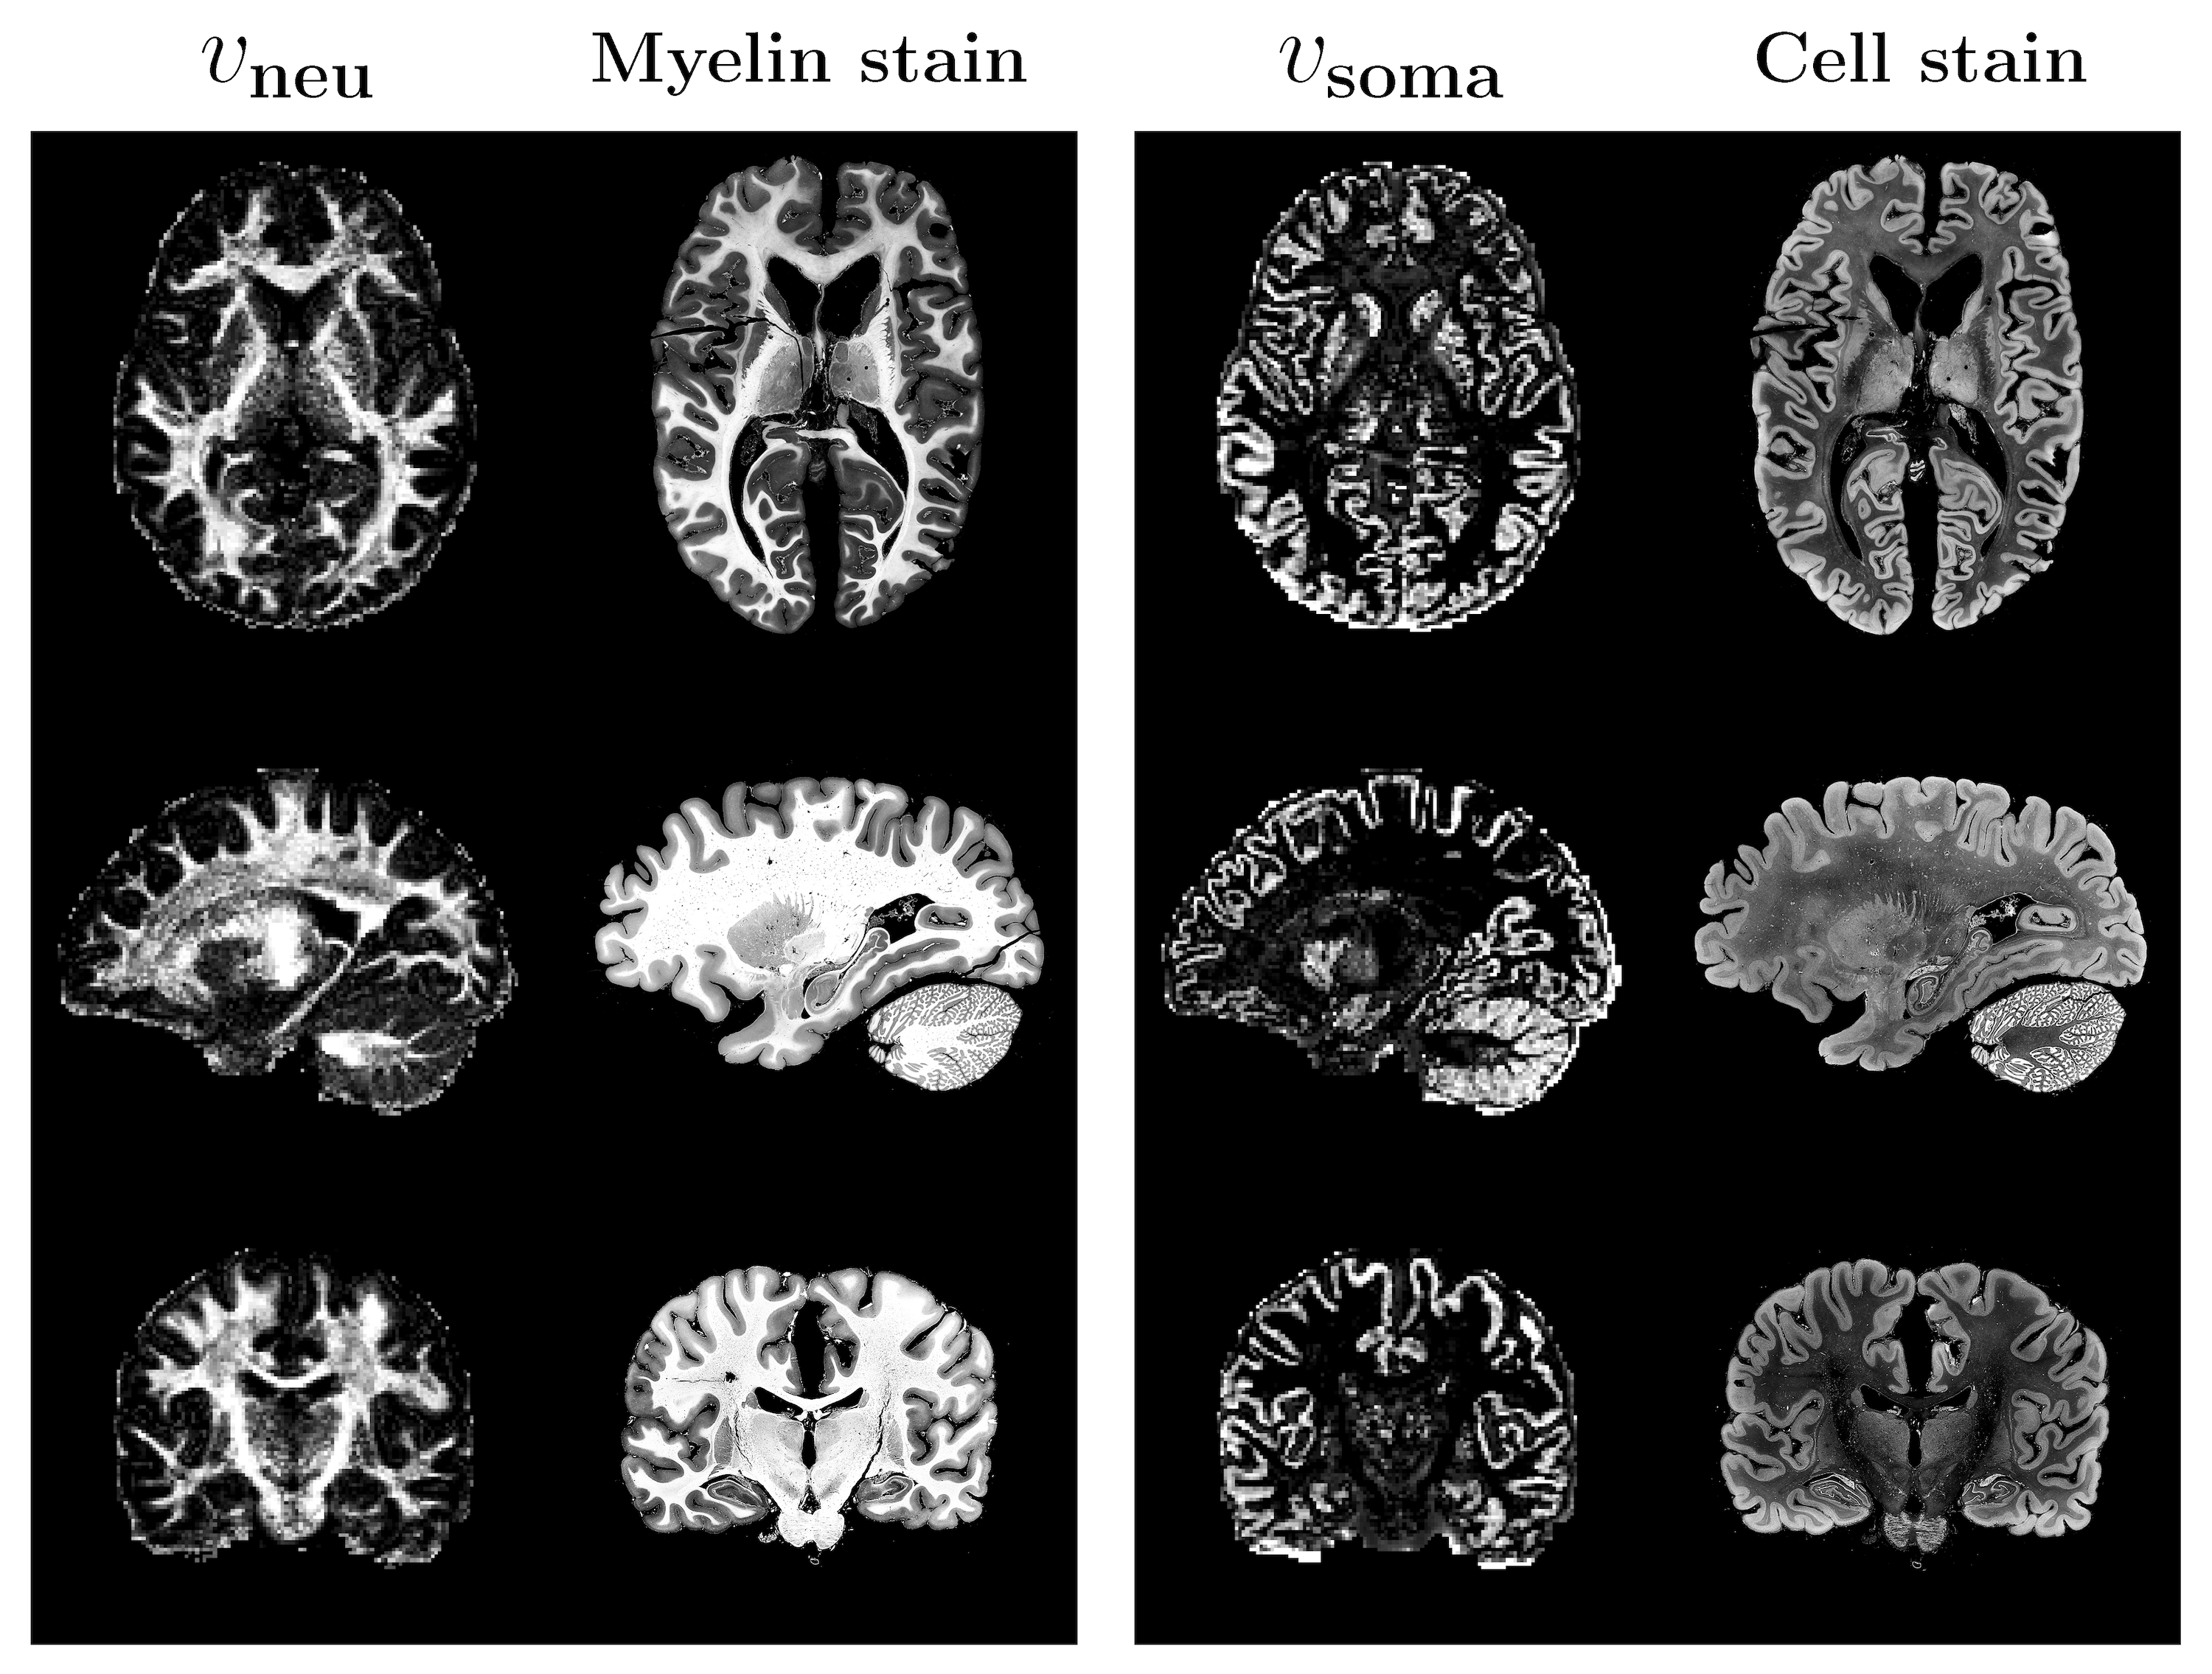
Histological corroboration: Fig. 3 illustrates the similarity between our results and ex-vivo histological images. The intra-neurite volume fraction map is strikingly similar to myelin stain and the intra-soma volume fraction map is similar to cell nuclei stain. These demonstrate that our method provides biologically meaningful contrasts.
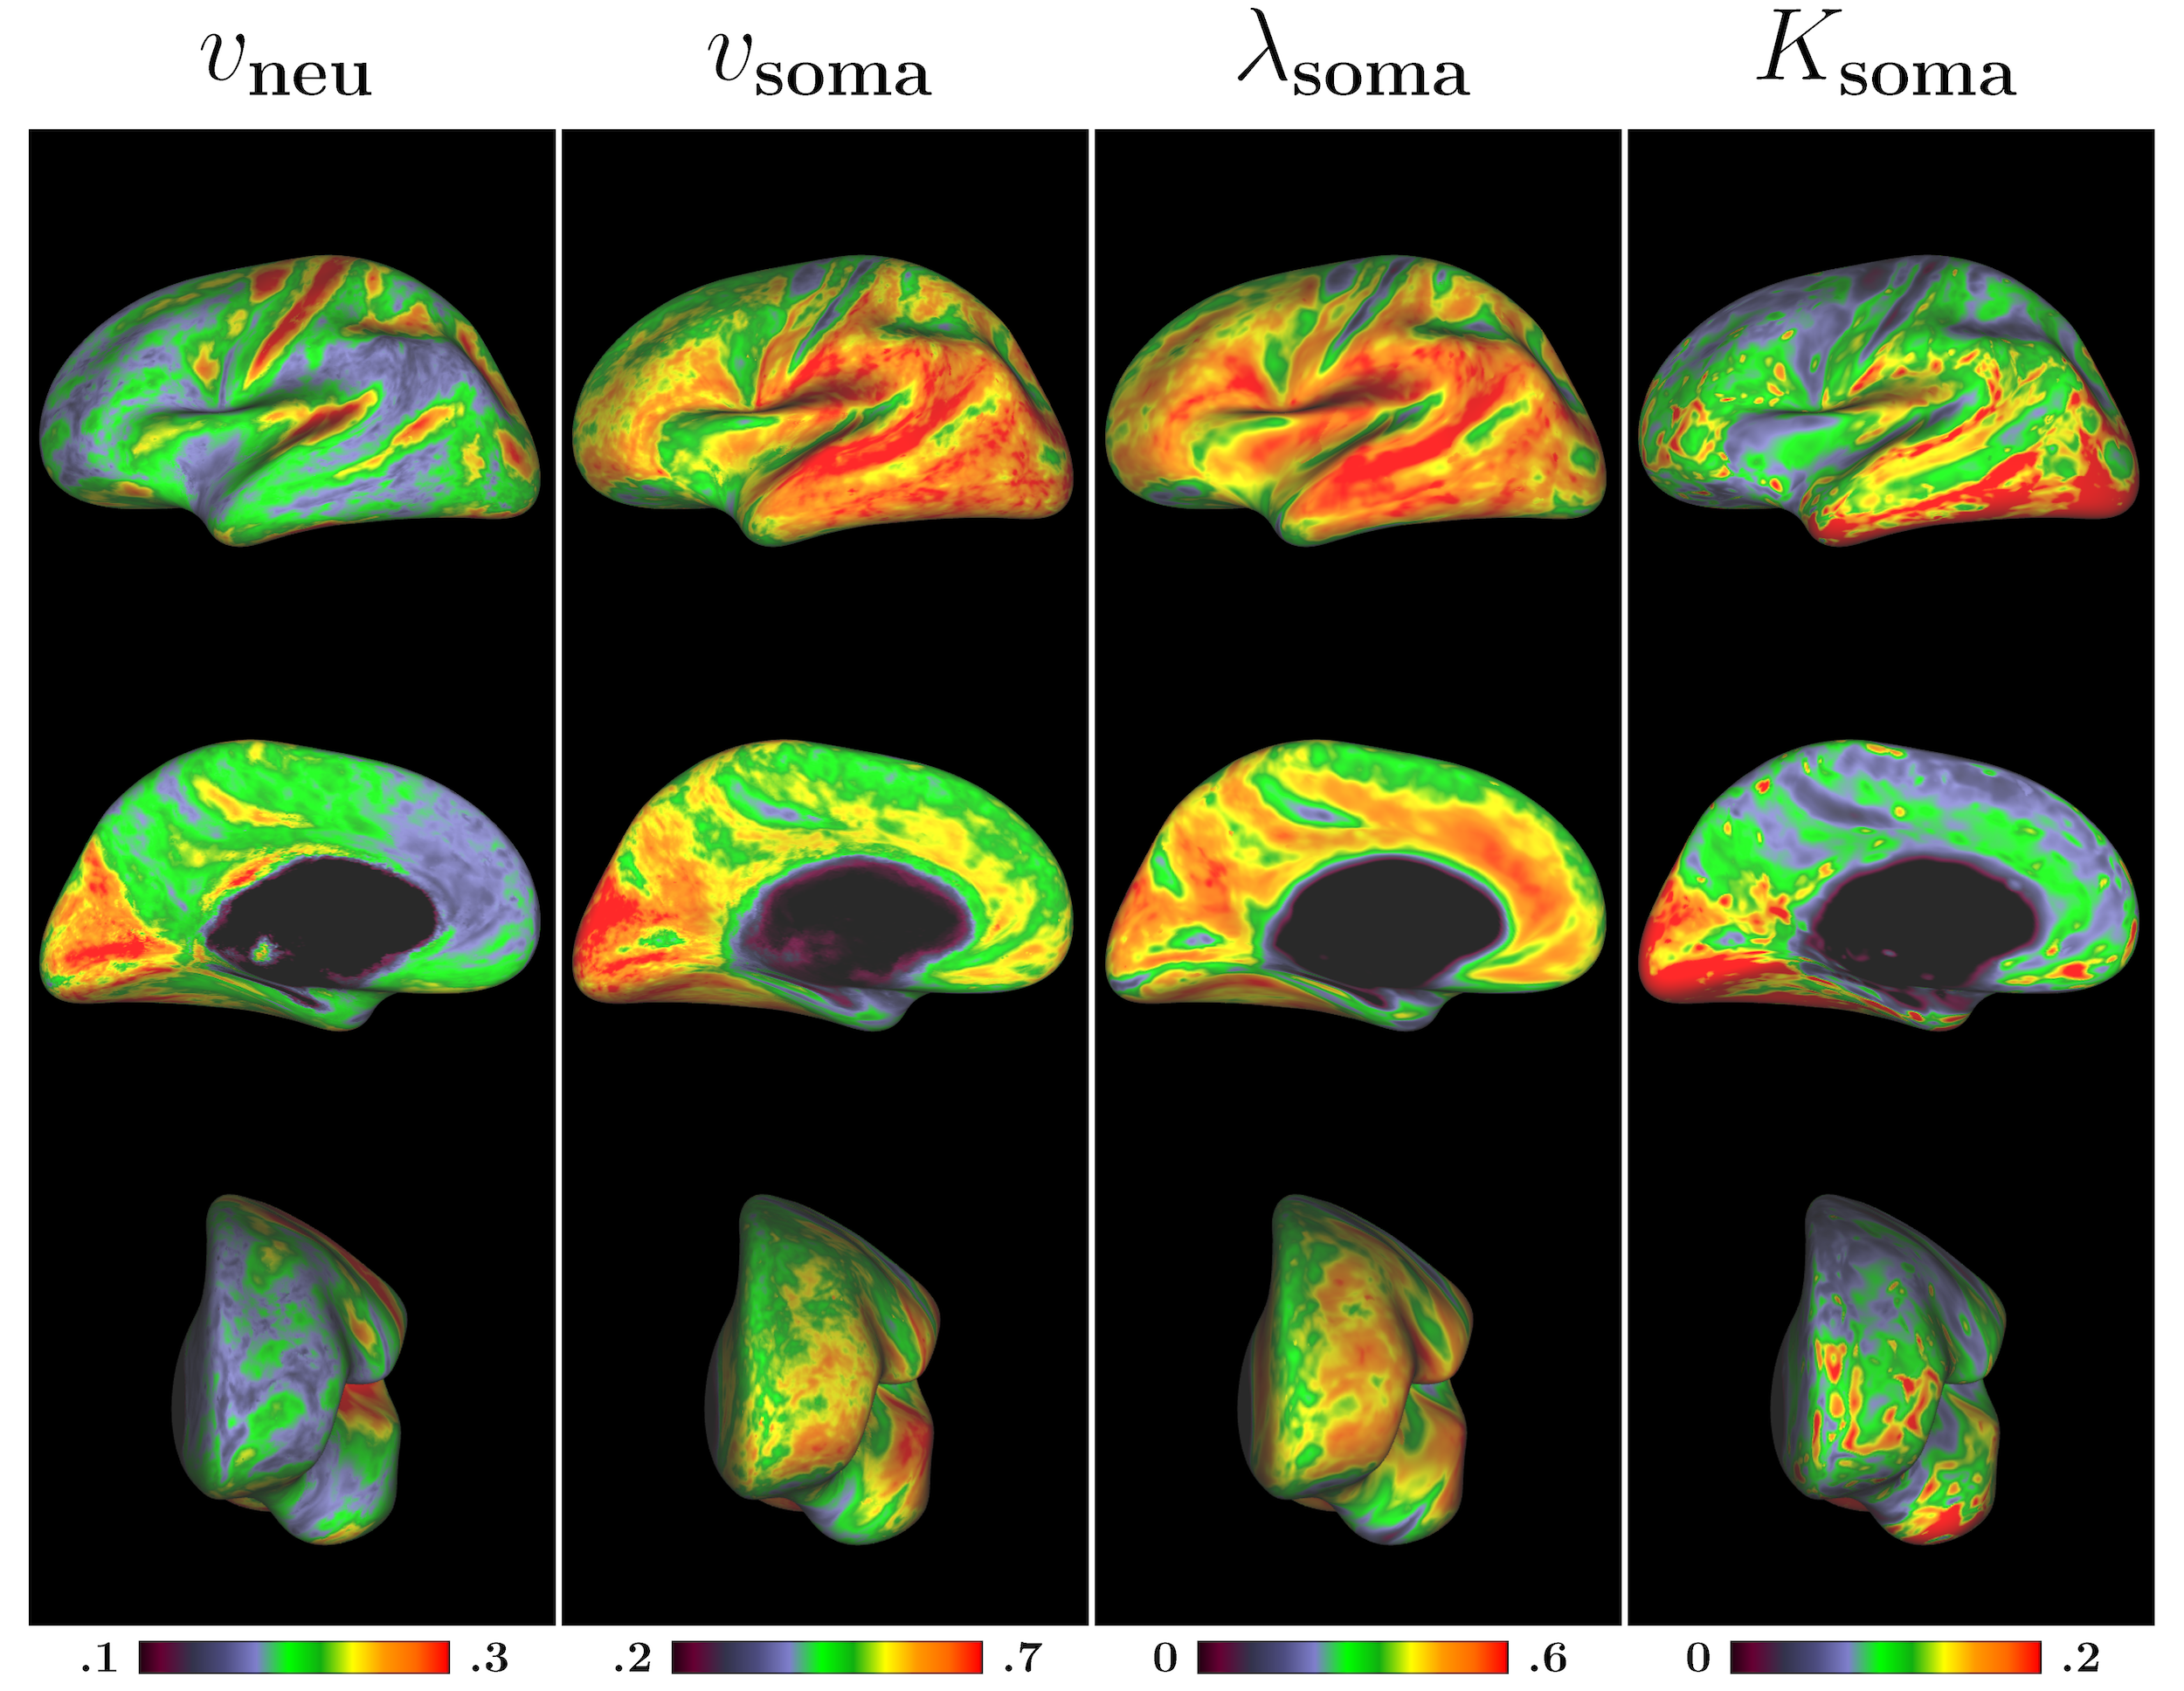
Cortical surface mapping: We mapped the parametric maps onto the cortical surface as described in [9]. Fig. 4 shows average maps of 4 healthy adults. The intra-neurite volume fraction is higher in the motor and somatosensory areas, confirming the pattern observed in [10]. On the other hand, soma related maps reveal distinct patterns, with relatively low values in the motor area, but higher values in the occipital and temporal lobes.
Conclusions
We have presented a method to characterize soma diffusion properties. We have shown that our method produces biologically meaningful contrasts as corroborated by histological data.Acknowledgements
This work was supported in part by NIH grant NS093842.References
1. Palombo, M., Ianus, A., Nunes, D., Guerreri, M., Alexander, D.C., Shemesh, N., Zhang, H.: Sandi: a compartment-based model for non-invasive apparent soma and neurite imaging by diffusion mri. arXiv preprint arXiv:1907.02832 (2019)
2. Huynh, K.M., Xu, T., Wu, Y., Chen, G., Thung, K.H., Wu, H., Lin, W., Shen, D., Yap, P.T., the UNC/UMN Baby Connectome Project Consortium: Probing brain micro-architecture by orientation distribution invariant identification of diffusion compartments. In: International Conference on Medical Image Computing and Computer-Assisted Intervention, Springer (2019) 547–555
3. Huynh, K.M., Xu, T., Wu, Y., Thung, K.H., Chen, G., Lin, W., Shen, D., Yap, P.T.: Characterizing non-gaussian diffusion in heterogeneously oriented tissue microenvironments. In: International Conference on Medical Image Computing and Computer-Assisted Intervention, Springer (2019) 556–563
4. Andersson, J.L., Sotiropoulos, S.N.: An integrated approach to correction for off- resonance effects and subject movement in diffusion mr imaging. Neuroimage 125 (2016) 1063–1078
5. Huynh, K.M., Xu, T., Wu, Y., Chen, G., Wang, X., Thung, K.H., Wu, H., Lin, W., Shen, D., Yap, P.T.: Probing tissue microarchitecture of the baby brain via spherical mean spectrum imaging. arXiv preprint arXiv:1908.04483 (2019)
6. Kaden, E., Kelm, N.D., Carson, R.P., Does, M.D., Alexander, D.C.: Multi- compartment microscopic diffusion imaging. NeuroImage 139 (2016) 346–359
7. Mori, S., Oishi, K., Faria, A.V.: White matter atlases based on diffusion tensor imaging. Current opinion in neurology 22(4) (2009) 362
8. Lampinen, B., Szczepankiewicz, F., Nov ́en, M., van Westen, D., Hansson, O., En- glund, E., Martensson, J., Westin, C.F., Nilsson, M.: Searching for the neurite density with diffusion mri: Challenges for biophysical modeling. Human brain mapping 40(8) (2019) 2529–2545
9. Glasser, M.F., Van Essen, D.C.: Mapping human cortical areas in vivo based on myelin content as revealed by t1-and t2-weighted mri. Journal of Neuroscience 31(32) (2011) 11597–11616
10. Fukutomi, H., Glasser, M.F., Zhang, H., Autio, J.A., Coalson, T.S., Okada, T., Togashi, K., Van Essen, D.C., Hayashi, T.: Neurite imaging reveals microstructural variations in human cerebral cortical gray matter. Neuroimage 182 (2018) 488–499
Figures