4417
Application of MAP diffusion modelin differential diagnosis between high-grade glioma and single brain metastatic tumor
BO LI1, YANG GAO1, SHAOYU WANG2, YAN XU2, GUANG YANG3, and HUAPENG ZHANG2
1Department of Radiology, The Affiliated Hospital of Inner Mongolia Medical University, Hohhot, China, 2MR Sicentific Marketing, Siemens Healthineers, Shanghai, China, 3Shanghai Key Laboratory of Magnetic Resonance, East China Normal University, Shanghai, China
1Department of Radiology, The Affiliated Hospital of Inner Mongolia Medical University, Hohhot, China, 2MR Sicentific Marketing, Siemens Healthineers, Shanghai, China, 3Shanghai Key Laboratory of Magnetic Resonance, East China Normal University, Shanghai, China
Synopsis
This study aimed at using mean-apparent-propagator (MAP) diffusion model in differential diagnosis of high-grade glioma and single brain metastatic tumor.the findings show that multiple parameters quantified by DSI quantitative model MAP MRI, especially MSD and QIV has high applicatical value and provides more information for preoperative diagnosis of patients.
Objective
High grade glioma and brain metastases were the most common brain tumor and difficult to distinguish in routine clinical work1. Therefore, we used a newly proposed mean-apparent-propagator (MAP)-MRI diffusion model based on the diffusion spectrum imaging (DSI) technique to explore its value in differential diagnosis2.Methods
20 patients with high-grade glioma (mean age, 45.8 ± 15.5 years) and 16 patients with single brain metastases (mean age, 59 ±15.8 years ) were recruited before operation, and all patients underwent MRI examination on a 3T MR scanner(MAGNETOM Skyra, Siemens Healthcare, Erlangen, Germany) with a 20 channel head coil. DSI and enhanced T1 mprage sequences were scanned and the parameters were as follows: DSI: TR/TE=7000/107ms, FOV=260mm X 260mm, GRAPPA (PE) = 2, Slice thickness=3.0mm, voxel size= 2.2x 2.2x 3.0mm3, 50 Slices, maximum b value = 3000s/mm2,TA = 15min40s; T1 mprage: TR/TE = 2300/2.32 ms, FOV = 260mm X 260mm, GRAPPA (PE) = 2, Slice thickness = 0.9mm, voxel size = 0.9X0.9X0.9mm3, TA = 5min21s. The MAP-MRI parameters were calculated using an in-house developed tool with Python, called NeuDiLab, which is based on an open-resource tool DIPY (Diffusion Imaging In Python, http://nipy.org/dipy). The MAP-MRI parameters included the return to the origin probability (RTOP), the return to the axis probability (RTAP), and the return to the plane probability (RTPP), the mean square displacement (MSD) q-space inverse variance (QIV), the non-Gaussianity (NG), non-gaussian parallel (NGAx) and non-gaussian vertical (NGrad). The Mricron software was used to delineate ROI in tumor parenchyma and contralateral normal white matter, and the ROI mean was calculated (Figure1). The independent sample t-test and paired sample t-test were used to analyze the statistical differences.Results
The parameters MSD, NG, QIV and RTAP showed significant differences between single brain metastatic tumor and the contralateral normal area of white matter (p<0.05) (Table 1), while MSD showed significant difference between high-grade glioma lesion and the contralateral normal white matter (p<0.05) (Table 2). Between the high-grade glioma and single brain metastatic tumor, MSD, NG, NGAX, QIV and RTAP showed significant difference (p<0.05) (Table 3, Figure2).Discussion
MSD reflects the mean azimuth shift of water molecules. Considering the infiltrative growth of glioma along the brain white matter nerve fiber bundles and blood vessels, high grade glioma contains not only angiogenic oedema but also tumor cell invasion3. But brain metastasis tumor surrounding edema is simply from angiogenic oedema. Therefore, MSD values in isolation of brain metastasis were higher than those in high grade glioma, and the difference was statistically significant (p < 0.05). QIV is sensitive to the complexity of the organizational components. The growth source of high-grade glioma cells is only glial cell proliferation, while the growth source of brain metastatic tumor cells may be cancer cells in tissues of the whole body, such as lung cancer and breast cancer. Therefore, the QIV value of isolated brain metastasis is higher than that of high-grade glioma. Because the sample size of the isolated brain metastases group is small, it is not possible to distinguish whether there is a statistical difference in QIV value of brain metastases of different single-tissue sources. Therefore, a larger sample size is needed. By screening out more favorable parameters, potential biomarker could be found for differential diagnosis between high-grade glioma lesions and isolated brain metastasis lesions, and also treatment response evaluation.Conclusion
The parameters from MAP-MRI based on DSI sequence may provide useful information about differential diagnosis of high-grade glioma and single brain metastatic tumor.Acknowledgements
No acknowledgement found.References
- Lu S , Ahn D , Johnson G , et al. Peritumoral diffusion tensor imaging of high-grade gliomas and metastatic brain tumors[J]. American Journal of Neuroradiology, 2003, 24(5):937-941.
- Avram A V , Sarlls J E , Barnett A S , et al. Clinical feasibility of using mean apparent propagator (MAP) MRI to characterize brain tissue microstructure.[J]. Neuroimage, 2016, 127(3):422-434.
- Pierpaoli C , Barnett A , Pajevic S , et al. Water Diffusion Changes in Wallerian Degeneration and Their Dependence on White Matter Architecture[J]. Neuroimage, 2001, 13(6):1174-1185.
Figures

Figure 1. A1-A10 and B1-B10 show neuroanatomical variation of MAP-MRI andconventional MRI represent casesof high-grade gliomas and metastases confirmed by pathology.
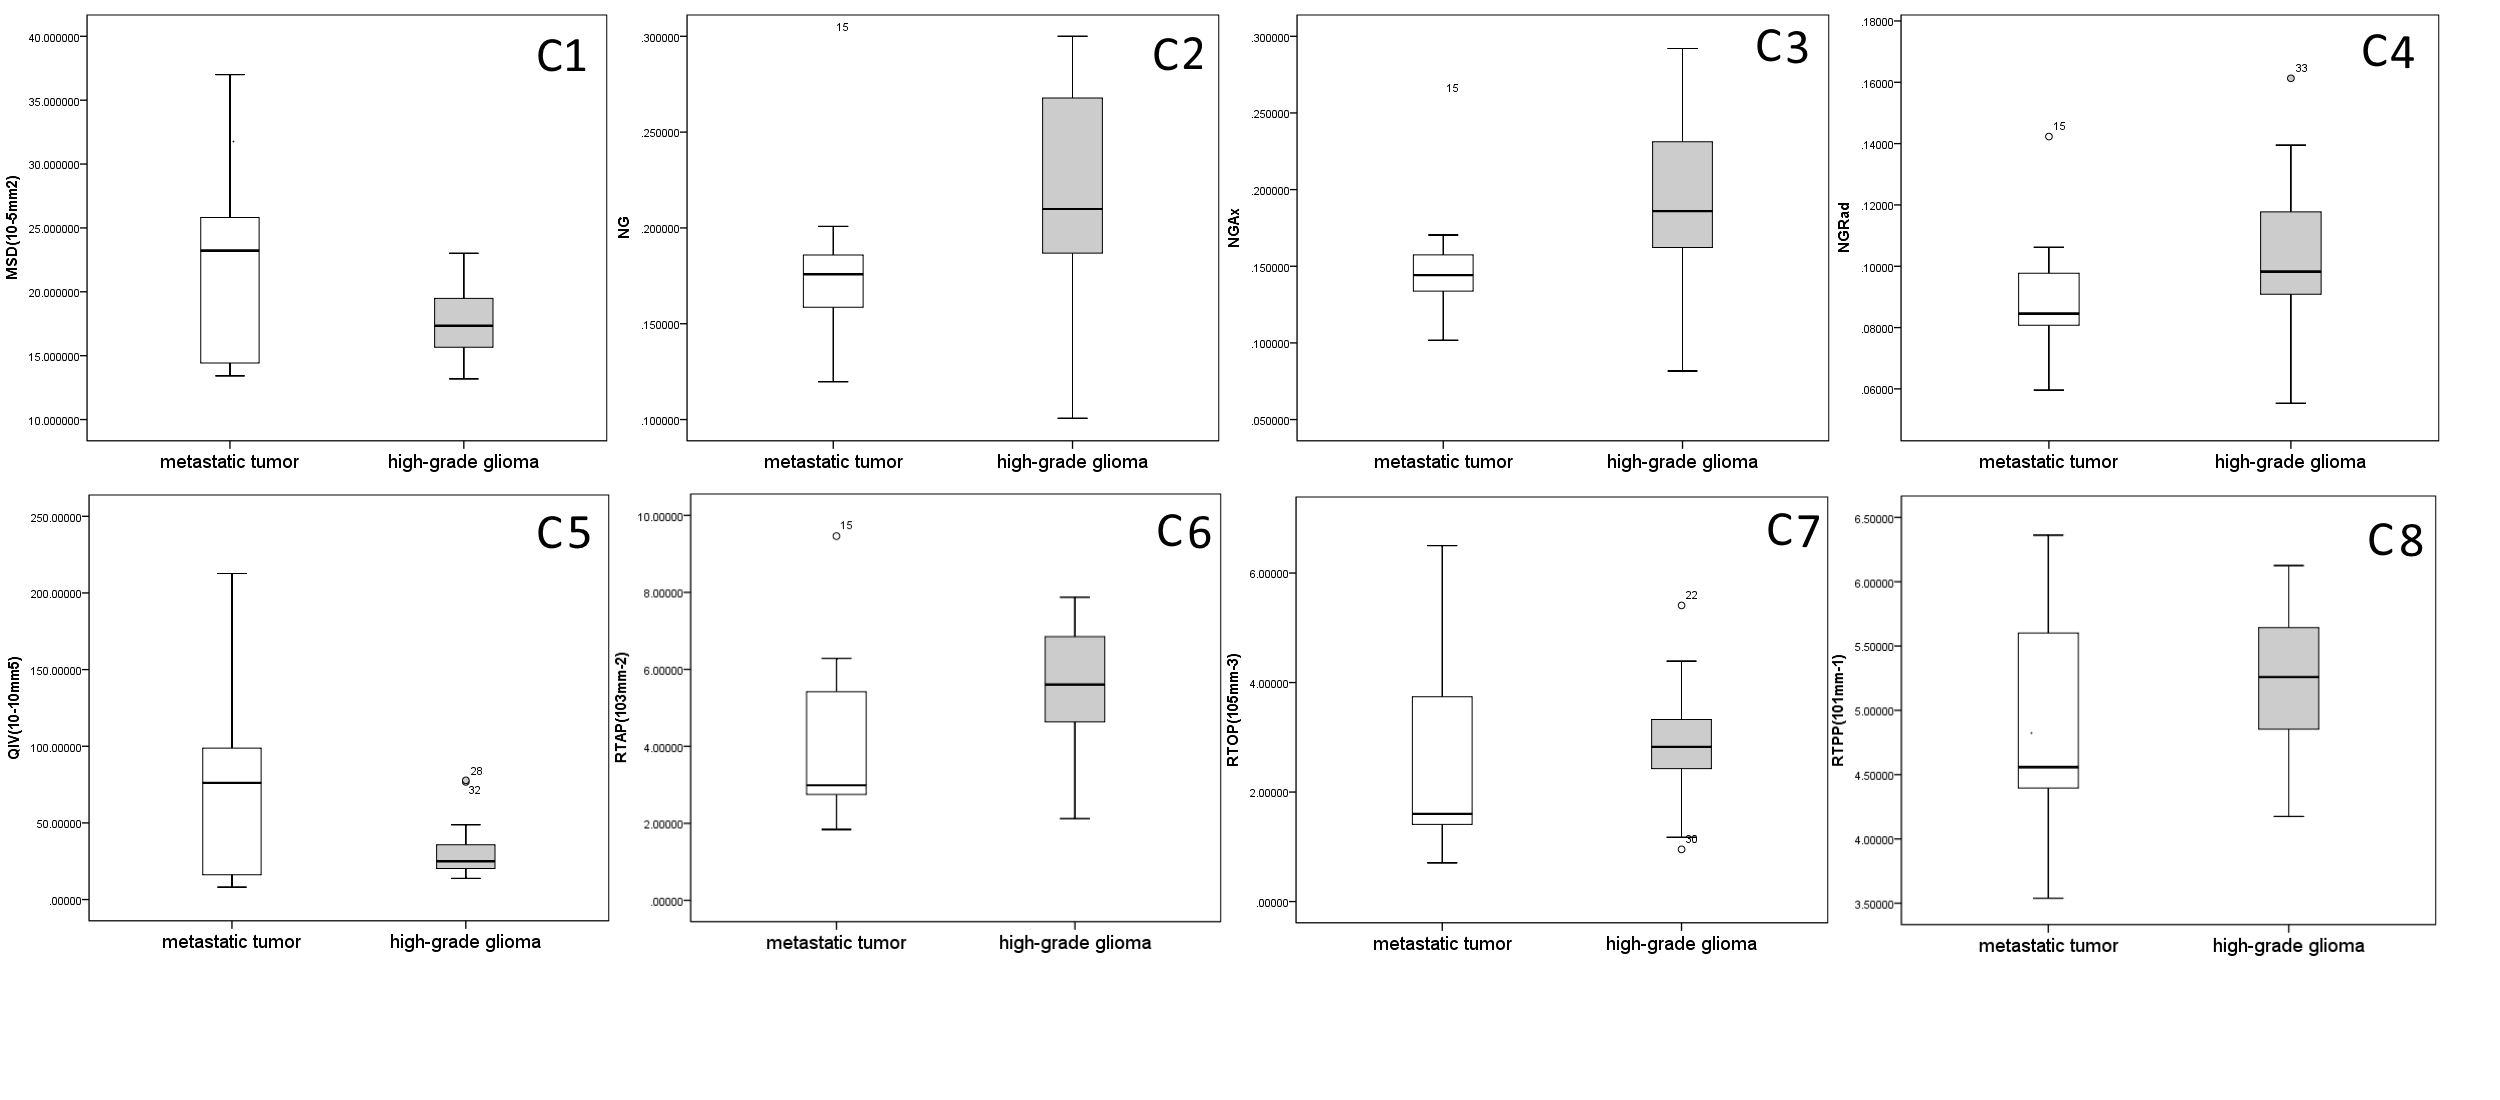
Figure 2 Boxplot of C1-C8 shows the distribution of metastatic tumors and high-grade glioma data about MAP-MRI parameters.
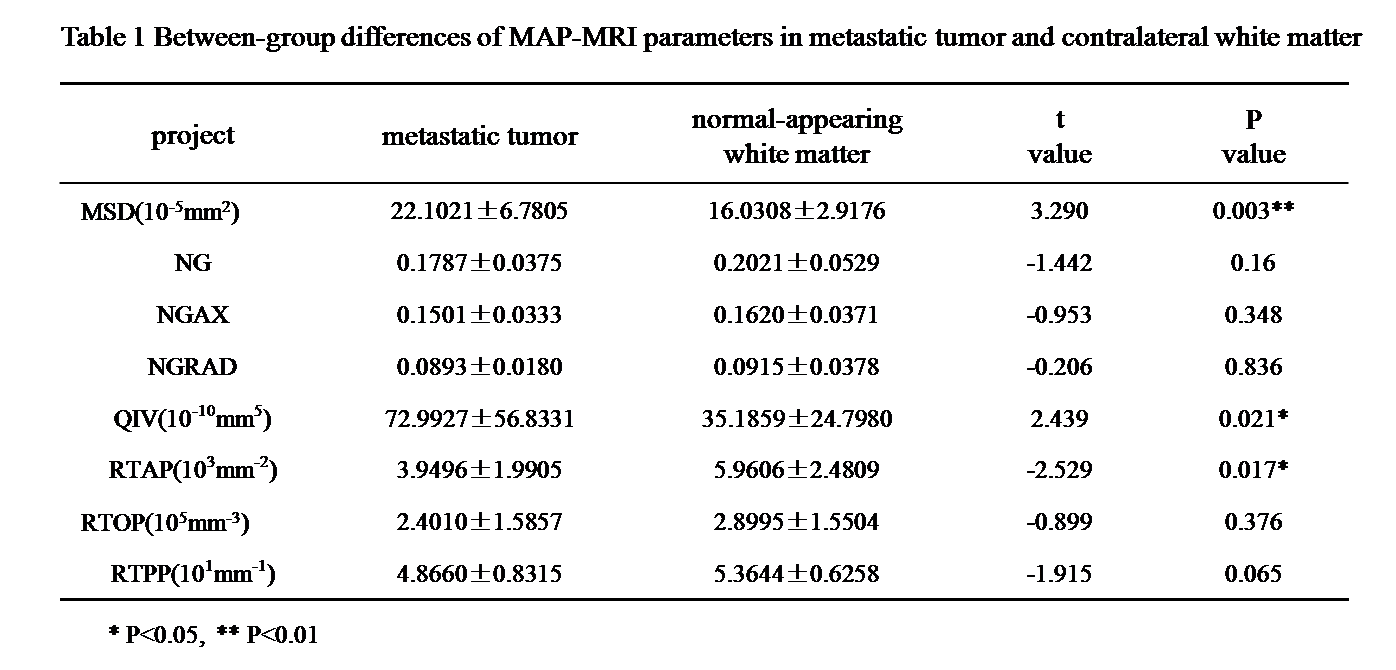
Table1. Between-group differences of MAP-MRI parameters inmetastatic tumorand contralateralwhite matter.

Table2
Between-group differences of MAP-MRI parameters in high-grade gliomaand
contralateral white matter.
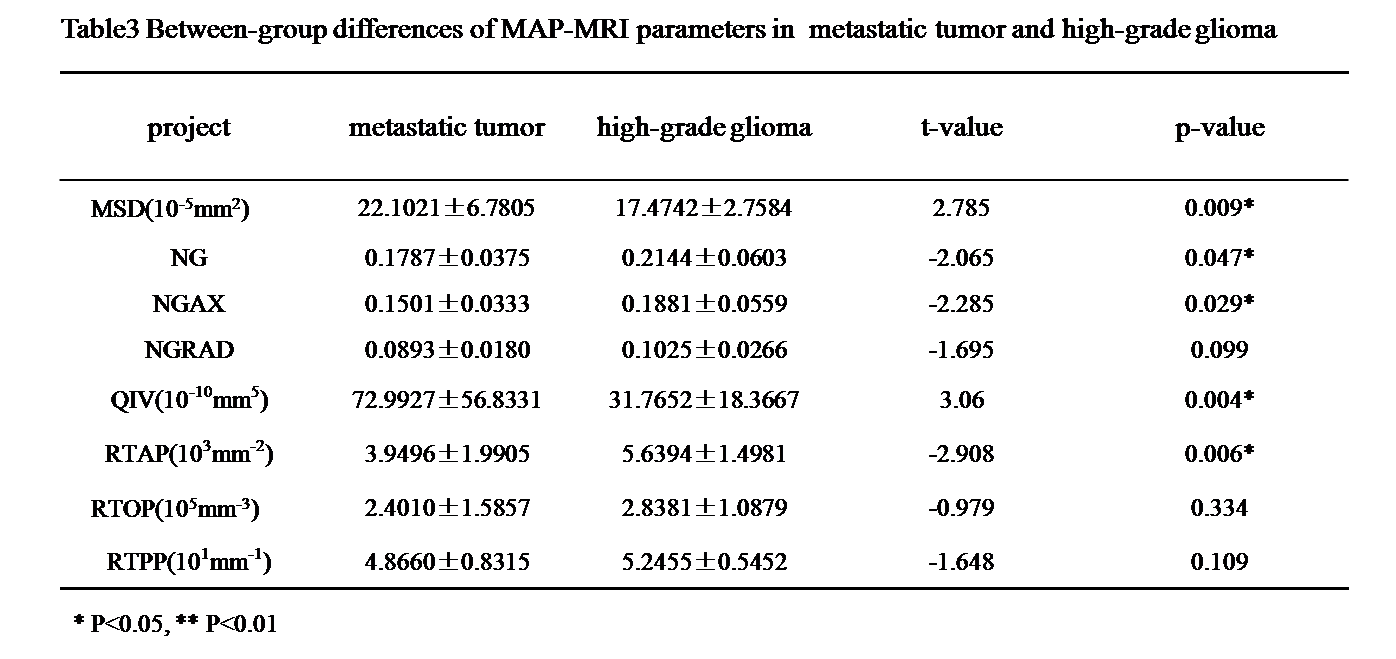
Table3
Between-group differences of MAP-MRI parameters inmetastatic tumor andhigh-grade
glioma.