4414
Anomalous diffusion MRI model parameters vary in the human corpus callosum sub-regions with age1School of Mathematical Sciences, Queensland University of Technology, Brisbane, Australia, 2Centre for Advanced Imaging, University of Queensland, Brisbane, Australia
Synopsis
Diffusion MRI measures of the human brain provide key insight into microstructural variations across individuals and into the impact of central nervous system diseases and disorders. One approach to extract information from diffusion signals has been to use biologically relevant analytical models to link millimetre scale diffusion MRI measures with microscale influences. The other approach has been to represent diffusion as an anomalous process, and infer information from the different anomalous diffusion equation parameters. Here, we show how parameters of three established anomalous diffusion equations change with age, in a microstructurally complex tissue, the human corpus callosum.
Introduction
Diffusion MRI (dMRI) allows measurements of diffusion in tissue. Various classical mathematical models have been developed to link voxel-level measurements (mm scale) with changes at the microscale. For example, variations in axon radius1, and neurite orientation and density2 have been inferred from dMRI data and associated mathematical models. Whilst these methods have been derived based on the classical diffusion process, models capturing the anomalous nature of diffusion in tissue have been proposed as well.Traditionally, the diffusion signal was assumed to decay mono-exponentially with b-value. However, studies have shown the diffusion signal as a function of b-value to deviate from mono-exponential decay3. The existing various anomalous diffusion models were developed in view of the hindered and restricted nature of diffusion in biological tissue4-10. Anomalous diffusion models are able to better fit the dMRI signal than the mono-exponential model, and potentially provide a link to tissue microstructure variations through anomalous diffusion model parameters11-15. Here, we provide the first evaluation of how parameters of three different anomalous diffusion models vary in the human corpus callosum as a function of age.
Methods
Anomalous diffusion modelsHere we limited the study to the fixed diffusion time regime for dMRI data. We considered three different anomalous diffusion models, namely the super-diffusion (a.k.a. stretched exponential model3), sub-diffusion16,17 and continuous time random walk13 (CTRW) models:
$$SUP: S/S_0 = \exp\left(-(bD)^\alpha\right),~~~ 0<\alpha\leq1, $$
$$SUB: S/S_0 = E_\beta(-bD), ~~~ 0<\beta\leq 1, $$
$$CTRW: S/S_0 = E_\beta(-(bD)^\alpha), ~~~ 0<\alpha,\beta\leq 1.$$
where S0 is the signal at b = 0, and parameters α and β are not interchangeably interpretable across the different models, and the Mittag-Leffler function is given as $$$ E_{\beta}(z)=\sum^\infty_{k=0}\frac{z^k}{\Gamma(1+\beta k)}$$$ where $$$\Gamma$$$ is the Gamma function and $$$E_1(z) = \exp(z)$$$.
Diffusion-weighted MRI data
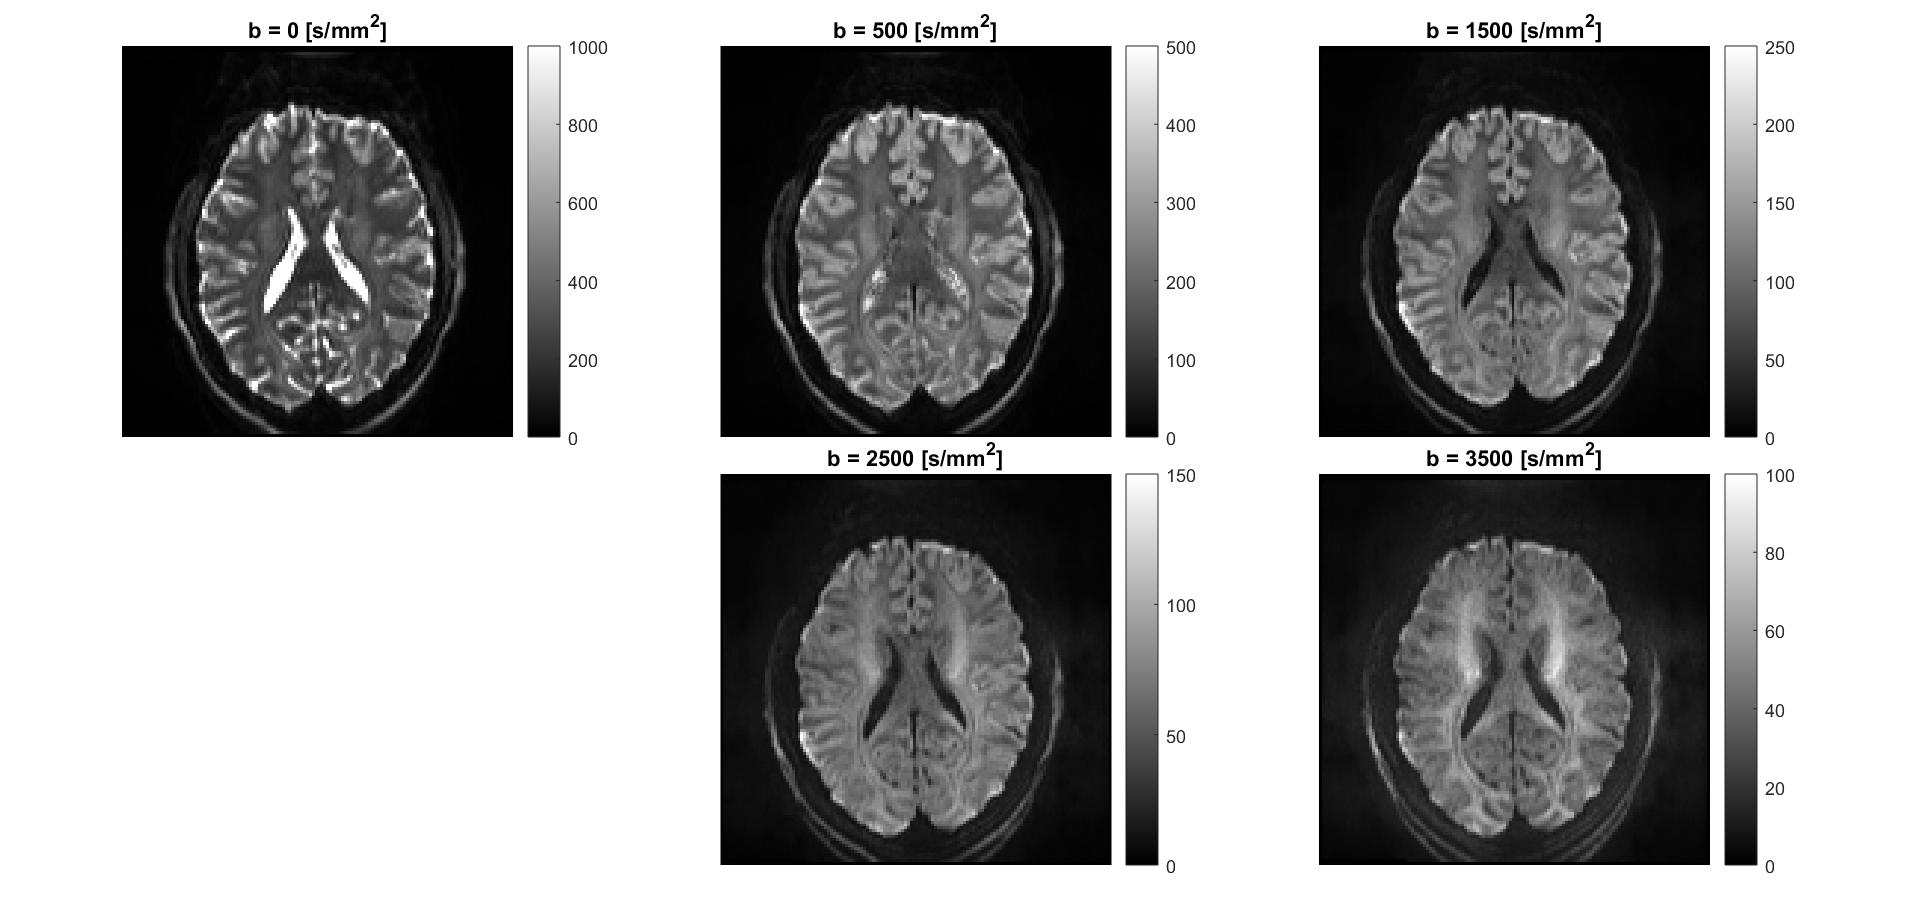
The study was approved by the human ethics committee of the University of Queensland. We recruited 30 healthy participants aged 19 to 67 (42$$$\pm$$$13.5) with mostly 2-3 year age gaps and a maximum of a 7 year age gap (37-44), and half of the participants were female. The dMRI data was collected using a 7T Siemens Magnetom research MRI scanner with the following acquisition parameters: TE = 73 ms, isotropic resolution of 1.6 mm3, fixed Δ = 31.9 ms and δ = 21.6 ms. By varying the gradient strength, multiple b-values were acquired (b = 0, b = 500, b = 1500, b = 2500, and b = 3500 s/mm2). With increasing b-value increasing number of diffusion directions were acquired to maintain SNR (total of 126 acquisitions including six b = 0 datasets; directions at each b-value were chosen based on the electrostatic model18,19). dMRI data were corrected for motion and eddy currents using MRtrix3, and trace-weighted images were computed at each b-value (i.e. geometric mean across directions, see Figure 1).
Analysis
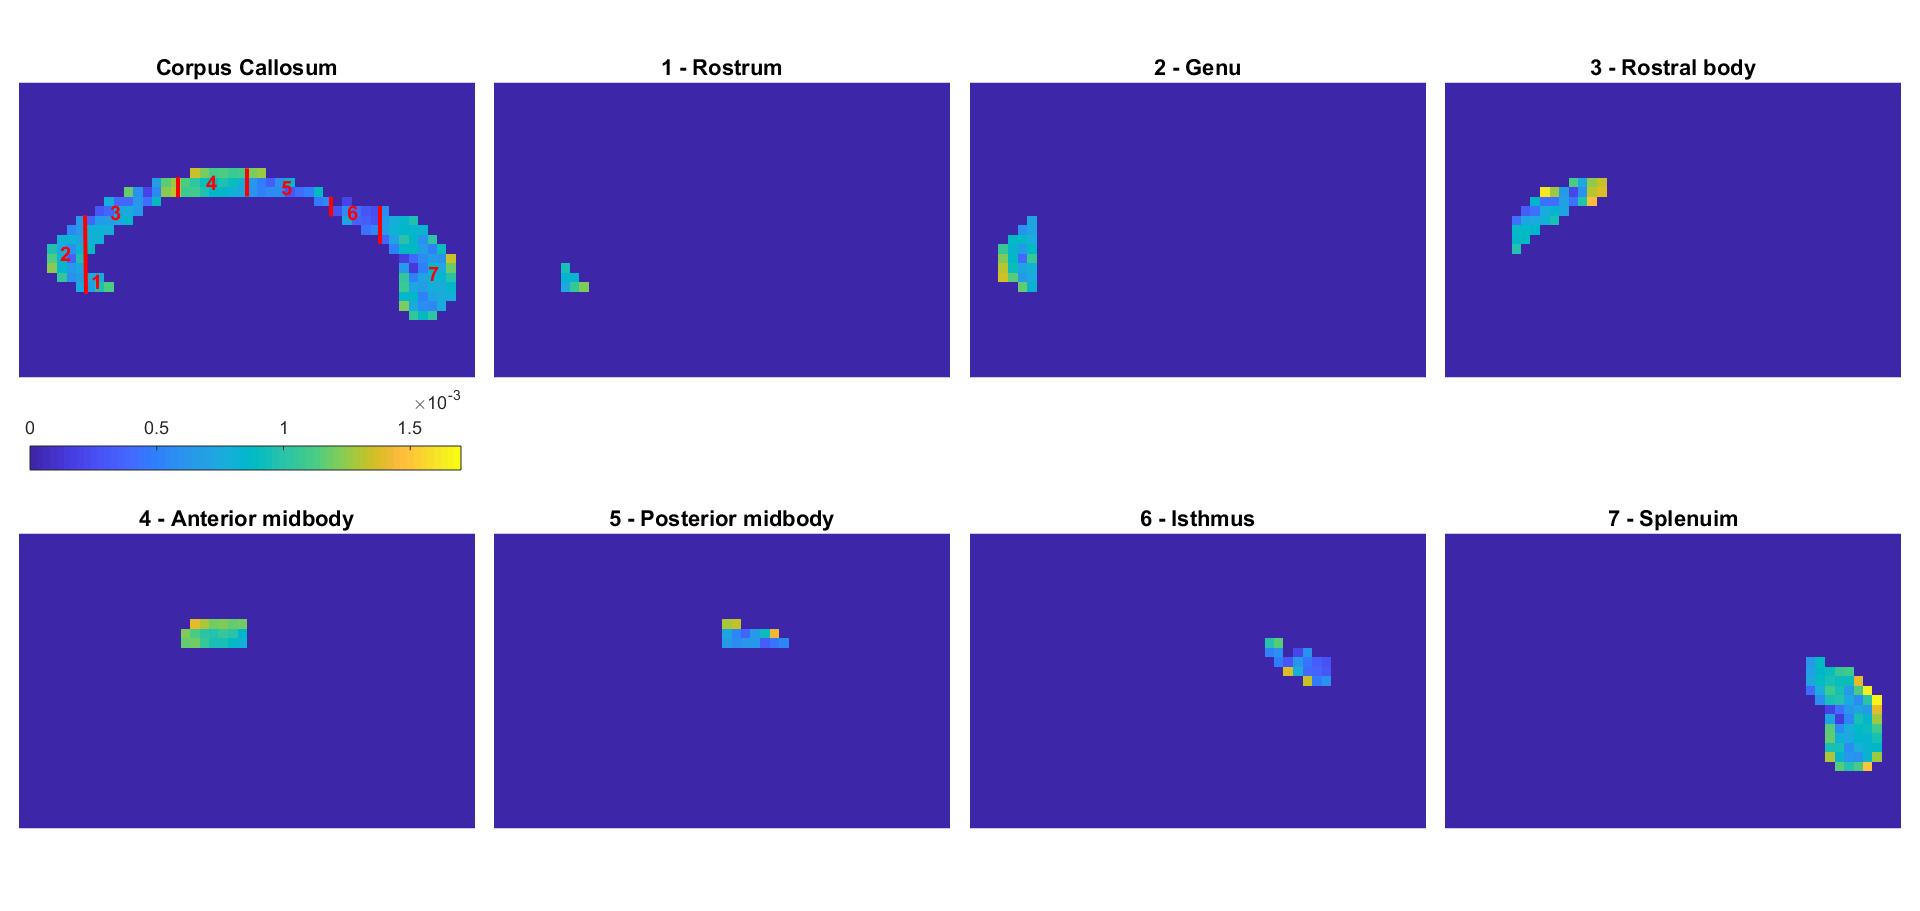
In each human brain the corpus callosum was segmented manually near the mid-sagittal plane using MIPAV. The template described by Witelson20 was then used to manually sub-segment the corpus callosum into seven sub-regions (1 – rostrum, 2 – genu, 3 – rostral body, 4 – anterior midbody, 5 – posterior midbody, 6 – isthmus, 7- splenium). Each anomalous diffusion model was fitted to the multiple b-value dMRI data in a voxel-by-voxel manner using MATLAB's lsqcurvefit (note: D was estimated first using b-value $$$\leq$$$1,500 s/mm2 data, after which $$$\alpha_{sup}$$$, $$$\beta_{sub}$$$ and ($$$\alpha_{ctrw}, \beta_{ctrw}$$$) were fitted using all of the data with fixed D). Using the binary masks created in MIPAV, parameter values for each sub-region were extracted and averaged for that sub-region. The MATLAB functions fitlm and predict were used to perform linear regression of the mean parameter values vs age for each sub-region and to find the 95% confidence interval of the parameter values.
Results
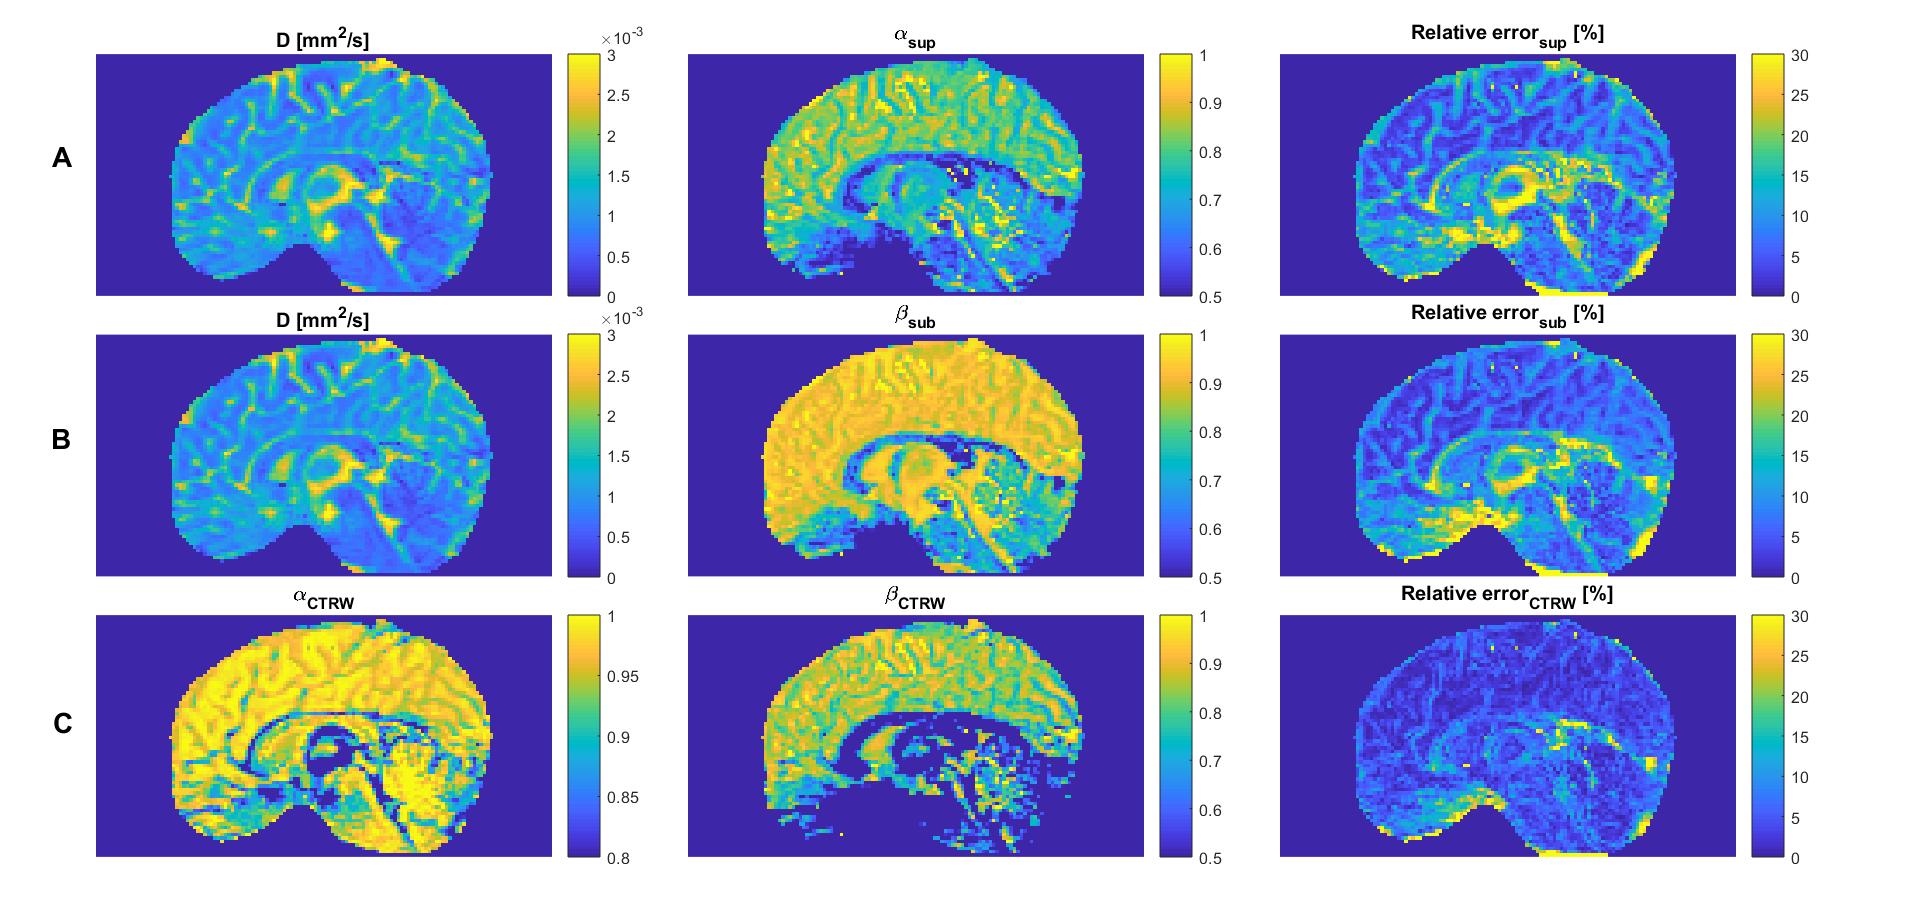
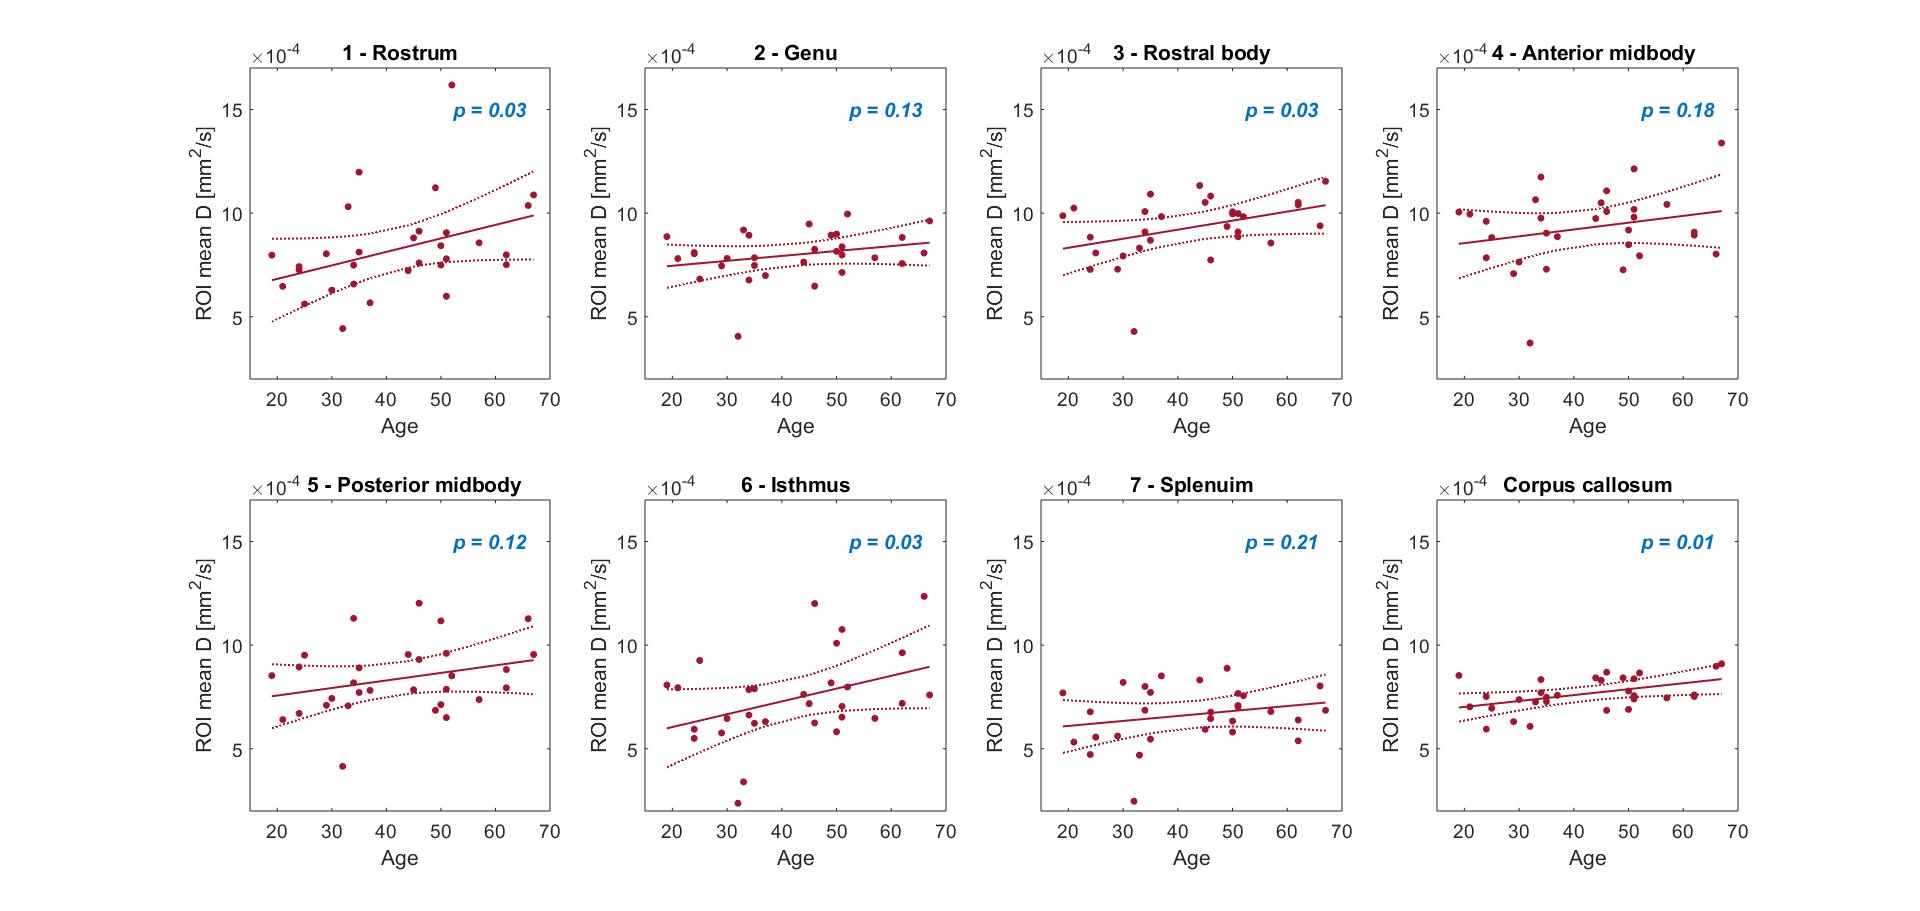
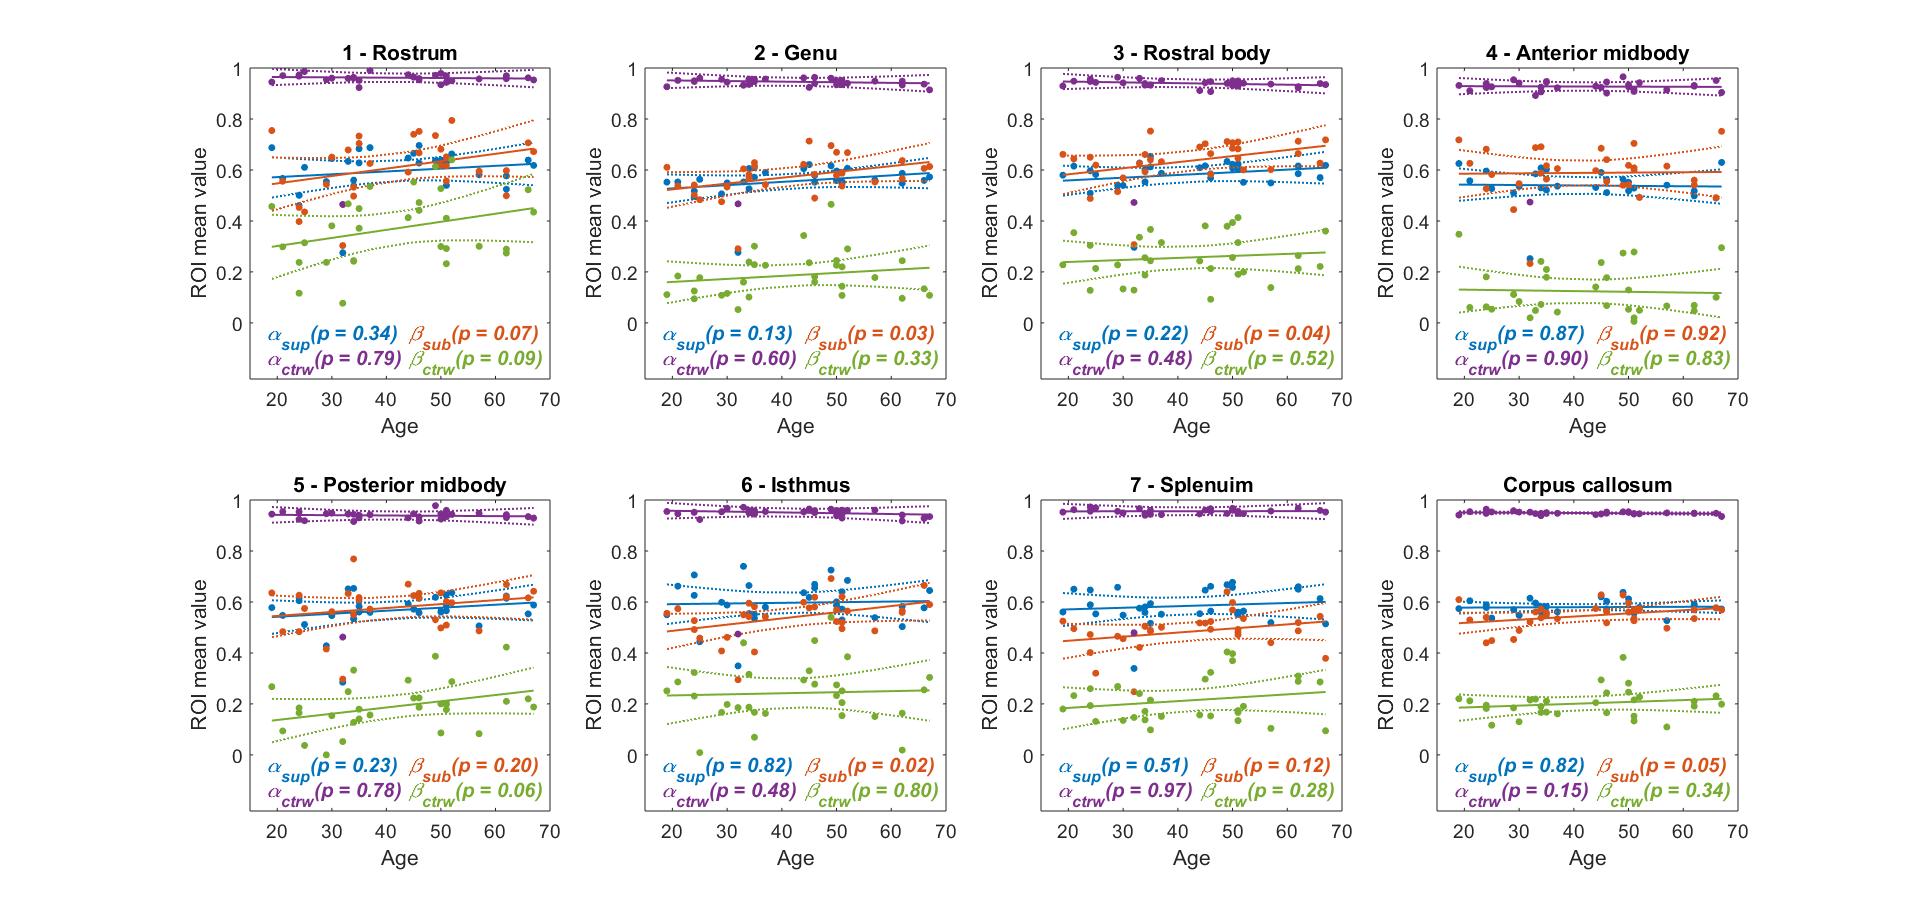
As an example, Figure 2 provides the parameter maps and relative fitting errors obtained for a 19-year-old male participant. Figure 3 shows in the same participant the application of the corpus callosum mask and the seven sub-regions masks to the diffusion coefficient parameter. Figure 4 depicts the trend in the computed mean diffusivity D as a function of age in the entire mid-sagittal section of the corpus callosum, and the seven sub-regions. Figure 5 provides the age-dependent trend in the mean α and β parameters over age, as relevant, for the various models.Discussion
A significant upward trend with age (p < 0.05) was found for the mean diffusivity D in the rostrum, rostral body and isthmus sub-regions, and the trend was also significant for the entire corpus callosum (Figure 4). There was no significant trend found for the mean $$$\alpha_{sup},~\alpha_{CTRW}$$$, and $$$\beta_{CTRW}$$$, whereas the mean $$$\beta_{sub}$$$ had a significant upward trend in the genu, rostral body and isthmus sub-regions and the entire corpus callosum (Figure 5).Conclusion
We evaluated how anomalous diffusion model parameters vary as a function of age in the human corpus callosum. We found that sub-diffusion model parameter $$$\beta_{sub}$$$ show significant upward trends in corpus callosum and three sub-regions. No significant trends were found in super-diffusion and CTRW model parameters. Moreover, diffusivity D and $$$\beta_{sub}$$$ show significant trends in different sub-regions, suggesting that D and $$$\beta_{sub}$$$ are sensitive to different age-related tissue microstructural changes in the corpus callosum.Acknowledgements
Dr Yang is funded by the Australian Research Council Discovery Early Career Researcher Award (DE150101842).References
1. Assaf Y, Blumenfeld‐Katzir T, Yovel Y, Basser PJ. AxCaliber: a method for measuring axon diameter distribution from diffusion MRI. Magnetic Resonance in Medicine: An Official Journal of the International Society for Magnetic Resonance in Medicine. 2008;59(6):1347-54.
2. Zhang H, Schneider T, Wheeler-Kingshott CA, Alexander DC. NODDI: practical in vivo neurite orientation dispersion and density imaging of the human brain. Neuroimage. 2012;61(4):1000-16.
3. Bennett KM, Schmainda KM, Bennett R, Rowe DB, Lu H, Hyde JS. Characterization of continuously distributed cortical water diffusion rates with a stretched‐exponential model. Magnetic Resonance in Medicine: An Official Journal of the International Society for Magnetic Resonance in Medicine. 2003;50(4):727-34.
4. Hall MG, Barrick TR. From diffusion‐weighted MRI to anomalous diffusion imaging. Magnetic Resonance in Medicine: An Official Journal of the International Society for Magnetic Resonance in Medicine. 2008 Mar;59(3):447-55.
5. Zhou XJ, Gao Q, Abdullah O, Magin RL. Studies of anomalous diffusion in the human brain using fractional order calculus. Magnetic resonance in medicine. 2010 Mar;63(3):562-9.
6. Magin RL, Ingo C, Colon-Perez L, Triplett W, Mareci TH. Characterization of anomalous diffusion in porous biological tissues using fractional order derivatives and entropy. Microporous and Mesoporous Materials. 2013 Sep 15;178:39-43.
7. Fan Y, Gao JH. Fractional motion model for characterization of anomalous diffusion from NMR signals. Physical Review E. 2015 Jul 6;92(1):012707.
8. Capuani S, Palombo M, Gabrielli A, Orlandi A, Maraviglia B, Pastore FS. Spatio-temporal anomalous diffusion imaging: results in controlled phantoms and in excised human meningiomas. Magnetic resonance imaging. 2013 Apr 1;31(3):359-65.
9. Palombo M, Gabrielli A, De Santis S, Cametti C, Ruocco G, Capuani S. Spatio-temporal anomalous diffusion in heterogeneous media by nuclear magnetic resonance. The Journal of chemical physics. 2011 Jul 21;135(3):034504.
10. Karaman MM, Zhou XJ. A fractional motion diffusion model for a twice‐refocused spin‐echo pulse sequence. NMR in Biomedicine. 2018 Nov;31(11):e3960.
11. Yu Q, Reutens D, O'Brien K, Vegh V. Tissue microstructure features derived from anomalous diffusion measurements in magnetic resonance imaging. Human brain mapping. 2017 Feb;38(2):1068-81.
12. Yu Q, Reutens D, Vegh V. Can anomalous diffusion models in magnetic resonance imaging be used to characterise white matter tissue microstructure?. NeuroImage. 2018 Jul 15;175:122-37.
13. Karaman MM, Sui Y, Wang H, Magin RL, Li Y, Zhou XJ. Differentiating low‐and high‐grade pediatric brain tumors using a continuous‐time random‐walk diffusion model at high b‐values. Magnetic resonance in medicine. 2016 Oct;76(4):1149-57.
14. Yang Q, Puttick S, Bruce ZC, Day BW, Vegh V. Investigation of changes in anomalous diffusion parameters in a mouse model of brain tumour. In Proceedings of Computational Diffusion MRI: International MICCAI Workshop 2019. Springer.
15. Ingo C, Magin RL, Colon‐Perez L, Triplett W, Mareci TH. On random walks and entropy in diffusion‐weighted magnetic resonance imaging studies of neural tissue. Magnetic resonance in medicine. 2014 Feb;71(2):617-27.
16. Reiter DA, Magin RL, Li W, Trujillo JJ, Pilar Velasco M, Spencer RG. Anomalous T2 relaxation in normal and degraded cartilage. Magnetic resonance in medicine. 2016 Sep;76(3):953-62.
17. Bueno-Orovio A, Teh I, Schneider JE, Burrage K, Grau V. Anomalous diffusion in cardiac tissue as an index of myocardial microstructure. IEEE transactions on medical imaging. 2016 May 2;35(9):2200-7.
18. Landman BA, Farrell JA, Jones CK, Smith SA, Prince JL, Mori S. Effects of diffusion weighting schemes on the reproducibility of DTI-derived fractional anisotropy, mean diffusivity, and principal eigenvector measurements at 1.5 T. Neuroimage. 2007 Jul 15;36(4):1123-38.
19. Jones DK, Horsfield MA, Simmons A. Optimal strategies for measuring diffusion in anisotropic systems by magnetic resonance imaging. Magnetic Resonance in Medicine: An Official Journal of the International Society for Magnetic Resonance in Medicine. 1999 Sep;42(3):515-25.
20. Witelson SF. Hand and sex differences in the isthmus and genu of the human corpus callosum: a postmortem morphological study. Brain. 1989 Jun 1;112(3):799-835.
Figures