4409
Resolving orientation-specific diffusivities and transverse relaxation rates in heterogenous brain tissue1Physical Chemistry, Lund University, Lund, Sweden, 2Random Walk Imaging AB, Lund, Sweden, 3Cardiff University Brain Research Imaging Centre (CUBRIC), School of Psychology, Cardiff University, Cardiff, United Kingdom, 4Harvard Medical School, Boston, MA, United States, 5Radiology, Brigham and Women’s Hospital, Boston, MA, United States
Synopsis
Due to their cubic-millimeter scale, white-matter diffusion MRI voxels are often heterogeneous, comprising not only multiple fibre bundles but also grey matter, cerebrospinal fluid, or pathological tissue. To tackle this problem, conventional approaches rely on assumptions regarding tissue properties. This work combines state-of-the-art diffusion-relaxation MR acquisition and processing methods to extract intra-voxel nonparametric 5D distributions of diffusion tensors and transverse relaxation rates $$$R_2$$$ without the use of limiting assumptions. Orientation-resolved (fibre-specific) means of isotropic diffusivities, diffusion anisotropies and $$$R_2$$$ values are then obtained via clustering within the orientation subspace of these 5D distributions.
Introduction
In white matter, the millimeter-scale resolution of diffusion MRI may encompass axons and grey matter, cerebrospinal fluid, or pathological tissue. Conventional approaches, such as spherical deconvolution,1,2 can resolve sub-voxel heterogeneity, but they rely on assumptions regarding tissue properties.3 Furthermore, such methods implicitly assume a single $$$T_2$$$ within the voxel, which precludes the possibility of identifying pathological changes in $$$T_2$$$ within a given sub-voxel fibre population. Preferably, one should target the intra-voxel 5D distribution $$$\mathcal{P}(\mathbf{D},R_2)=\mathcal{P}(D_\mathrm{iso},D_\Delta,\theta,\phi,R_2)$$$ of diffusion tensors $$$\mathbf{D}$$$ (with isotropic diffusivity $$$D_\mathrm{iso}$$$, normalized anisotropy $$$D_\Delta\in[-0.5,1]$$$ and orientation $$$(\theta,\phi)$$$) and transverse relaxation rates $$$R_2=1/T_2$$$. Previous works, based on tensor-valued diffusion encoding4-6 and Monte-Carlo inversion algorithms,7-9 have managed to extract nonparametric distributions $$$\mathcal{P}(\mathbf{D},R_2)$$$10 and define nonparametric orientation distribution functions (ODFs) from these distributions.11 However, these ODFs cannot quantify the uncertainty on the estimation of fibre-specific metrics. Building on these works, we define orientational clusters featuring statistical measures of such metrics.Methods
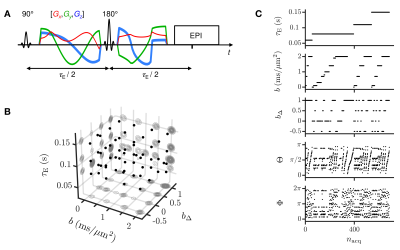
In vivo human brain data: A healthy volunteer was scanned on a 3T Siemens MAGNETOM Prisma equipped with a 32-channel receiver head-coil, using a spin-echo sequence with EPI readout, TR=4 s, FOV=234x234x60 mm3, voxel-size=3x3x3 mm3, partial-Fourier=6/8 and iPAT=2 (GRAPPA), customized for tensor-valued diffusion encoding12 and variable $$$\tau_\mathrm{E}$$$ (Fig.2A). Tensor-valued diffusion encoding was performed with numerically optimized13 spectrally matched14 Maxwell-compensated15 waveforms. The dimensions of our 45 minute acquisition scheme, comprising 686 points (Figs.2B-2C), match those of $$$\mathcal{P}(\mathbf{D},R_2)=\mathcal{P}(D_\mathrm{iso},D_\Delta,\theta,\phi,R_2)$$$. Images were topup-Eddy- and motion- corrected. The estimated signal-to-noise ratio (SNR) in the corona radiata was around 90.12Diffusion-relaxation distributions, bootstrap and ODFs: Distributions $$$\mathcal{P}(\mathbf{D},R_2)$$$ were retrieved using a Monte-Carlo algorithm10 that inverts the signal equation$$\frac{\mathcal{S}(\mathbf{b},\tau_\mathrm{E})}{\mathcal{S}_0}=\iint\!\exp(-\mathbf{b}:\mathbf{D})\,\exp(-\tau_\mathrm{E}R_2)\,\mathcal{P}(\mathbf{D},R_2)\,\mathrm{d}\mathbf{D}\,\mathrm{d}R_2\,,$$where $$$\mathbf{b}$$$ is the encoding tensor, $$$\tau_\mathrm{E}$$$ is the echo time, and ":" is the Frobenius inner product. In practice, the algorithm considers the discretized equation $$$\mathbf{S}=\mathbf{K}\cdot\mathbf{w}$$$, where $$$\mathbf{S}$$$ is the column vector containing the signals, $$$\mathbf{K}$$$ is the inversion kernel matrix and $$$\mathbf{w}$$$ is the column vector containing the weights $$$w$$$ of any given component $$$\{D_\mathrm{iso},D_\Delta,\theta,\phi,R_2\}$$$. Then, the algorithm randomly samples such components and weighs their propensity to fit the acquired signals via non-negative least-squares fitting.
We performed bootstrapping with replacement on the investigated dataset and estimated for each voxel an ensemble of 96 plausible sets of components $$$\{D_{\mathrm{iso},i},D_{\Delta,i},\theta_i,\phi_i,R_{2,i},w_i\}_{1\leq\!\,i\leq\!\,20}$$$. ODFs were extracted from fibre-like components, defined as those with $$$D_\Delta\geq0.5$$$, using the procedure detailed in previous work.11
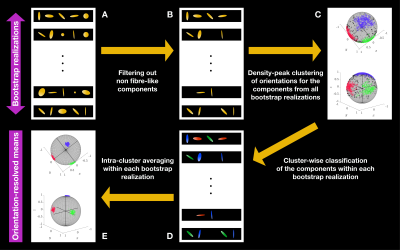
Clustering in the orientation subspace: Density-peak clustering,16 altered to account for the component weights $$$w_i$$$, was performed in the orientation subspace of the fibre-like components gathered from all bootstrap realizations, defining $$$N$$$ orientational clusters that exclude outliers. After isolating these components (Figs.1A-1B), density-peak clustering delineates orientational clusters (Fig.1C) using
- the density at data point $$$i$$$,17$$\rho_i=\sum_{j}w_j\,\exp(-d_{ij}^2/d_\mathrm{c}^2)\,,$$where $$$d_{ij}$$$ is the normalized angular distance between points $$$i$$$ and $$$j$$$, and $$$d_\mathrm{c}$$$ is a cutoff distance.
- the distance between point $$$i$$$ and the closest point of higher density$$\delta_i=\underset{\rho_j>\rho_i\,,\,j\neq\,\!i}{\mathrm{min}}\,d_{ij}\,.$$
Orientation-resolved means: Once the clusters were defined, fibre-like components $$$\{D_{\mathrm{iso},k},D_{\Delta,k},\theta_k,\phi_k,R_{2,k}\}_{k\in\{n_\mathrm{b},n_\mathrm{c}\}}$$$ belonging to the same bootstrap realization $$$n_\mathrm{b}$$$ and cluster $$$n_\mathrm{c}$$$ (Fig.1D) were averaged together to obtain orientation-resolved means (expectations) of $$$D_\mathrm{iso}$$$, $$$D_\Delta^2$$$ and $$$R_2$$$ for the bootstrap realization $$$n_\mathrm{b}$$$ according to$$\mathrm{E}[\chi]_{n_\mathrm{b},n_\mathrm{c}}=\frac{\sum_{k\in\{n_\mathrm{b},n_\mathrm{c}\}}w_k\,\chi_k}{\sum_{k\in\{n_\mathrm{b},n_\mathrm{c}\}}w_k}\,,$$where $$$\chi\equiv\!\,D_\mathrm{iso},D_\Delta^2,R_2$$$. Finally, we extracted the median and interquartile range of these means across bootstrap realizations (Fig.1E), respectively quantifying these measures and their uncertainty.
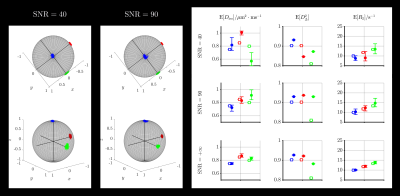
In silico validation: A voxel content mimicking the corona radiata (Fig.5) was simulated:
- one isotropic component, $$$D_\mathrm{iso}=1\;\mu\mathrm{m}^2/\mathrm{ms},\;T_2=1/R_2=200\;\mathrm{ms},\;w_\mathrm{iso}=0.2$$$.
- one anisotropic component along $$$x$$$, $$$D_\mathrm{iso}=0.85\;\mu\mathrm{m}^2/\mathrm{ms},\;D_\Delta=0.95,\;T_2=1/R_2=85\;\mathrm{ms},\;w_\mathrm{aniso}=(1-w_\mathrm{iso})/3$$$.
- one anisotropic component along $$$y$$$, $$$D_\mathrm{iso}=0.8\;\mu\mathrm{m}^2/\mathrm{ms},\;D_\Delta=0.9,\;T_2=1/R_2=75\;\mathrm{ms},\;w_\mathrm{aniso}=(1-w_\mathrm{iso})/3$$$.
- one anisotropic component along $$$z$$$, $$$D_\mathrm{iso}=0.75\;\mu\mathrm{m}^2/\mathrm{ms},\;D_\Delta=0.95,\;T_2=1/R_2=100\;\mathrm{ms},\;w_\mathrm{aniso}=(1-w_\mathrm{iso})/3$$$.
- Computation of the ground-truth signals using the ground-truth features and in vivo acquisition scheme.
- Addition of Rician noise with given SNR.
- Monte-Carlo inversions with 96 bootstrap realizations.
- Density-peak clustering and computation of the orientation-resolved means.
Results and discussion
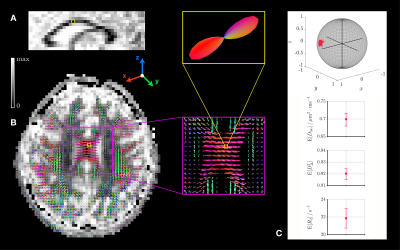
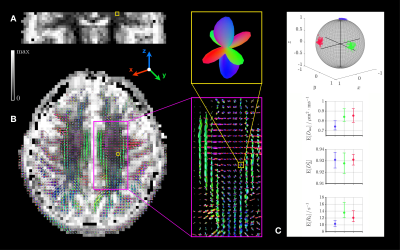
The in silico validation presented in Fig.3 shows that the orientational clusters retain the ground-truth sub-voxel orientations at finite SNR. The orientation-resolved means show rather accurate estimations of $$$\mathrm{E}[D_\mathrm{iso}]$$$ and $$$\mathrm{E}[R_2]$$$ at SNR=90 (in vivo dataset's SNR), but overestimate $$$\mathrm{E}[D_\Delta^2]$$$. However, this observation reflects limitations of the Monte-Carlo inversion that can be mitigated upon optimization of the acquisition scheme, as suggested by preliminary work.The in vivo applications presented in Figs.4-5 show that sub-voxel orientations are well captured by the orientational clusters in the corpus callosum and the corona radiata. Besides, the orientation-resolved means in this latter region exhibit a significantly lower $$$\mathrm{E}[R_2]$$$ in the corticospinal tract (CST) than in the corpus callosum and the arcuate fasciculus. This may originate from:
- the large axons of the pyramidal tracts carried by the CST.20,21
- an anisotropy of $$$R_2$$$ measurements in white matter.22,23
- inaccurate orientation-resolved means (Fig.3).
Conclusion
Even though additional work is required to alleviate the limitations of the 5D Monte-Carlo inversion,10 orientation-resolved means show potential in tracking either group differences in tissue microstructure within a sub-voxel fibre population, or fibre-specific microstructural changes in longitudinal studies, such as in development or treatment response.Acknowledgements
This work was financially supported by the Swedish Foundation for Strategic Research (AM13-0090, ITM17-0267) and the Swedish Research Council (2018-03697). Data collection was approved by the IRB of Cardiff University School of Medicine. Daniel Topgaard owns shares in Random Walk Imaging AB (Lund, Sweden, http://www.rwi.se/), holding patents related to the described methods.References
1. Jeurissen B, Tournier J-D, Dhollander T, Connelly A and Sijbers J, Multi-tissue constrained spherical deconvolution for improved analysis of multi-shell diffusion MRI data. Neuroimage 2014;103,411-426.
2. Jeurissen B and Szczepankiewicz F, Spherical deconvolution of diffusion MRI data with tensor-valued encodings. In: International Society for Magnetic Resonance Imaging (ISMRM) 2018.
3. Tax C M, Jeurissen B, Vos S B, Viergever M A and Leemans A, Recursive calibration of the fiber response function for spherical deconvolution of diffusion MRI data. Neuroimage 2014;86,67-80.
4. Eriksson S, Lasic S and Topgaard D, Isotropic diffusion weighting in PGSE NMR by magic-angle spinning of the q-vector. Journal of Magnetic Resonance 2013;226:13-18.
5. Eriksson S , Lasic S, Nilsson M et al., NMR diffusion-encoding with axial symmetry and variable anisotropy: Distinguishing between prolate and oblate microscopic diffusion tensors with unknown orientation distribution. The Journal of Chemical Physics 2015;142(10):104201.
6. Topgaard D, Multidimensional diffusion MRI. Journal of Magnetic Resonance 2017; 275:98-113.
7. Prange M and Song Y-Q, Quantifying uncertainty in NMR T2 spectra using Monte Carlo inversion. Journal of Magnetic Resonance 2009;196,54-60.
8. de Almeida Martins J P and Topgaard D, Two-dimensional correlation of isotropic and directional diffusion using NMR. Physics Review Letters 2016;116:087601.
9. Topgaard D. Diffusion tensor distribution imaging. NMR in Biomedicine 2019;32(5):e4066
10. de Almeida Martins J P and Topgaard, D Multidimensional correlation of nuclear relaxation rates and diffusion tensors for model-free investigations of heterogeneous anisotropic porous materials. Scientific Reports 2018;8,2488.
11. de Almeida Martins J P et al., Mapping of fibre-specific relaxation and diffusivities in heterogeneous brain tissue. In: International Society for Magnetic Resonance Imaging (ISMRM) 2018.
12. Szczepankiewicz F et al., Tensor-valued diffusion encoding for diffusional variance decomposition (DIVIDE): Technical feasibility in clinical MRI systems. PLoS ONE 2019;14(3):e0214238.
13. Sjölund J et al., Constrained optimization of gradient waveforms for generalized diffusion encoding. Journal of Magnetic Resonance 2015;261,157.
14. Lundell H et al., Multidimensional diffusion MRI with spectrally modulated gradients reveals unprecedented microstructural detail. Scientific Reports 2019;9,9026.
15. Szczepankiewicz F, Westin C-F, and Nilsson M, Maxwell-compensated design of asymmetric gradient waveforms for tensor-valued diffusion encoding. Magnetic Resonance in Medicine 2019;82,1424.
16. Rodriguez A and Laio A, Clustering by fast search and find of density peaks. Science 2014;344,6191,1492-1496.
17. Cheng Y, Mean shift, mode seeking, and clustering. IEEE Trans. Pattern Anal. Mach. Intell. 1995;17:790.
18. Wang S, Wang D, Li C and Li Y, Comment on "Clustering by fast search and find of density peaks". arXiv:1501.04267 2015.
19. Tao L, Li W and Jin Y, An optimal density peak algorithm based on data field and information entropy. Proceedings of the 2017 International Conference on Data Mining, Communications and Information Technology, Article number 4.
20. Hall A C and Guyton J E, Textbook of medical physiology (11th ed.). Philadelphia: W.B. Saunders. 2005:687–690.
21. Dell'Acqua F et al., Temporal Diffusion Ratio (TDR): A diffusion MRI technique to map the fraction and spatial distribution of large axons in the living human brain. In: International Society for Magnetic Resonance Imaging (ISMRM) 2019.
22. Henkelman R M, Stanisz G J, Kim J K and Bronskill M J, Anisotropy of NMR properties of tissues. Magnetic Resonance in Medicine 1994;32,592-601.
23. Hänninen N et al., Orientation anisotropy of quantitative MRI relaxation parameters in ordered tissue, Scientific Reports 2017;7,9606.
Figures
