4407
Estimating distributions of diffusion tensors and longitudinal relaxation rates in the brain via Monte-Carlo inversion: a proof of principle1Physical Chemistry, Lund University, Lund, Sweden, 2Random Walk Imaging AB, Lund, Sweden, 3Spectrum Medical Imaging, Sydney, Australia, 4Karolinska Institute, Stockholm, Sweden, 5GE Healthcare, Stockholm, Sweden, 6Charlie Teo Foundation, Sydney, Australia
Synopsis
Conventional $$$T_1$$$-mapping techniques are only sensitive to voxel-averaged $$$T_1$$$ values, which hinders the study of fiber-specific myelination changes in the developing, aging or diseased brain. While recent works have focused on combining diffusion- and $$$T_1$$$- weightings to access orientation-resolved $$$T_1$$$ values, they rely on assumptions regarding the voxel content. This work combines a prototype diffusion-relaxation MR acquisition and a Monte-Carlo inversion method to extract intra-voxel nonparametric 5D distributions of diffusion tensors and longitudinal relaxation rates $$$R_1=1/T_1$$$ without the use of limiting assumptions. Estimated $$$R_1$$$ values are then mapped onto nonparametric orientation distribution functions, thereby yielding fiber-specific longitudinal relaxation rates.
Introduction
Due to their cubic-millimeter scale, diffusion MRI voxels are often heterogeneous, comprising various tissues such as white-matter fiber bundles, grey matter, cerebrospinal fluid or pathological tissue. In particular, 60 to 90% of brain voxels contain crossing fiber bundles,1 whose sub-voxel orientations can be resolved using diffusion-based approaches such as spherical deconvolution.2,3 However, since conventional $$$T_1$$$-mapping techniques are only sensitive to the voxel-averaged myelin content,4 bundle-specific myelin contents, relevant to the study of neurodevelopment, plasticity, aging, and neurological disorders,5-7 cannot be measured. To overcome this issue, acquisition schemes combining diffusion weighting and inversion recovery have recently been designed,8-10 enabling estimations of fiber-specific $$$T_1$$$ values.11,12 However, these estimations rely on assumptions regarding the voxel content.In this work, we acquire datasets using a prototype acquisition protocol drawing from tensor-valued encoding13-15 and variable repetition time, and estimate nonparametric intra-voxel distributions $$$\mathcal{P}(\mathbf{D},R_1)=\mathcal{P}(D_\mathrm{iso},D_\Delta,\theta,\phi,R_1)$$$ of diffusion tensors $$$\mathbf{D}$$$ (with isotropic diffusivity $$$D_\mathrm{iso}$$$, normalized anisotropy $$$D_\Delta\in[−0.5,1]$$$ and orientation $$$(\theta,\phi)$$$) and longitudinal relaxation rates $$$R_1 = 1/T_1$$$ without the use of limiting assumptions, via unconstrained Monte-Carlo inversion.16-19 We then map $$$R_1$$$ onto nonparametric orientation distribution functions (ODFs) obtained from the estimated distributions.20
Methods
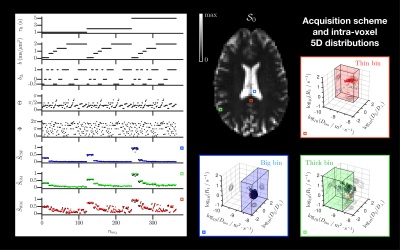
Diffusion-relaxation distributions: Intra-voxel distributions $$$\mathcal{P}(\mathbf{D},R_1)$$$ were retrieved using a Monte-Carlo algorithm18 that inverts the signal equation$$\frac{\mathcal{S}(\mathbf{b},\tau_\mathrm{R})}{\mathcal{S}_0}=\iint\!\exp(−\mathbf{b}:\mathbf{D})\,[1-\exp(-\tau_\mathrm{R}R_1)]\,\mathcal{P}(\mathbf{D},R_1)\,\mathrm{d}\mathbf{D}\,\mathrm{d}R_1\,,$$where $$$\mathbf{b}$$$ is the encoding tensor, $$$\tau_\mathrm{R}$$$ is the repetition time, and ":" is the Frobenius inner product. In practice, the algorithm considers the discretized equation $$$\mathbf{S}=\mathbf{K}\cdot\mathbf{w}$$$, where $$$\mathbf{S}$$$ is the column vector containing the signals, $$$\mathbf{K}$$$ is the inversion kernel matrix and $$$\mathbf{w}$$$ is the column vector containing the weights $$$w$$$ of any given component $$$\{D_\mathrm{iso},D_\Delta,\theta,\phi,R_1\}$$$. Then, it randomly samples such components and weighs their propensity to fit the acquired signals via non-negative least-squares fitting.Bootstrap, binning and ODFs: We performed bootstrapping with replacement on the investigated dataset and estimated for each voxel an ensemble of 64 plausible sets of components $$$\{D_{\mathrm{iso},i},D_{\Delta,i},\theta_i,\phi_i,R_{1,i},w_i\}_{1\leq\,\!i\leq\,\!20}$$$. Tissue-specific information can then be obtained via binning of the solution space. Introducing the axial and radial diffusivities $$$D_\parallel=D_\mathrm{iso}(1+2D_\Delta)$$$ and $$$D_\perp=D_\mathrm{iso}(1-D_\Delta)$$$, the "thin" bin $$$(0.1\leq\!\,D_\mathrm{iso}\,(\mu\mathrm{m}^2/\mathrm{ms})\leq\!\,2,\;4\leq\!\,D_\parallel/D_\perp\leq\!\,100)$$$, the "thick" bin $$$(0.1\leq\!\,D_\mathrm{iso}\,(\mu\mathrm{m}^2/\mathrm{ms})\leq\!\,2,\;0.01\leq\!\,D_\parallel/D_\perp\leq\!\,4)$$$, and the "big" bin $$$(2\leq\!\,D_\mathrm{iso}\,(\mu\mathrm{m}^2/\mathrm{ms})\leq\!\,10,\;0.01\leq\!\,D_\parallel/D_\perp\leq\!\,100)$$$ should target white-matter (WM), grey matter (GM) and cerebrospinal fluid (CSF), respectively. These bins are illustrated in Figure 2. Finally, we extract ODFs from the components belonging to the "thin" bin using the procedure detailed in previous work.20 These ODFs can be colored according to sub-voxel orientations and $$$R_1$$$ values.
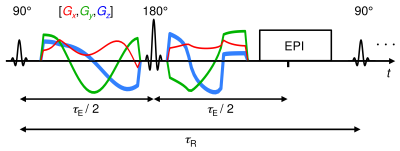
In vivo human brain data: Two healthy volunteers were scanned on a 3T GE 750w equipped with a 32-channel receiver head and neck GEM coils (only 12-16 channels used for head), using GE’s multi-dimensional diffusion (MDD) spin-echo sequence with EPI readout (Figure 1), echo time $$$\tau_\mathrm{E}$$$=120 ms, repetition times $$$\tau_\mathrm{R}$$$=1, 2 and 5 s, FOV=240x240x12 mm3, voxel-size=3x3x3 mm3 (four axial slices to reduce acquisition time) and ASSET acceleration factor=2. Tensor-valued diffusion encoding was performed with numerically optimized21 spectrally matched22 Maxwell-compensated23 waveforms. The dimensions of our 20 minute acquisition scheme, comprising 363 points (Figure 2), match those of $$$\mathcal{P}(\mathbf{D},R_1)=\mathcal{P}(D_\mathrm{iso},D_\Delta,\theta,\phi,R_1)$$$.
Limitations of the acquisition sequence: While an inversion-recovery slice-shuffling sequence could drastically reduce acquisition time,9,10 our prototype sequence is currently limited to sequential slices. There is no well-defined nulling of magnetisation or zero-time for recovery, implying that the $$$R_1$$$ kernel $$$[1-\exp(-\tau_\mathrm{R}R_1)]$$$ only approximates the true recovery.
Results and discussion
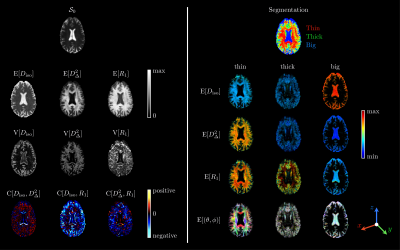
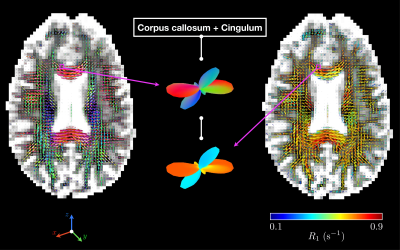
Results are shown for one healthy volunteer. Figure 2 features examples of 5D distributions $$$\mathcal{P}(\mathbf{D},R_1)$$$ in selected voxels (WM, GM and CSF). Figure 3 presents voxel-scale averaged and bin-specific axial maps of voxel-scale expectations $$$\mathrm{E}[\cdot]$$$, variances $$$\mathrm{V}[\cdot]$$$ and covariances $$$\mathrm{C}[\cdot,\cdot]$$$ of $$$D_\mathrm{iso}$$$, $$$D_\Delta^2$$$ and $$$R_1$$$ across bootstrap realizations. Figure 4 shows ODFs of the thin-bin components in an axial view and focuses on a voxel where the anterior corpus callosum and cingulum cross.Figure 2 highlights the fact that the acquired signals can be fitted well for various voxel contents, yielding intra-voxel distributions $$$\mathcal{P}(\mathbf{D},R_1)$$$ that match the expected underlying tissues. Figure 3 demonstrates that the Monte-Carlo inversion can estimate not only typical parameter maps such as $$$\mathcal{S}_0$$$, $$$\mathrm{E}[D_\mathrm{iso}]$$$ (mean diffusivity), $$$\mathrm{E}[D_\Delta^2]$$$ (analog of the microscopic fractional anisotropy)24 and $$$\mathrm{E}[R_1]$$$ (conventional $$$R_1$$$-weighted map), but also higher-order statistics of these physical quantities. Moreover, the bin-specific parameter maps enable tissue-specific mapping of the same physical quantities, importantly presenting a good $$$\mathrm{E}[R_1]$$$ contrast between WM, GM and CSF. Finally, Figure 4 shows that orientational- and $$$R_1$$$-colored ODFs can be extracted from the Monte-Carlo inversion, even in heterogeneous voxels. In particular, it estimates a smaller $$$R_1$$$ in the cingulum than in the corpus callosum, which is in agreement with the relative fiber-specific $$$R_1$$$ estimates obtained in previous work.11,12
Conclusion
The unconstrained Monte-Carlo inversion, combined with a 5D prototype acquisition protocol, allows to estimate nonparametric intra-voxel distributions $$$\mathcal{P}(\mathbf{D},R_1)$$$ of diffusion tensors and longitudinal relaxation rates that are consistent with expected voxel contents. While voxel-scale averaged and bin-specific maps of statistical measures of $$$D_\mathrm{iso}$$$, $$$D_\Delta^2$$$ and $$$R_1$$$ can be extracted from these distributions, the mapping of $$$R_1$$$ values onto nonparametric ODFs opens a way towards the study of fiber-specific myelination changes in the developing, aging or diseased brain.Acknowledgements
This work was financially supported by the Swedish Foundation for Strategic Research (AM13-0090, ITM17-0267) and the Swedish Research Council (2018-03697). Data collection was approved by the Spectrum Medical Imaging local ethics committee. Daniel Topgaard owns shares in Random Walk Imaging AB (Lund, Sweden, http://www.rwi.se/), holding patents related to the described methods.References
1. Jeurissen B et al., Investigating the prevalence of complex fiber configurations in white matter tissue with diffusion magnetic resonance imaging. Human Brain Mapping 2013;34:2747-2766.
2. Jeurissen B et al., Multi-tissue constrained spherical deconvolution for improved analysis of multi-shell diffusion MRI data. Neuroimage 2014;103,411-426.
3. Jeurissen B and Szczepankiewicz F, Spherical deconvolution of diffusion MRI data with tensor-valued encodings. In: International Society for Magnetic Resonance Imaging (ISMRM) 2018.
4. Campbell J S et al., Promise and pitfalls of g-ratio estimation with MRI. NeuroImage 2018;182,80-96.
5. Heuvel M P et al., Aberrant Frontal and Temporal Complex Network Structure in Schizophrenia: A Graph Theoretical Analysis. Journal of Neuroscience 2010;30(47),15915-15926.
6. Caeyenberghs K et al., Dynamics of the Human Structural Connectome Underlying Working Memory Training. Journal of Neuroscience 2016;36(14),4056-4066.
7. Mancini M et al., Introducing axonal myelination in connectomics: A preliminary analysis of g-ratio distribution in healthy subjects. NeuroImage 2017;182,351-359.
8. De Santis S et al., Resolving relaxometry and diffusion properties within the same voxel in the presence of crossing fibres by combining inversion recovery and diffusion‐weighted acquisitions. Magnetic Resonance in Medicine 2016;75:372-380.
9. Hutter J et al., Integrated and efficient diffusion-relaxometry using ZEBRA. Scientific Reports 2018;8,15138.
10. Park D J et al., Rapid multi-inversion SMS-EPI integrated with gradient-echo, spin-echo and diffusion-weighted EPI acquisitions. In: International Society for Magnetic Resonance Imaging (ISMRM) 2018.
11. De Santis S et al., T1 relaxometry of crossing fibres in the human brain. NeuroImage 2016;141:133-142.
12. Andrews D A et al., Efficient whole-brain tract-specific T1 mapping with slice-shuffled inversion-recovery diffusion-weighted imaging at 3T. In: International Society for Magnetic Resonance Imaging (ISMRM) 2019.
13. Eriksson S, Lasic S and Topgaard D, Isotropic diffusion weighting in PGSE NMR by magic-angle spinning of the q-vector. Journal of Magnetic Resonance 2013;226:13-18.
14. Eriksson S , Lasic S, Nilsson M et al., NMR diffusion-encoding with axial symmetry and variable anisotropy: Distinguishing between prolate and oblate microscopic diffusion tensors with unknown orientation distribution. The Journal of Chemical Physics 2015;142(10):104201.
15. Topgaard D, Multidimensional diffusion MRI. Journal of Magnetic Resonance 2017; 275:98-113.
16. Prange M and Song Y-Q, Quantifying uncertainty in NMR T2 spectra using Monte Carlo inversion. Journal of Magnetic Resonance 2009;196,54-60.
17. de Almeida Martins J P and Topgaard D, Two-dimensional correlation of isotropic and directional diffusion using NMR. Physics Review Letters 2016;116:087601.
18. de Almeida Martins J P and Topgaard, D Multidimensional correlation of nuclear relaxation rates and diffusion tensors for model-free investigations of heterogeneous anisotropic porous materials. Scientific Reports 2018;8,2488.
19. Topgaard D. Diffusion tensor distribution imaging. NMR in Biomedicine 2019;32(5):e4066
20. de Almeida Martins J P et al., Mapping of fibre-specific relaxation and diffusivities in heterogeneous brain tissue. In: International Society for Magnetic Resonance Imaging (ISMRM) 2018.
21. Sjölund J et al., Constrained optimization of gradient waveforms for generalized diffusion encoding. Journal of Magnetic Resonance 2015;261,157.
22. Lundell H et al., Multidimensional diffusion MRI with spectrally modulated gradients reveals unprecedented microstructural detail. Scientific Reports 2019;9,9026.
23. Szczepankiewicz F et al., Maxwell-compensated design of asymmetric gradient waveforms for tensor-valued diffusion encoding. Magnetic Resonance in Medicine 2019;82,1424.
24. Lasic S et al., Microanisotropy imaging: quantification of microscopic diffusion anisotropy and orientational order parameter by diffusion MRI with magic-angle spinning of the q-vector. Frontiers in Physics 2014;2:11.
Figures


Figure 2. Left: Acquisition scheme (τR, b's trace b, normalized anisotropy bΔ and orientation (Θ,Φ)) with sorted acquisition number nacq, & measured (black) and fitted (color) normalized signals $$$\tilde{S}$$$ (one bootstrap realization) in selected voxels (WM in red, GM in green, CSF in blue). Right: S0 map & distributions P(D,R1) in the same voxels shown as logarithmic plots of Diso, axial-radial ratio D||/D$$$_\perp$$$ and R1, with circle area proportional to each configuration's weight w and color coding for orientations. Component bins are illustrated as colored polygons.

