4404
Test-retest reliability of Diffusion Kurtosis Imaging (DKI) of the brain in healthy volunteers.
Ernst Christiaanse1,2, Alexander Leemans2, Patrik Wyss1, and Alberto de Luca2
1Department of Radiology, Swiss Paraplegic Centre, Nottwil, Switzerland, 2Image Sciences Institute, University Medical Center Utrecht, Utrecht, Netherlands
1Department of Radiology, Swiss Paraplegic Centre, Nottwil, Switzerland, 2Image Sciences Institute, University Medical Center Utrecht, Utrecht, Netherlands
Synopsis
It is essential for longitudinal studies to validate the reproducibility of the applied methods. Therefore, we assessed the test-retest reliability of diffusion kurtosis imaging of the brain in 10 healthy participants and showed a good reproducibility with some variation in different white matter regions.
Purpose
To assess the test-retest reliability of diffusion kurtosis imaging (DKI) of the brain.Introduction
Diffusion kurtosis imaging (DKI) is an extension of diffusion tensor imaging (DTI) based on the non-gaussian distribution of water molecules in tissues1,2. Since its introduction, this imaging method keeps attracting attention especially in neuroradiology, and previous reports have demonstrated increased sensitivity of DKI to pathological changes as compared to DTI3-5. Several studies have assessed the test-retest reliability6-8 of diffusion tensor imaging (DTI) with good reproducibility and coefficient of variation below 2 to 3 %. However, to the best of our knowledge, so far only one study has investigated the test-retest reliability of DKI in the brain9. We investigate the reliability of DKI metrics over two acquisitions performed within two weeks.Methods
We included 10 healthy volunteers (6 males, mean age 41, range 25-57 years) with no history of cervical trauma, traumatic brain injury, cervical surgery or signs of neurological impairment and no known neurological disease (Figure 1). The local ethics committee approved this study and the participants gave written informed consent prior to study enrolment. The MRI scans were acquired using a 3 Tesla Philips Achieva scanner (Release 5.4, Philips Healthcare, Best, The Netherlands) using a 32-channel head coil. High resolution sagittal 3D T1-weighted anatomic images were acquired with a turbo field echo sequence [TR (repetition time) = 8ms, TE (echo time) = 3.7ms, voxel size = 1 x 1 x 1 mm3, acquisition time = 150 s] followed by a DKI acquisition scheme [TR=13000ms, TE=80ms FOV 240 x 240 x 152 mm, Voxel 2.5 x 2.5 x 2.5 mm, Matrix 96 x 94 x 61 slices, acquisition time=900s] resulting in a total acquisition time of 20 minutes. The acquired raw diffusion data was processed and analysed with ExploreDTI10 (version 4.8.6). Data processing included motion correction, signal drift correction, image cropping, Gibbs ringing correction, eddy current distortions and EPI deformations correction. Brain segmentation was performed with CAT12 by using the MORI atlas11. Statistical analysis for the test-retest reliability was performed using R (version 3.6.0)12 calculating the intraclass correlation coefficient13 (ICC) and Bland-Altman tests14.Results
We selected 6 brain regions in both cerebral hemispheres (genu of the corpus callosum, middle occipital gyrus, uncus, superior occipital gyrus, anterior corona radiata and the occipital lobe). The Bland-Altman plots of the kurtosis anisotropy (KA, figures 2 and 3) and the mean kurtosis (MK, figures 4 and 5) of the white matter in these regions showed a good general agreement between the measurements with small differences. The ICC values of KA in the different regions showed values indicating moderate to excellent agreement with lowest values in the right uncus (ICC=0.58) to highest agreement in the right anterior CR (ICC=0.94). The ICC values of MK also showed good values with exception of the left occipital lobe. The values ranged from 0.27 (left [ADL2] occipital lobe) to 0.98 (right superior occipital gyrus).Discussion
We demonstrated in this study that there is in general a good reproducibility of the KA and MK values in different regions of the brain with some variability in specific regions, most likely due to susceptibility artefacts. Limitations of this study includes small number of participants with odd distribution of males and females.Conclusion
We demonstrated in this study that DKI in healthy volunteers is a reliable method for assessing the brain and that it can be used for measuring reliably microstructural changes in the brain in longitudinal studies.Acknowledgements
No acknowledgement found.References
- Jensen JH, Helpern JA, Ramani A, Lu H, Kaczynski K. Diffusional kurtosis imaging: The quantification of non-Gaussian water diffusion by means of magnetic resonance imaging. Magn Reson Med. 2005;53(6):1432–1440.
- Jensen JH, Helpern JA. MRI quantification of non-Gaussian water diffusion by kurtosis analysis. NMR Biomed. England; 2010;23(7):698–710.
- Guglielmetti C, Veraart J, Roelant E, et al. Diffusion kurtosis imaging probes cortical alterations and white matter pathology following cuprizone induced demyelination and spontaneous remyelination. Neuroimage. Academic Press; 2016;125:363–377
- Yuan L, Sun M, Chen Y, et al. Non-Gaussian diffusion alterations on diffusion kurtosis imaging in patients with early Alzheimer’s disease. Neurosci Lett. Elsevier; 2016;616:11–18
- Lin L, Bhawana R, Xue Y, et al. Comparative Analysis of Diffusional Kurtosis Imaging, Diffusion Tensor Imaging, and Diffusion-Weighted Imaging in Grading and Assessing Cellular Proliferation of Meningiomas. Am J Neuroradiol. 2018;39(6):1032–1038
- Ciccarelli O, Parker GJM, Toosy AT, et al. From diffusion tractography to quantitative white matter tract measures: a reproducibility study. Neuroimage. 2003;18(2):348–359
- Pfefferbaum A, Adalsteinsson E, Sullivan E V. Replicability of diffusion tensor imaging measurements of fractional anisotropy and trace in brain. J Magn Reson Imaging. 2003;18(4):427–433
- Heiervang E, Behrens TEJ, Mackay CE, Robson MD, Johansen-Berg H. Between session reproducibility and between subject variability of diffusion MR and tractography measures. Neuroimage. 2006;33(3):867–877
- Shahim P, Holleran L, Kim JH, Brody DL. Test-retest reliability of high spatial resolution diffusion tensor and diffusion kurtosis imaging. Sci Rep. Springer US; 2017;7(1):1114
- Leemans A, Jeurissen B, Sijbers J, Jones DK. “ExploreDTI: A graphical toolbox for processing, analyzing, and visualizing diffusion MR data”. Proceedings of the 17th Scientific Meeting, International Society for Magnetic Resonance in Medicine, Honolulu, USA, p. 3537, 2009.
- Rezende TJR, Campos BM, Hsu J, et al. Test–retest reproducibility of a multi‐ atlas automated segmentation tool on multimodality brain MRI. Brain Behav. 2019;9(10):1–22
- R Core Team (2019). R: A language and environment for statistical computing. R Foundation for Statistical Computing, Vienna, Austria. URL https://www.R-project.org/.
- Shrout PE, Fleiss JL. Intraclass correlations: uses in assessing rater reliability. Psychol Bull 1979;86:420–8 14. Martin Bland J, Altman DG. Statistical Methods for Assessing Agreement Between Two Methods of Clinical Measurement. Lancet. 1986;327(8476):307–310.
Figures
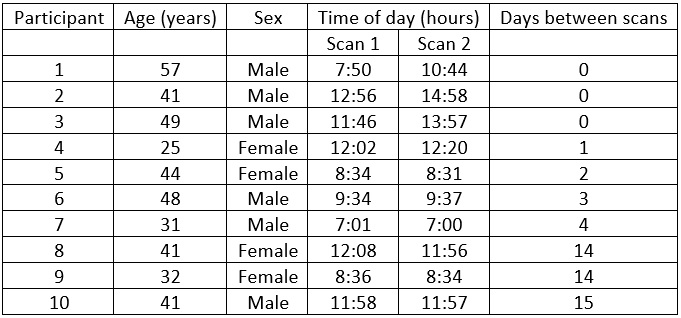
Demographics of the study population including the time differences
between the measurement settings.
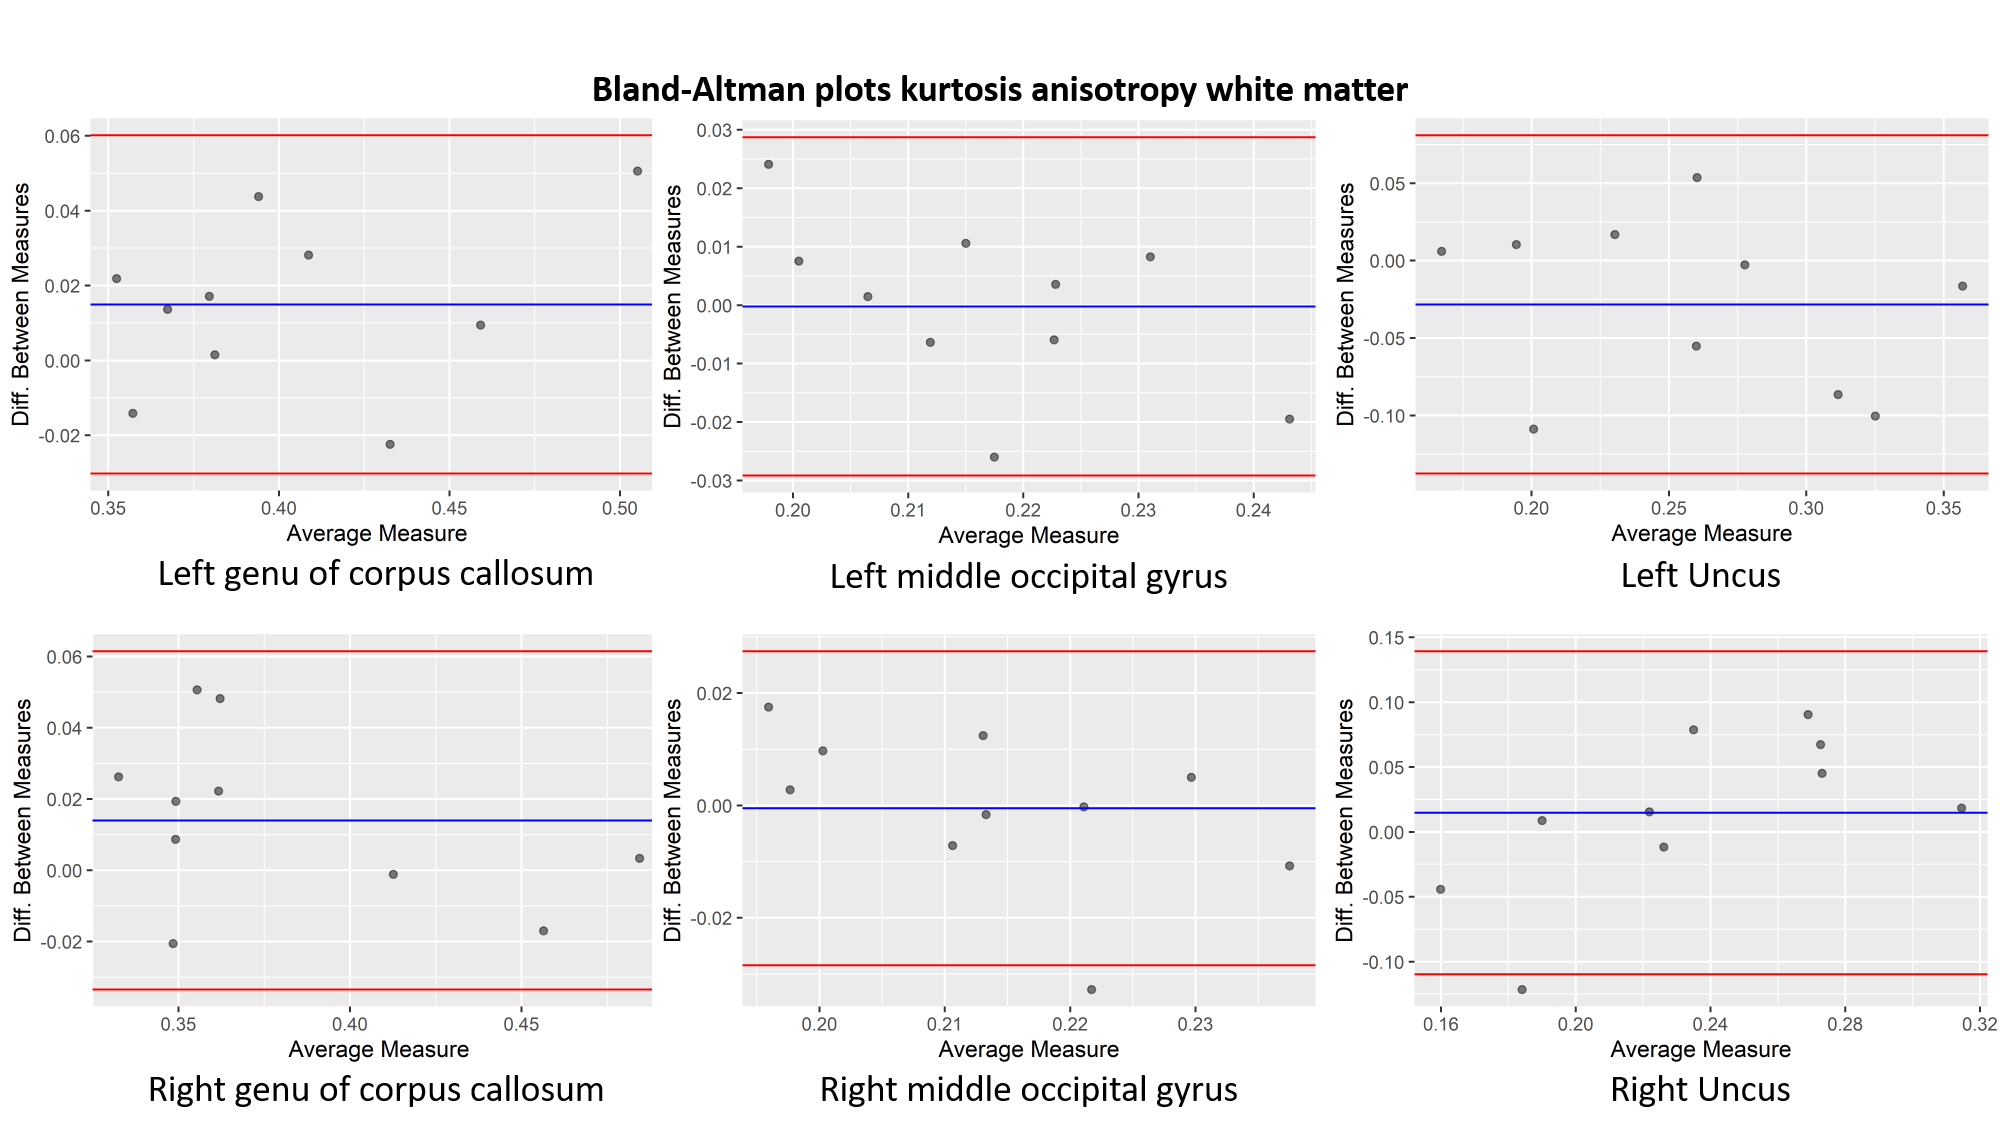
Bland-Altman plots of the kurtosis anisotropy in white matter for the
left (upper row) and right (lower row) of the genu of corpus callosum, the
middle occipital gyrus and the uncus. The blue line indicates the mean value
and the red lines define the 95% limits of the confidence interval.
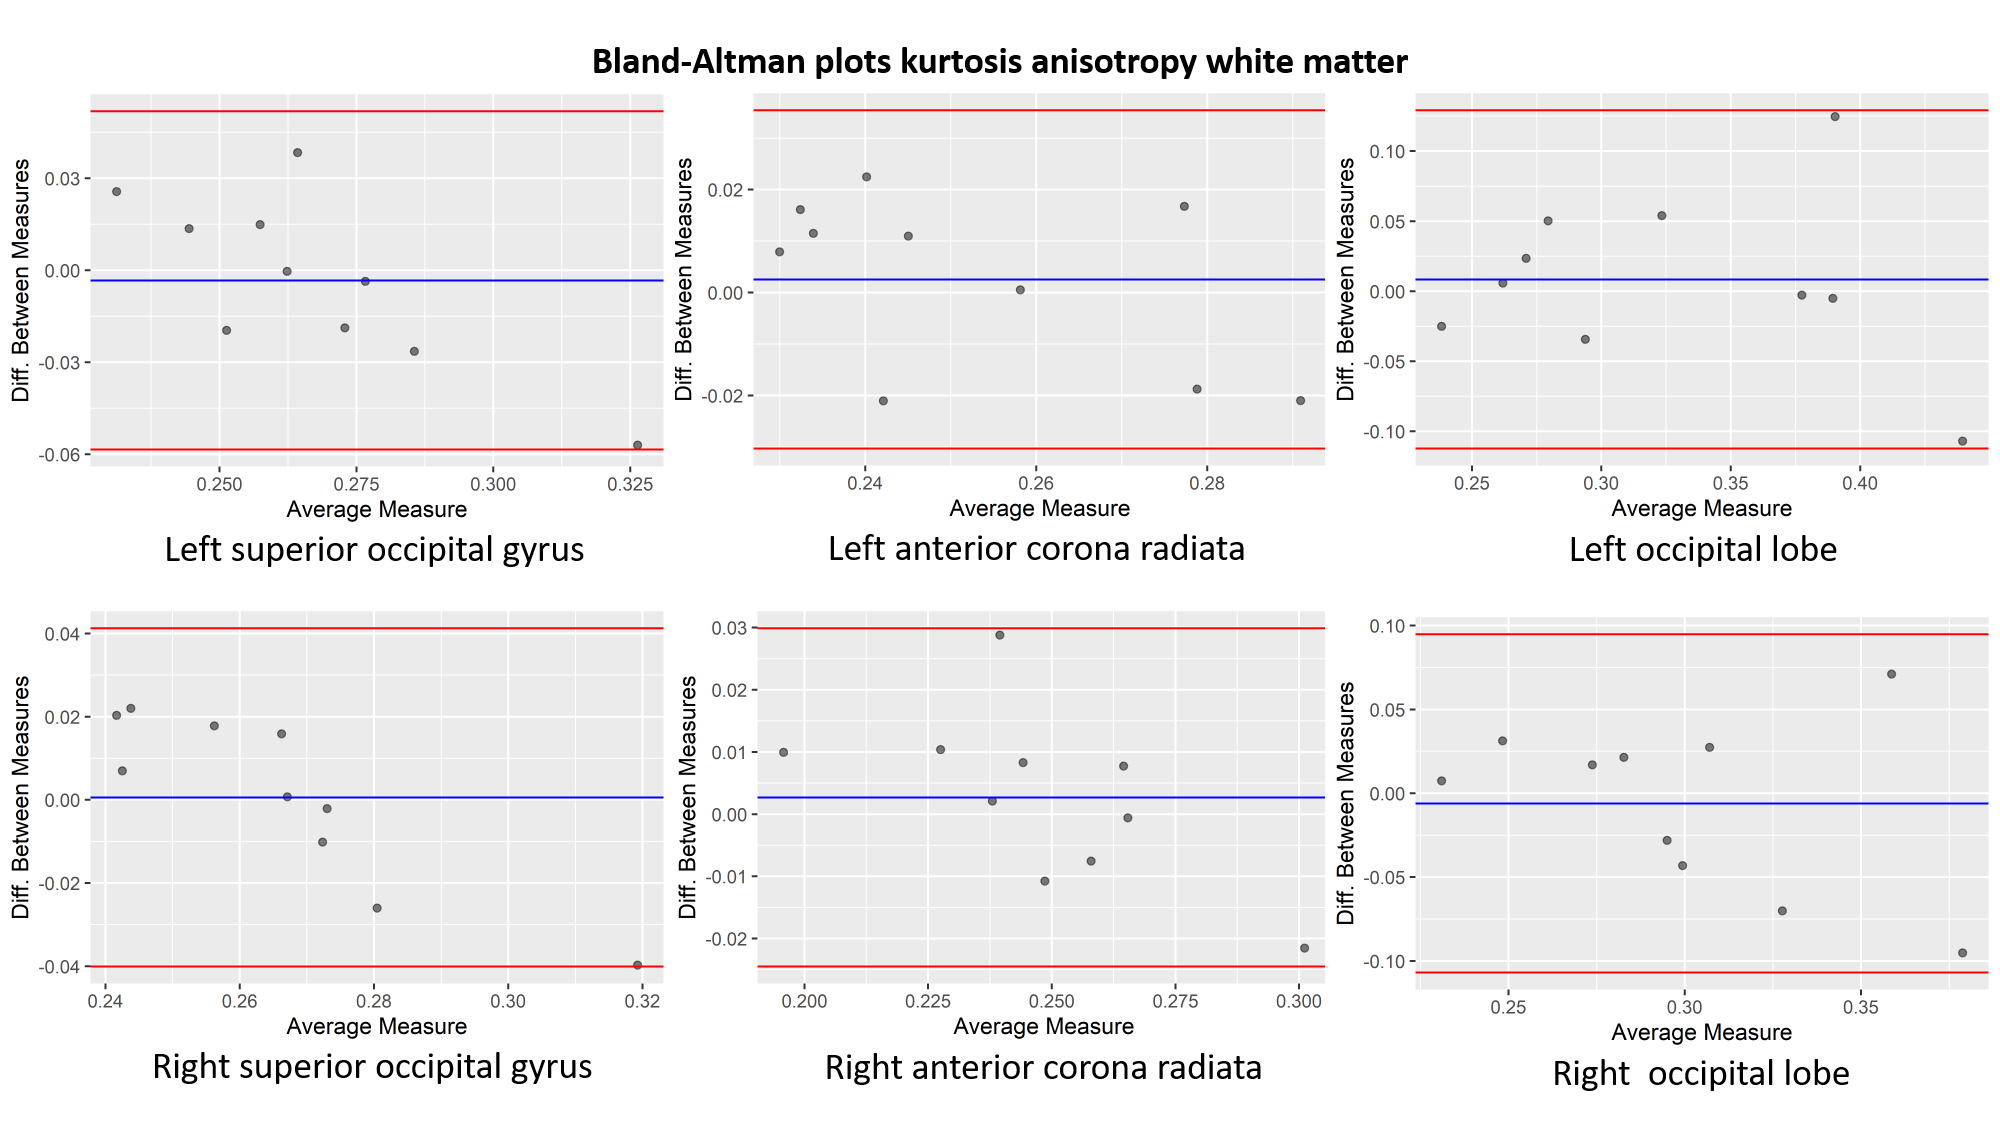
Bland-Altman plots of the kurtosis anisotropy in white matter for the
left (upper row) and right (lower row) of the superior occipital gyrus,
anterior corona radiata and occipital lobe.
The blue line indicates the mean value and the red lines define the 95% limits
of the confidence interval.
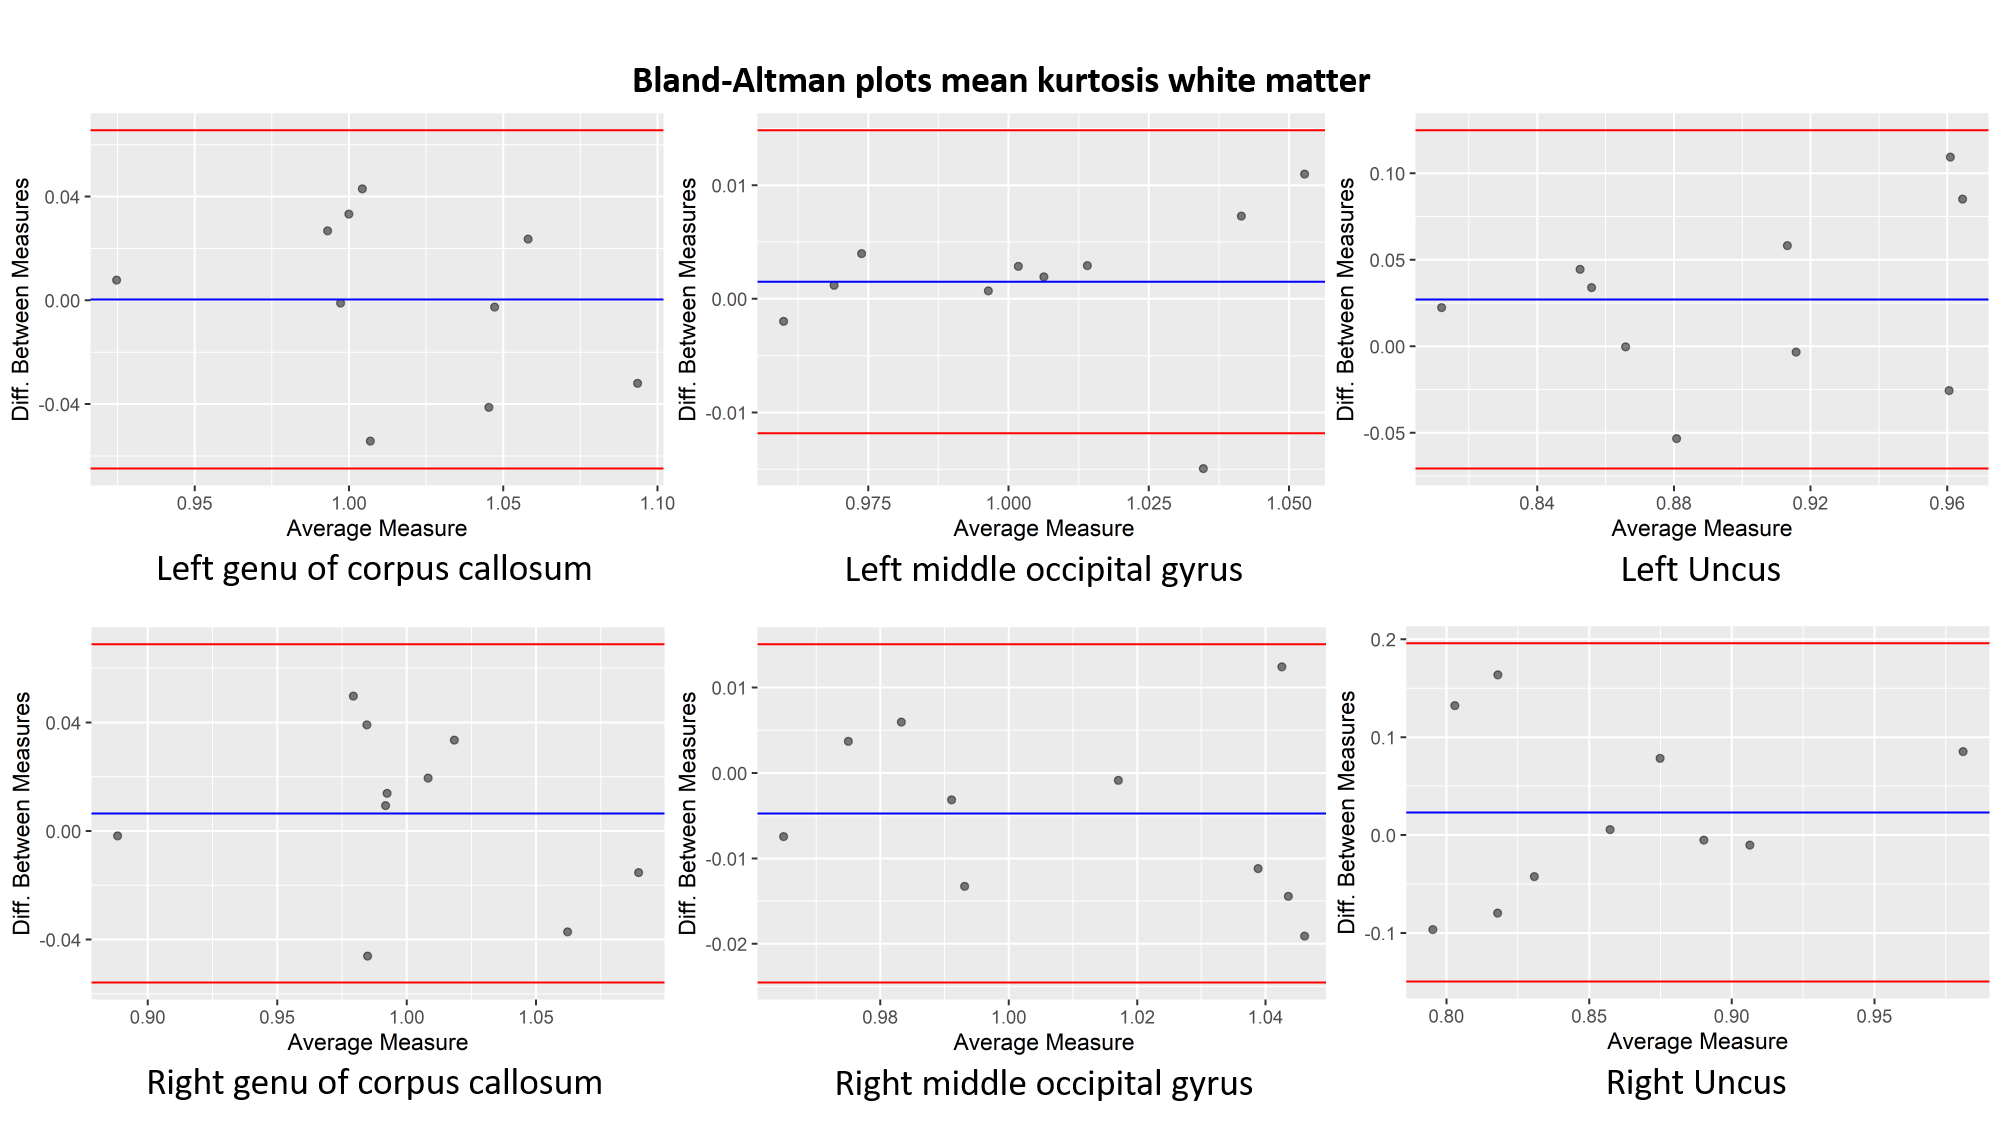
Bland-Altman plots of the mean kurtosis in white matter for the left
(upper row) and right (lower row) of the genu of corpus callosum, the middle
occipital gyrus and the uncus. The blue line indicates the mean value and the
red lines define the 95% limits of the confidence interval.
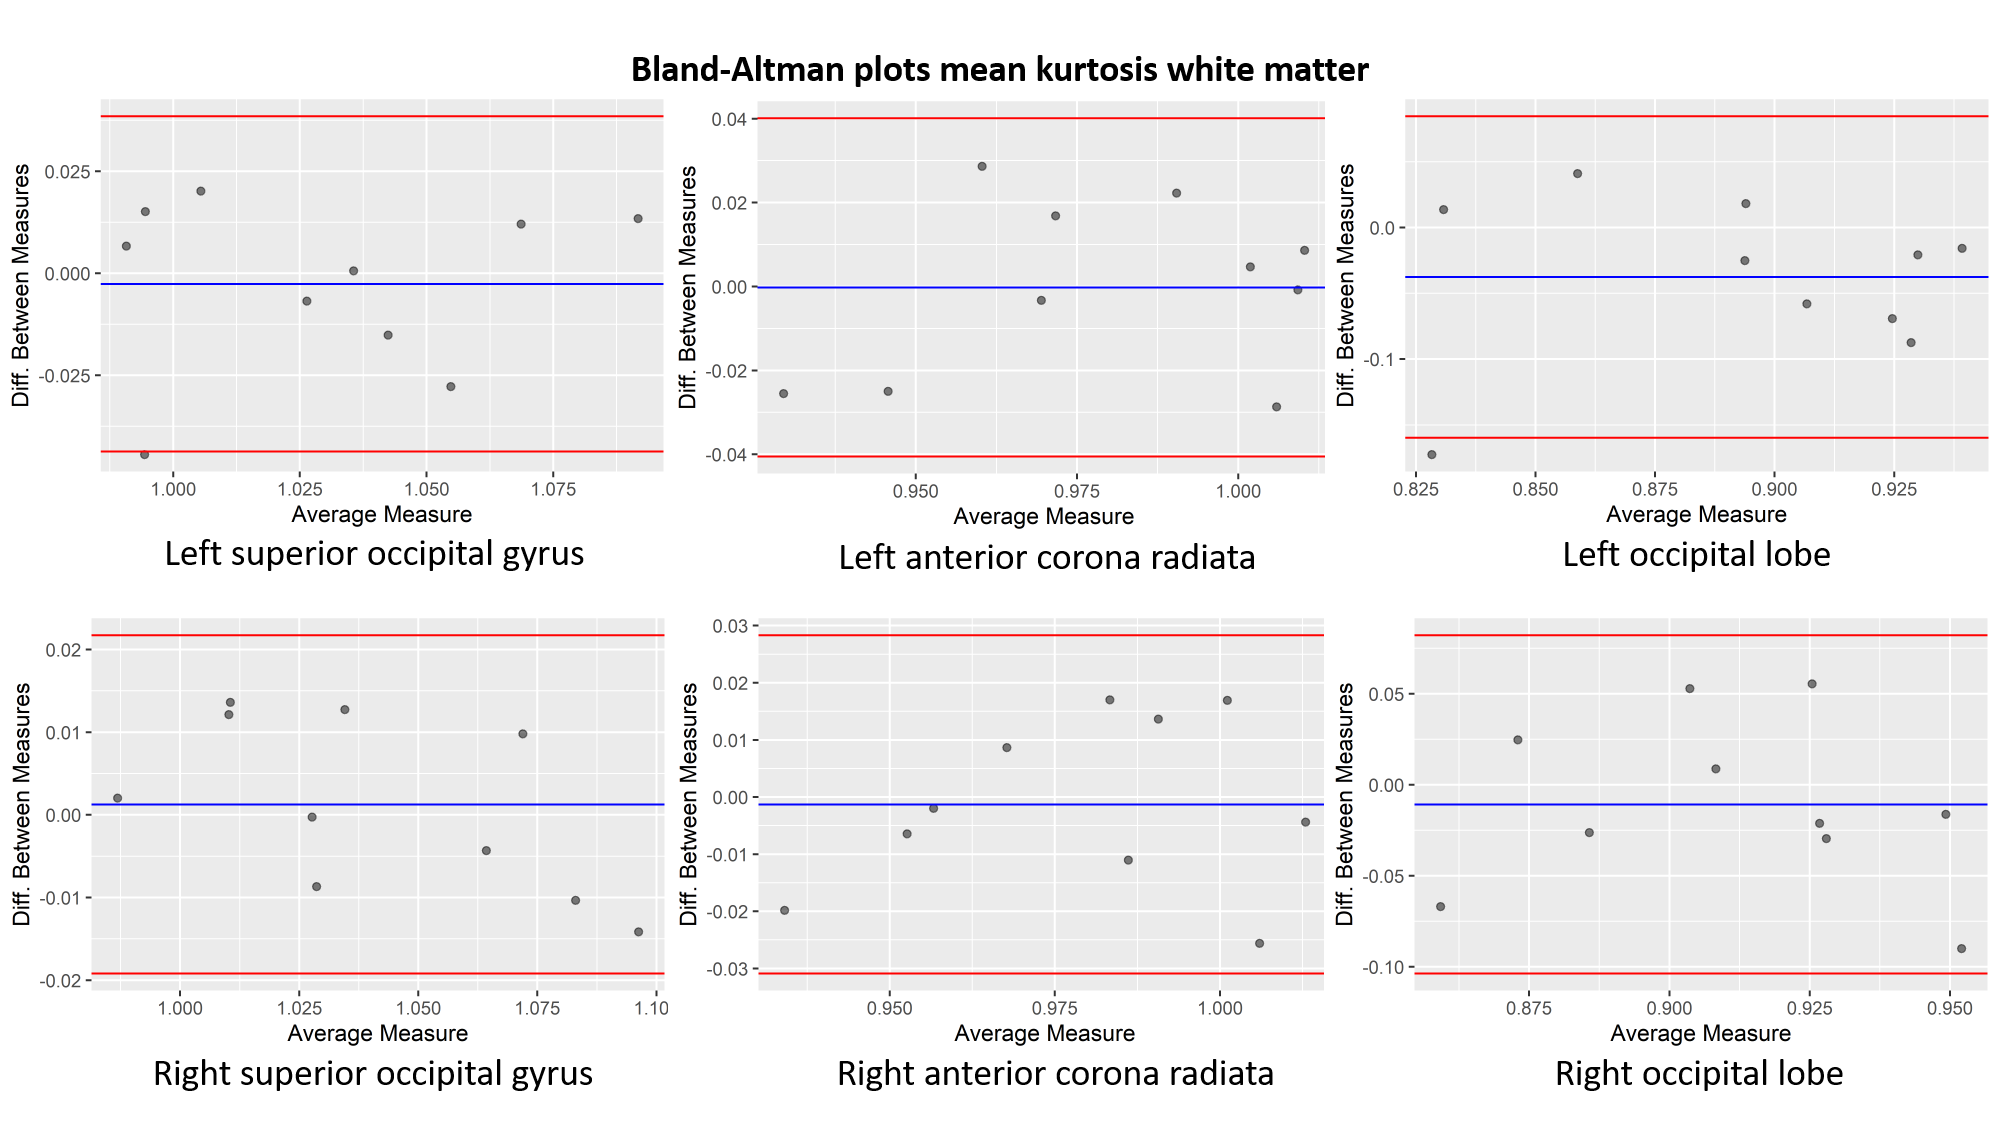
Bland-Altman plots of the mean kurtosis in white matter for the left
(upper row) and right (lower row) of the superior occipital gyrus, anterior corona radiata and occipital lobe.
The blue line indicates the mean value and the red lines define the 95% limits
of the confidence interval.