4402
Deep Learning Based Brain Tissue Segmentation from Novel Diffusion Kurtosis Imaging Features
Fan Zhang1, Anna Breger2, Lipeng Ning1, Carl-Fredrik Westin1, Lauren J O'Donnell1, and Ofer Pasternak1
1Harvard Medical School, Boston, MA, United States, 2University of Vienna, Wien, Austria
1Harvard Medical School, Boston, MA, United States, 2University of Vienna, Wien, Austria
Synopsis
Brain tissue segmentation is important in many diffusion MRI (dMRI) visualization and quantification tasks. We propose a deep learning tissue segmentation method that relies only on dMRI data. We leverage diffusion kurtosis imaging (DKI) and a recently proposed mean-kurtosis-curve (MK-curve) method to create a feature set that is highly discriminative between different types of tissues. We train a Unet model with a recently developed augmented target loss function on dMRI data from the Human Connectome Project. We show improved segmentation performance compared to several other methods and reliable segmentation results when applied on data with a different acquisition.
Introduction
Brain segmentation into gray matter (GM), white matter (WM), and cerebrospinal fluid (CSF) is a critical step in diffusion MRI (dMRI) visualization and quantification. Current state-of-the-art segmentation is based on coregistering T1- or T2-weighted MRI segmentation to dMRI, which is challenging due to the low resolution and EPI-distorted dMRI1,2. A better approach would be to directly segment brain tissue from dMRI data itself.Most dMRI-based segmentation methods3–8 use diffusion tensor imaging (DTI)9 parameters (e.g., MD, FA), and, more recently10–12, diffusion kurtosis imaging (DKI)13 parameters, which characterizes non-Gaussian water molecule diffusion. However, DKI parameters suffer from image artifacts and often result with implausible values14,15.
We propose a novel DKI-based deep learning segmentation for dMRI data into WM, GM, and CSF (Figure-1): First, we apply the recently proposed mean-kurtosis-curve (MK-curve) method16 to correct for implausible DKI parameters , and include three novel MK-curve based image features which show a good tissue contrast. Second, we employ a recently proposed augmented target loss function17 in convolutional neural network (CNN), by using transformations to penalize misclassification of voxels from GM and WM as CSF. We use high-quality Human Connectome Project (HCP)18 data to train our model, and demonstrate generalizability by applying it on clinical data with lower resolution and fewer gradient directions.
Methods
The segmentation algorithm has three main steps (Figure-1): (1) MK-curve-based feature extraction, (2) CNN tissue segmentation model training, and (3) application of the CNN model for subject-specific tissue segmentation. For each dataset, we calculated 10 voxelwise features using MK-curve16: four corrected DTI parameters (FA, λ1, λ2, λ3), three corrected DKI parameters (MK, AK, RK), and three novel MK-curve features (ZeroMK-b0, MaxMK-b0, MaxMK). Each parameter was z-transformed across the brain. Ground truth labels were obtained by segmenting a T2w image (SPM12) and registering to the EPI corrected dMRI (FSL, TOPUP). We then trained three 2D-Unet models (axial, coronal and sagittal; Figure-1.b) and used majority count to combine the predicted labels19. Unet was trained using a recently proposed augmented target loss function17 to penalize misclassification of voxels at the boundary of GM and WM as CSF5,8.100 high-quality HCP datasets (dMRI: b=0/1000/2000/3000s/mm2, 270 directions, 18 b=0, TE/TR=89.5/5520ms and 1.25x1.25x1.25mm3; T2w: TE/TR=565ms/3200ms, and 0.7x0.7x0.7mm3) went through recommended HCP processing19 and used for CNN model training (n=70), validation (n=20) and testing (n=10). To test how the trained model generalizes to data from another acquisition, we performed evaluation on 10 dMRI datasets from a clinical acquisition (b=0/1000/3000s/mm2, 30 directions per shell, 5 b=0, TE/TR=109/15800ms, and 2x2x2mm3) that were masked and preprocessed using FSL’s Eddy. As a baseline comparison, we segment the b=0 image (using SPM) of both the HCP and clinical data. Results were compared with support vector machine (SVM) classifier, with Unet without augmented loss function, and for subsets of the 10 input features.
Evaluation and results
The proposed deep learning segmentation with augmented loss function and 10 features outperformed all other methods, providing a high accuracy (91.37%) and high AUC (GM-0.974, WM-0.992, CSF-0.969). Adding more features improved accuracy for each classifier (Figure-2). The proposed Unet+augmented-target classifier outperformed Unet+cross-entropy, followed by SVM (Figure-2), although SVM did not always outperform the baseline SPM+b0 method (82.71%). The proposed method obtained higher accuracy and higher AUC for each tissue type than the SPM+b0 method (Figure-3). For the HCP test data, the proposed method obtained highly visually similar tissue segmentation and segmentation probability to the ground truth (Figure-4). For the clinical acquisition data, the proposed method obtained a more apparently anatomically correct segmentation compared to SPM+b0, e.g., in the subcortical putamen region (Figure-5).Discussion
We propose several improvements to dMRI tissue segmentation: (1) Correcting DKI parameters for implausible value, (2) including novel features from MK-curve, (3) using deep-learning and (4) augment the deep learning loss function. We demonstrate that each of these improvements improve segmentation quality, and that using all of them together provides the best results.Using DKI likely improves segmentation due to the additional restricted water diffusion properties that are different between tissue types. Correcting implausible DKI parameters using the MK-curve method further improved the performance, most likely because the un-corrected parameters constitute noisy estimates of tissue properties. Adding the novel MK-curve parameters further improves the segmentation quality, supporting the hypothesis that these parameters are affected by tissue type. Despite the augmented approach that penalizes misclassification of voxels at the tissue boundary, and despite the MK-curve that corrects many of the boundary voxels, most remaining misclassified voxels are still at tissue boundaries. This is likely due to the training procedure in which voxels with partial volume were labeled based on the majority class. Future work could potentially consider fuzzy classes rather than three distinct classes.
Conclusion
The presented DKI-based deep learning method for brain tissue segmentation outperforms state-of-the-art. Future work should evaluate segmentation of brains with lesions (e.g. tumor and edema). While the additional MK-curve measures improve segmentation, further theoretical work is needed to explain why these measures vary with tissue type.Acknowledgements
The authors gratefully acknowledge the support of the following NIH grants: NIH R01MH108574; NIH R01MH085953; NIH P41EB015902; NIH U01CA199459.References
1. Malinsky, M. et al. Registration of FA and T1-weighted MRI data of healthy human brain based on template matching and normalized cross-correlation. J. Digit. Imaging 26, 774–785 (2013).2. Albi, A. et al. Image Registration to Compensate for EPI Distortion in Patients with Brain Tumors: An Evaluation of Tract-Specific Effects. J. Neuroimaging 28, 173–182 (2018).
3. Liu, T. et al. Brain tissue segmentation based on DTI data. Neuroimage 38, 114–123 (2007).
4. Schnell, S. et al. Fully automated classification of HARDI in vivo data using a support vector machine. Neuroimage 46, 642–651 (2009).
5. Wen, Y., He, L., von Deneen, K. M. & Lu, Y. Brain tissue classification based on DTI using an improved fuzzy C-means algorithm with spatial constraints. Magn. Reson. Imaging 31, 1623–1630 (2013).
6. Kumazawa, S., Yoshiura, T., Honda, H. & Toyofuku, F. Improvement of partial volume segmentation for brain tissue on diffusion tensor images using multiple-tensor estimation. J. Digit. Imaging 26, 1131–1140 (2013).
7. Yap, P.-T., Zhang, Y. & Shen, D. Brain Tissue Segmentation Based on Diffusion MRI Using ℓ0 Sparse-Group Representation Classification. Med. Image Comput. Comput. Assist. Interv. 9351, 132–139 (2015).
8. Ciritsis, A., Boss, A. & Rossi, C. Automated pixel-wise brain tissue segmentation of diffusion-weighted images via machine learning. NMR Biomed. 31, e3931 (2018).
9. Pierpaoli, C., Jezzard, P., Basser, P. J., Barnett, A. & Di Chiro, G. Diffusion tensor MR imaging of the human brain. Radiology 201, 637–648 (1996).
10. Beejesh, A. G., Gopi, V. P. & Hemanth, J. Brain MR kurtosis imaging study: Contrasting gray and white matter. Cogn. Syst. Res. 55, 135–145 (2019).
11. Hui, E. S., Russell Glenn, G., Helpern, J. A. & Jensen, J. H. Kurtosis analysis of neural diffusion organization. Neuroimage 106, 391–403 (2015).
12. Steven, A. J., Zhuo, J. & Melhem, E. R. Diffusion kurtosis imaging: an emerging technique for evaluating the microstructural environment of the brain. American Journal of Roentgenology 202, W26–33 (2014).
13. Jensen, J. H. & Helpern, J. A. MRI quantification of non-Gaussian water diffusion by kurtosis analysis. NMR Biomed. 23, 698–710 (2010).
14. Veraart, J., Fieremans, E., Jelescu, I. O., Knoll, F. & Novikov, D. S. Gibbs ringing in diffusion MRI. Magnetic Resonance in Medicine 76, 301–314 (2016).
15. Shaw, C. B. & Jensen, J. H. Recent Computational Advances in Denoising for Magnetic Resonance Diffusional Kurtosis Imaging (DKI). J. Indian Inst. Sci. 97, 377–390 (2017).
16. Zhang, F., Ning, L., O’Donnell, L. J. & Pasternak, O. MK-curve - Characterizing the relation between mean kurtosis and alterations in the diffusion MRI signal. NeuroImage 196, 68–80 (2019).
17. Breger, A. et al. On Orthogonal Projections for Dimension Reduction and Applications in Augmented Target Loss Functions for Learning Problems. J. Math. Imaging Vis. (2019). doi:10.1007/s10851-019-00902-2
18. Glasser, M. F. et al. The minimal preprocessing pipelines for the Human Connectome Project. Neuroimage 80, 105–124 (2013).
19. Wasserthal, J., Neher, P. & Maier-Hein, K. H. TractSeg - Fast and accurate white matter tract segmentation. Neuroimage 183, 239–253 (2018).
Figures
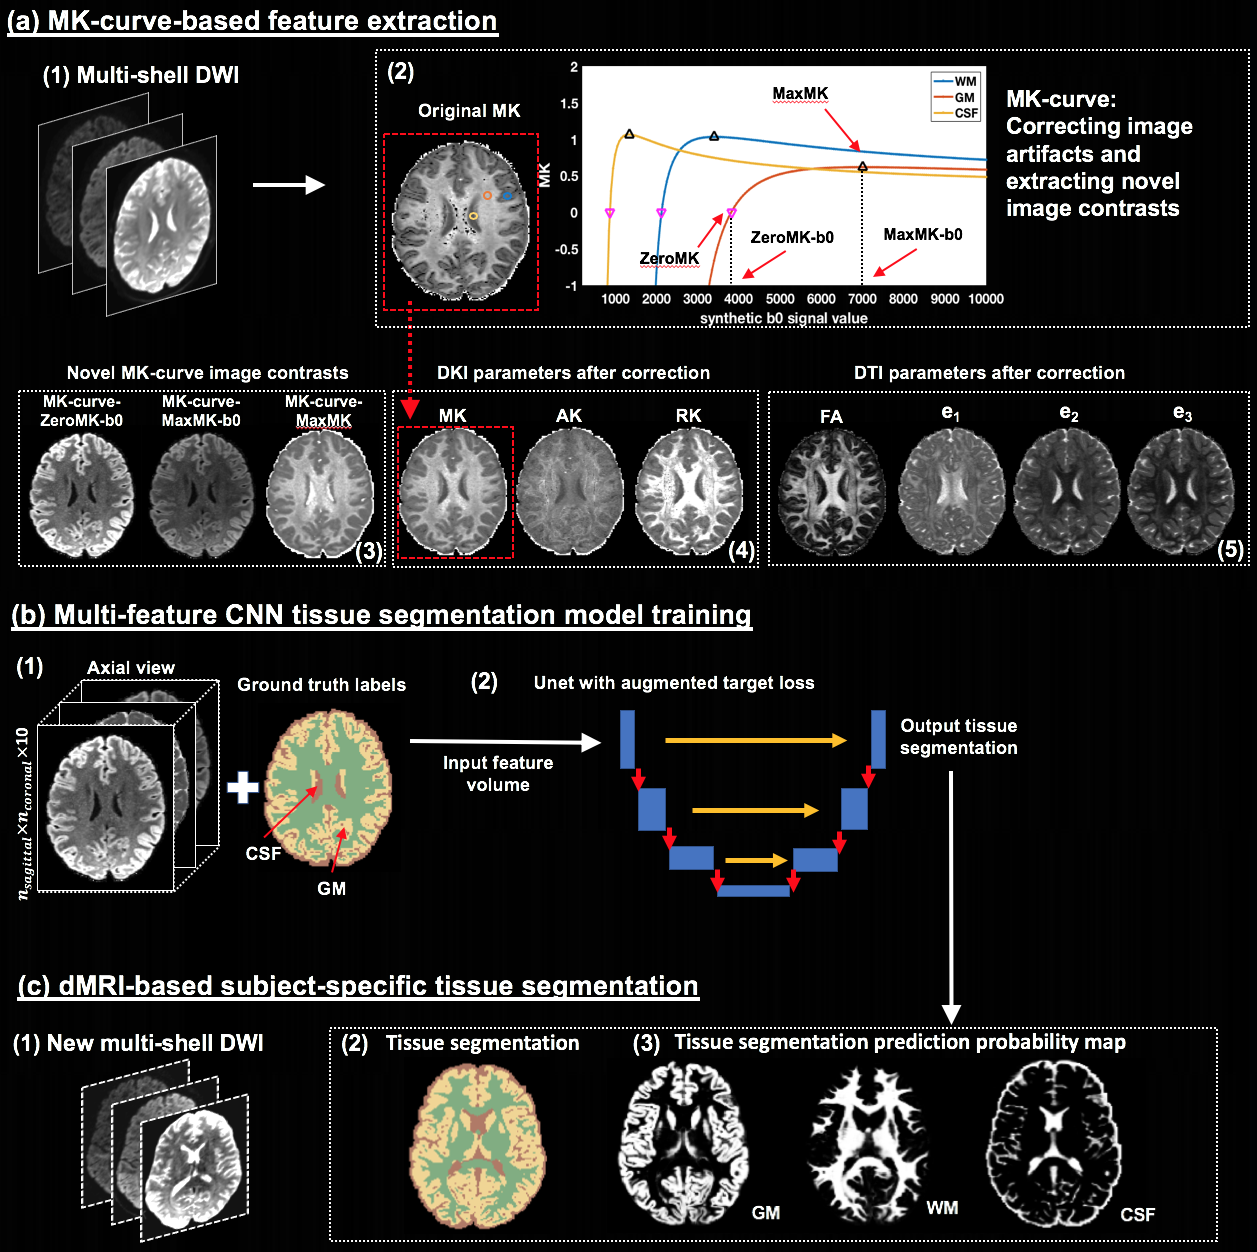
Figure-1: Method overview. Training is performed on high quality DWI where ground truth labels are obtained from T2w-based segmentation. From training DWI (a1), MK-curve (a2) is used to compute a set of 10 features: 3 novel MK-curve contrasts (a3), 3 DKI maps (a4) and 4 DTI maps (a5). Unet models (b) are trained using augmented target loss function (from axial, coronal and sagittal, respectively). The learned Unet is applied on a new DWI (c1), which could be of lower quality, to result with a predicted tissue segmentation, as well as segmentation prediction probability map per tissue type.
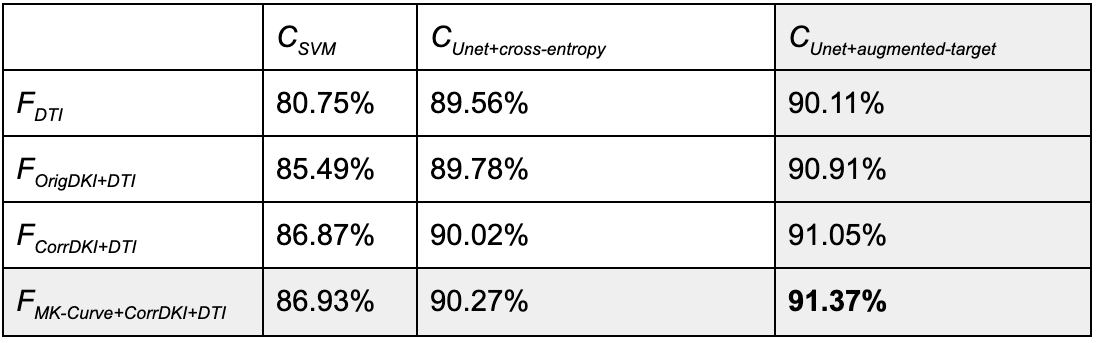
Figure-2: Quantitative segmentation accuracy comparison between different features and classifiers on test HCP data. Features: FDTI - 4 DTI parameters (FA, λ1, 2, 3); FOrigDKI+DTI - 3 DKI parameters (MK, AK, RK) and FDTI without any correction; FCorrDKI+DTI - 3 DKI and 4 DTI parameters after MK-curve correction; FMK-Curve+CorrDKI+DTI - 3 novel MK-curve contracts (ZeroMK-b0, MaxMK-b0, MaxMK) and FCorrDKI+DTI. Classifiers: CSVM - support vector machine; CUnet+cross-entropy - Unet with categorical cross-entropy loss; CUnet+augmented-target - Unet with augmented target loss.
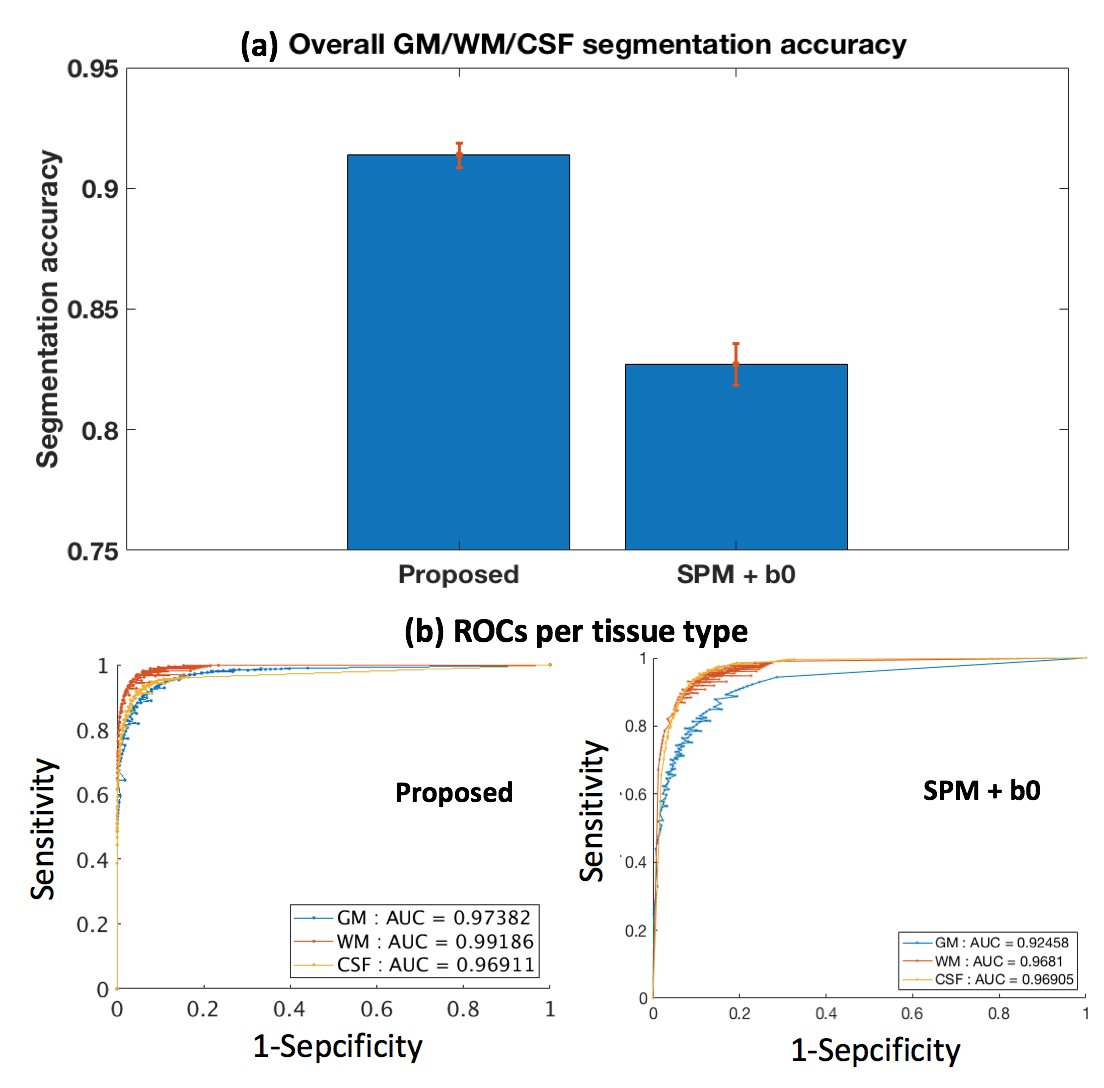
Figure-3: Quantitative comparison to the SPM+b0 method on test HCP data. (a) shows the mean and std of the segmentation accuracies across all test HCP subjects. (b) gives a receiver operating characteristic (ROC) analysis of the segmentation prediction probability map per tissue type, with respect to the SPM+T2w-based segmentation probability maps (Figure-4). Each data point on the ROC curve represents the comparison of binary segmentations, with the thresholds running from 0 and 1. Area under the curve (AUC) is reported for each method and each tissue type in the figure legend.
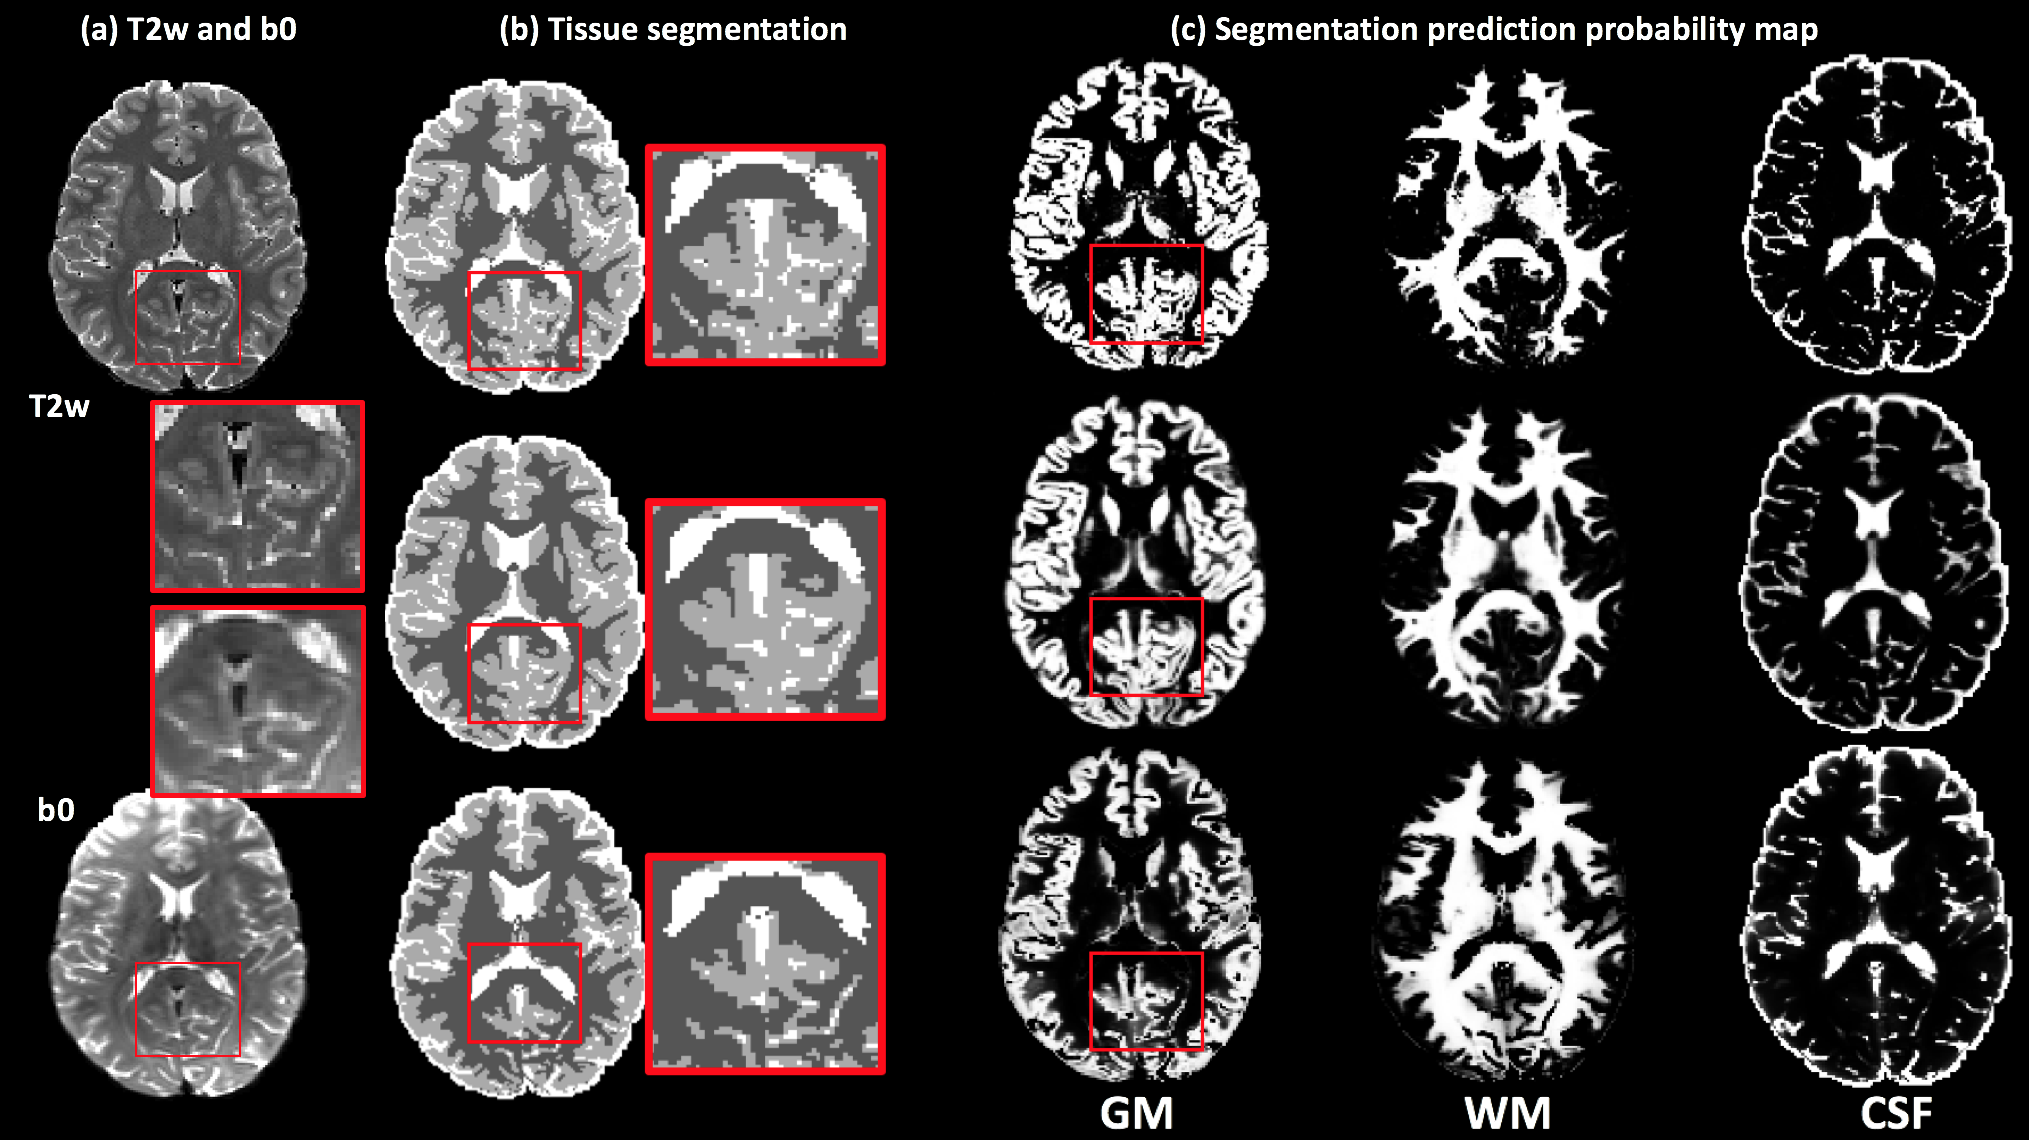
Figure-4: Visual comparison between the proposed method and the SPM+b0 method on one example HCP subject, with respect to the ground truth segmentation computed using the SPM+T2w method. (a) gives the T2w and the b0 images of the example subject. (b) shows the comparison of the overall GM/WM/CSF segmentation. An inset image, enlarging part of the segmentation on the posterior brain, is provided. (c) shows the comparison of the segmentation prediction probability map for each tissue type. The proposed method obtains a visually more similar segmentation to the ground truth than SPM+b0.
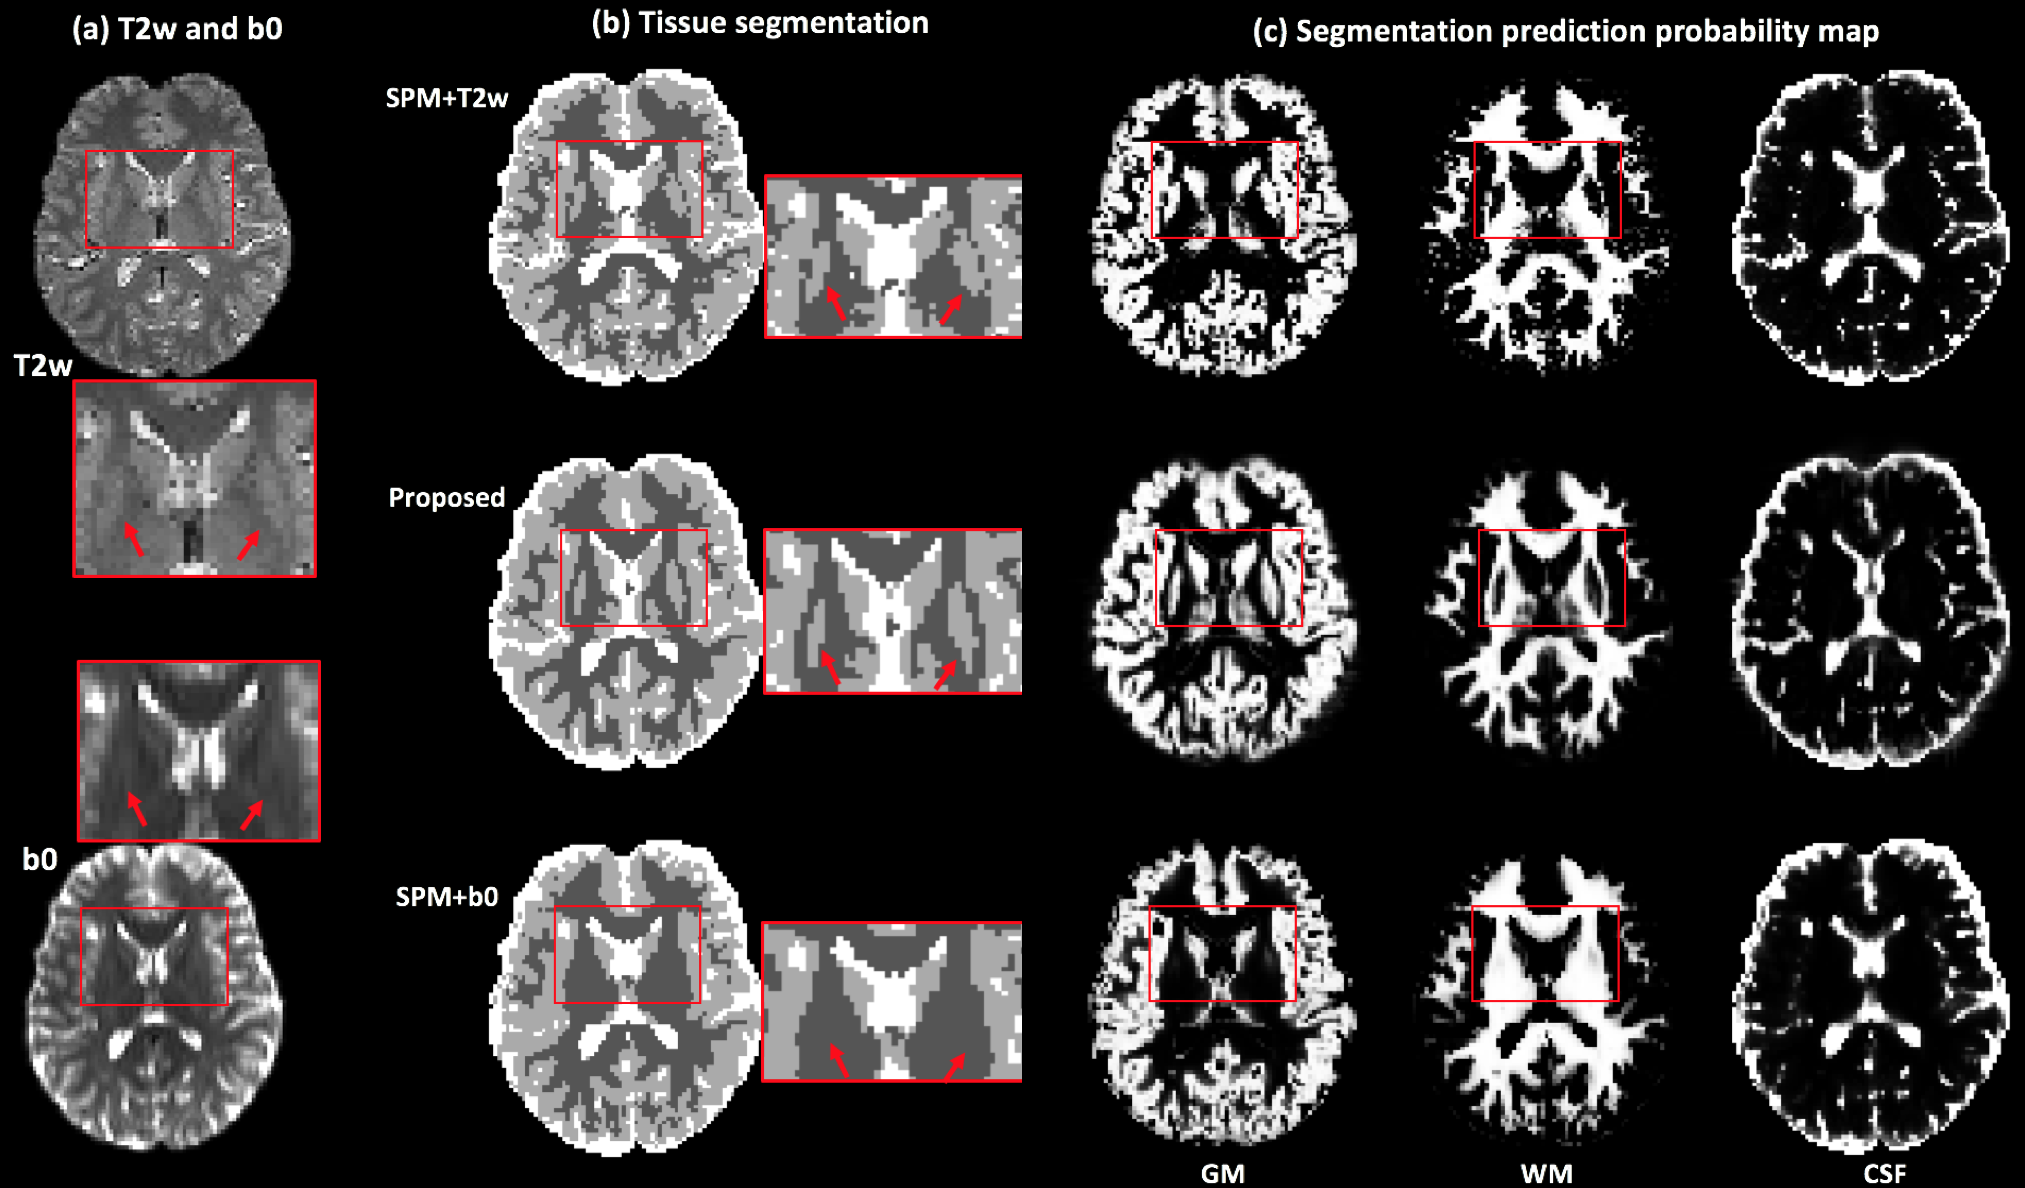
Figure-5: Application of tissue segmentation on clinical acquisition data. (a) gives the T2w and the b0 images of one example subject. (b) shows the tissue segmentation results using different methods, including the anatomical-T2w-based method, the proposed method and the SPM+b0 method. (c) displays the tissue segmentation probability map for each tissue type of the three methods. The red rectangles are used to indicate the position of the subcortical putamen. The SPM+T2w and proposed methods can successfully segment the putamen in both hemispheres, but the SPM+b0 method fails.