4400
Quasi-Diffusion Magnetic Resonance Imaging (QDI): a fast, high b-value diffusion imaging technique1Neurosciences, St George's, University of London, London, United Kingdom, 2Northwerstern University, Chicago, IL, United States, 3St George's University Hospitals NHS Foundation Trust, London, United Kingdom, 4University of Illinois at Chicago, Chicago, IL, United States, 5National Physical Laboratory, Teddington, United Kingdom, 6University College London, London, United Kingdom
Synopsis
We present a new ultra-high b-value diffusion magnetic resonance imaging (dMRI) methodology, Quasi-Diffusion Imaging (QDI). The QDI technique includes a tensor representation of the dMRI data. We show that high contrast to noise images representing standard and non-Gaussian diffusion measures are obtainable in 1 to 4 minutes. QDI entropy maps show pathological contrast similar to Diffusional Kurtosis Imaging (DKI) in stroke and brain tumours. In addition, QDI overcomes the b-value limitations of DKI.
Introduction
There is a clinical need for fast, high contrast, diffusion magnetic resonance imaging (dMRI) techniques that are sensitive to changes in tissue structure and provide diagnostic signatures at the early stages of disease. Here we describe a new way to minimise the acquisition of multi-shell b-value diffusion data, Quasi-Diffusion MRI (QDI). QDI is based on a special case of the Continuous Time Random Walk (CTRW) model of diffusion dynamics1,2 and assumes presence of non-Gaussian diffusion properties within tissue microstructure. We present a framework for multi-directional diffusion gradient acquisition and data processing that allows computation of Quasi-Diffusion-Weighted Imaging (QDWI) and Quasi-Diffusion Tensor Imaging (QDTI) maps. We show that QDI provides excellent tissue contrast using standard clinical MRI gradients in short acquisition times. Finally, we apply QDI to 3 patient cases.Methods
TheoryWe propose a simplification of the CTRW model1,2 by a coupling of the $$$\alpha$$$ (waiting time) and $$$\beta$$$ (step length) exponents. Mean squared displacement of diffusing particles in the CTRW model is given by $$$<x^2>\sim t^{2\alpha/\beta}$$$ and Gaussian diffusion by $$$\alpha=1$$$ and $$$\beta=2$$$, such that $$$<x^2>\sim ~t$$$. If the same heuristic Gaussian scaling relation of position with time continues to hold for non-Gaussian diffusion then $$$<x^2>\sim t$$$ and $$$2\alpha/\beta=1$$$. In this case the model represents non-Gaussian diffusion which is not superdiffusive or subdiffusive; instead we have a quasi-diffusion process2,3. By substitution of $$$2\alpha/\beta=1$$$ in the CTRW dMRI equation4 we have,
$$
\begin{align*}
p(q,\bar{\Delta}) &=\sum_{k=0}^{\infty} \frac{(-D_{\alpha,2\alpha}q^{2\alpha}\bar{\Delta}^\alpha)^k}{\Gamma(\alpha k+1)} \\
&=\sum_{k=0}^{\infty} \frac{(-1)^k (D_{1,2} b)^{\alpha k}}{\Gamma(\alpha k+1)}[Eq.1]
\end{align*}
$$
where signal attenuation is parameterised by $$$b=q^2\bar{\Delta}$$$ with $$$\bar{\Delta}=\Delta-\delta/3$$$ (in s) and the diffusion coefficient, $$$D_{1,2}$$$, is in conventional units of mm2s-1. The fractional a exponent represents a range of properties from Gaussian diffusion ($$$\alpha=1$$$) through non-Gaussian (quasi) diffusion ($$$0<\alpha<1$$$). Specifically, QDI parameterises the signal decay by b-value according to the rate of decay, $$$D_{1,2}$$$, and the shape of the power law tail, $$$\alpha$$$. Crucially $$$\alpha$$$ is analogous to the Diffusional Kurtosis Imaging (DKI) $$$\kappa$$$ measure5 as it represents non-Gaussian diffusion dynamics. Estimation of $$$D_{1,2}$$$ and $$$\alpha$$$ along a single diffusion gradient direction requires a minimum acquisition of a b=0 s mm-2 image and 2 non-zero b-value dMRIs.
QDI acquisition and pre-processing
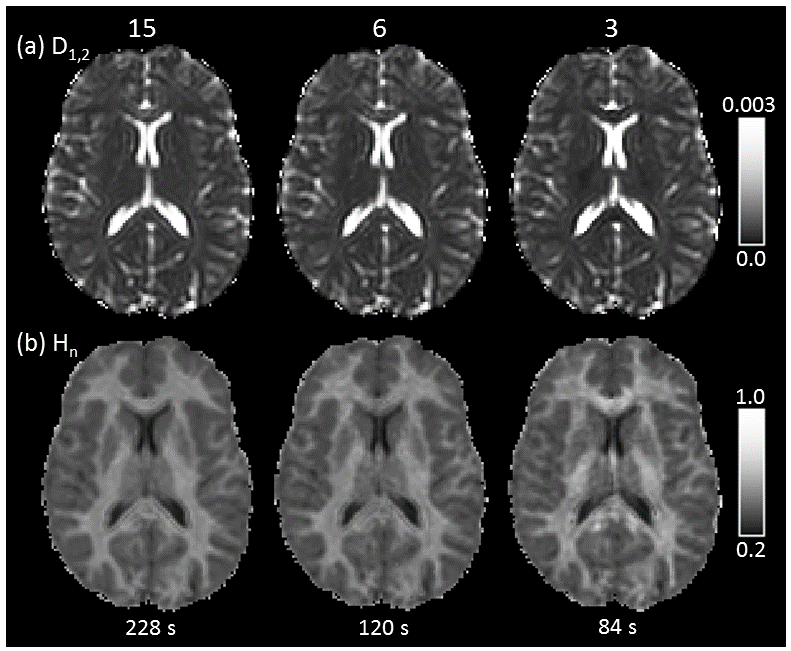
Our QDI protocol provides voxel resolutions similar to conventional clinical DWI (1.5mm×1.5mm×5mm over 22 axial slices) and utilises ultra-high b-value tissue contrast (TE=90ms, TR=6000ms, b=0, 1100 and 5000 s mm-2, $$$\delta$$$=23.5ms, $$$\Delta$$$=43.9ms). Data were acquired on a 3T Philips Achieva Dual TX system. QDWI was acquired in 3 orthogonal diffusion gradient directions (acquisition time 84s) and QDTI in 6 and 15 diffusion directions equally spaced on the hemisphere (acquisition times 120s and 228s, respectively). dMRI acquisitions were denoised6 and corrected for motion and eddy current distortions7.
QDI computation
No image smoothing was performed prior to parameter estimation. $$$D_{1,2}$$$ and $$$\alpha$$$ were estimated in each voxel along each diffusion gradient direction using the Levenberg-Marquadt algorithm and Padé approximation to rapidly estimate Eq.1 and its derivatives8. Normalised entropy, $$$H_{n}$$$, was computed along each parameterised decay curve4,9. QDWI data was averaged in each b-value shell prior to model fitting and computation of mean $$$D_{1,2}$$$, $$$\alpha$$$ and $$$H_{n}$$$ maps. For QDTI, model fitting was performed in each diffusion direction and mean, axial, radial and anisotropy maps were computed from $$$D_{1,2}$$$, $$$\alpha$$$ and $$$H_{n}$$$ tensors10. Figure 1 shows QDI model fits within representative grey and white matter voxels.
Participants
Six healthy participants were recruited (age 28±8 years). Three patients were also recruited, one with incidental findings of an acute ischaemic infarct (age 75 years), and two brain tumour patients including a WHO Grade II astrocytoma (age 40 years), and a WHO Grade IV glioblastoma (age 58 years).
Results
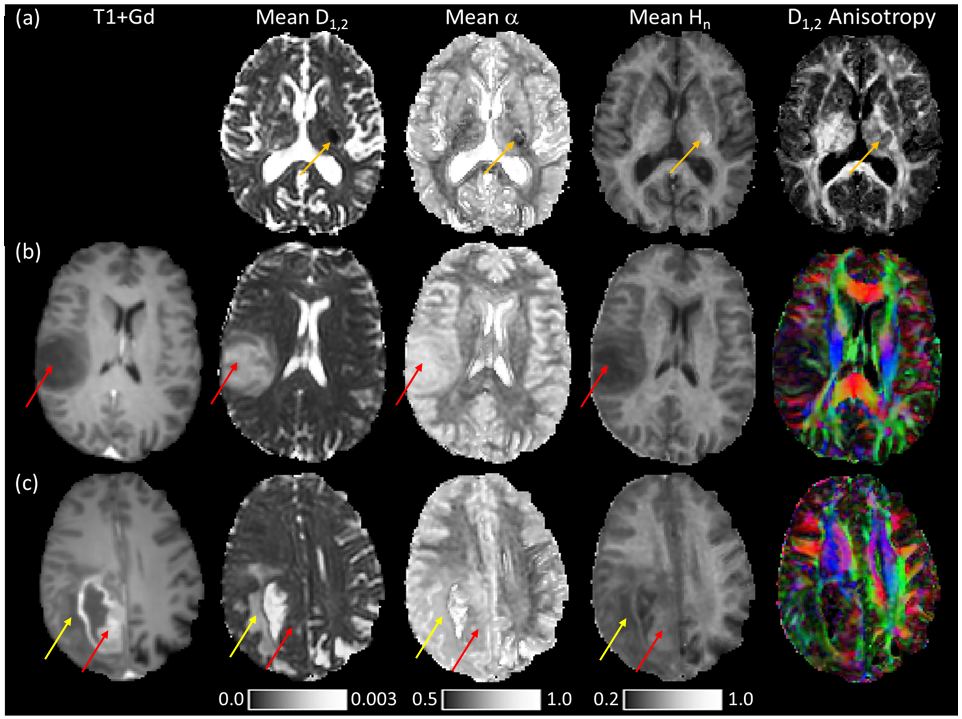
QDI maps and healthy $$$D_{1,2}$$$, $$$\alpha$$$ and $$$H_{n}$$$ values are shown for 15 diffusion gradient direction QDTI in Figure 2 and Table 1. $$$D_{1,2}$$$ maps exhibit similar tissue contrast to conventional dMRI, whereas $$$H_{n}$$$ maps provide tissue contrast analogous to DKI $$$\kappa$$$. Grey and white matter are characterised by non-Gaussian diffusion with greater non-Gaussianity in white matter. Excellent tissue contrast is observed. Figure 3 shows QDI maps computed from short dMRI acquisitions indicating preservation of tissue contrast.Figure 4a shows an acute infarct with low $$$D_{1,2}$$$ and $$$\alpha$$$, and high $$$H_{n}$$$, corresponding to an increase in restriction of the diffusion environment. The Grade II core (Figure 4b) was characterised by high $$$D_{1,2}$$$ and $$$\alpha$$$, and low $$$H_{n}$$$, and likely represents an infiltrative mix of tumour and normal brain tissue with loss of normal tissue structure. The Grade IV tumour core exhibited low $$$D_{1,2}$$$ and $$$\alpha$$$, and high $$$H_{n}$$$ in regions corresponding to high tumour cellularity where the active angiogenic tumour core is indicated by blood brain barrier breakdown shown by gadolinium contrast enhancement on T1-weighted images (Figure 4c).
Discussion and conclusions
We have shown that QDI generates images with excellent tissue contrast within clinically acceptable acquisition times of between 84 and 228 seconds. QDI provides maps with healthy and pathological tissue contrast similar to DKI5,11,12 but does so without the limitations of a maximum b-value5 allowing exploration of ultra-high b-value dMRI, including anisotropy. Our initial findings suggest that QDI may be added to routine conventional dMRI acquisitions allowing simple translation to the clinical arena.Acknowledgements
Funding for this study was provided by a St George’s, University of London Innovation Award. Additional funding for clinical data acquisition was provided by Innovate UK grant 103353 and a Kings College London Alzheimer’s Research UK Network Centre pump priming award.
References
[1] Metzler, R., Klafter, J., 2000. The random walk’s guide to anomalous diffusion: a fractional dynamics approach. Phys. Rep. 339, 1–77.
[2] Klages, R., Radons, G., Sokolov, I.M., 2008. Anomalous transport: foundations and applications. Wiley, Weinheim.
[3] Dynkin E.B., 1965. Markov Processes, Volume 1, Springer.
[4] Ingo, C., Magin, R.L., Colon-Perez, L., Triplett, W., Mareci, T.H., 2014b. On random walks and entropy in diffusion-weighted magnetic resonance imaging studies of neural tissue: Random Walks and Entropy in Diffusion-Weighted MRI. Magn. Reson. Med. 71, 617–627.
[5] Jensen, J.H., Helpern, J.A., Ramani, A., Lu, H., Kaczynski, K., 2005. Diffusional kurtosis imaging: The quantification of non-gaussian water diffusion by means of magnetic resonance imaging. Magn. Reson. Med. 53, 1432–1440.
[6] Veraart, J., Novikov, D.S., Christiaens, D., Ades-Aron, B., Sijbers, J., Fieremans, E., 2016. Denoising of diffusion MRI using random matrix theory. Neuroimage. 142:394-406.
[7] Andersson, J.L.R., Graham, M.S., Zsoldos, E., Sotiropoulos, S.N., 2016. Incorporating outlier detection and replacement into a non-parametric framework for movement and distortion correction of diffusion MR images. NeuroImage 141, 556–572.
[8] Ingo, C., Barrick, T.R., Webb, A.G., Ronen, I., 2017. Accurate Padé Global Approximations for the Mittag-Leffler Function, Its Inverse, and Its Partial Derivatives to Efficiently Compute Convergent Power Series. Int. J. Appl. Comput. Math. 3, 347–362.
[9] Ingo, C., Magin, R., Parrish, T., 2014a. New Insights into the Fractional Order Diffusion Equation Using Entropy and Kurtosis. Entropy 16, 5838–5852.
[10] Hall, M.G., Barrick, T.R., 2012. Two-step anomalous diffusion tensor imaging: Two-step Anomalous Diffusion Tensor Imaging. NMR Biomed. 25, 286–294.
[11] Jensen, J.H., 2018. Advanced DWI Methods for the Assessment of Ischemic Stroke. Am. J. Roentgenol. 210, 728–730.
[12] Falk Delgado, Anna, Nilsson, M., van Westen, D., Falk Delgado, Alberto, 2018. Glioma Grade Discrimination with MR Diffusion Kurtosis Imaging: A Meta-Analysis of Diagnostic Accuracy. Radiology 287, 119–127.
Figures
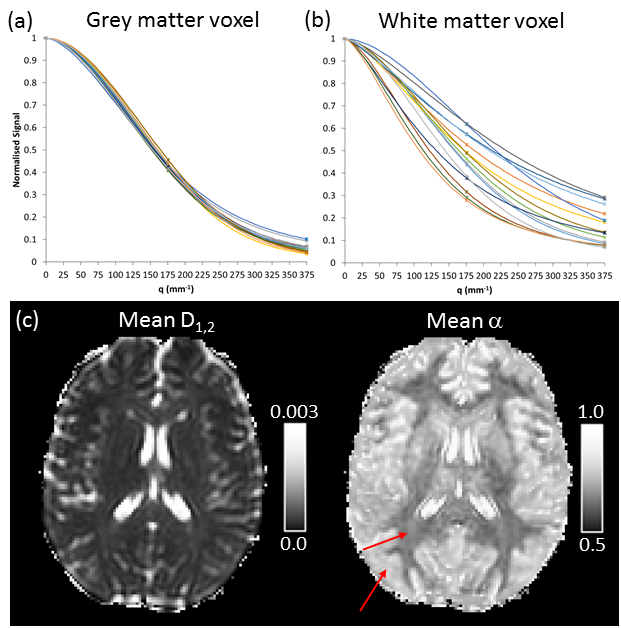
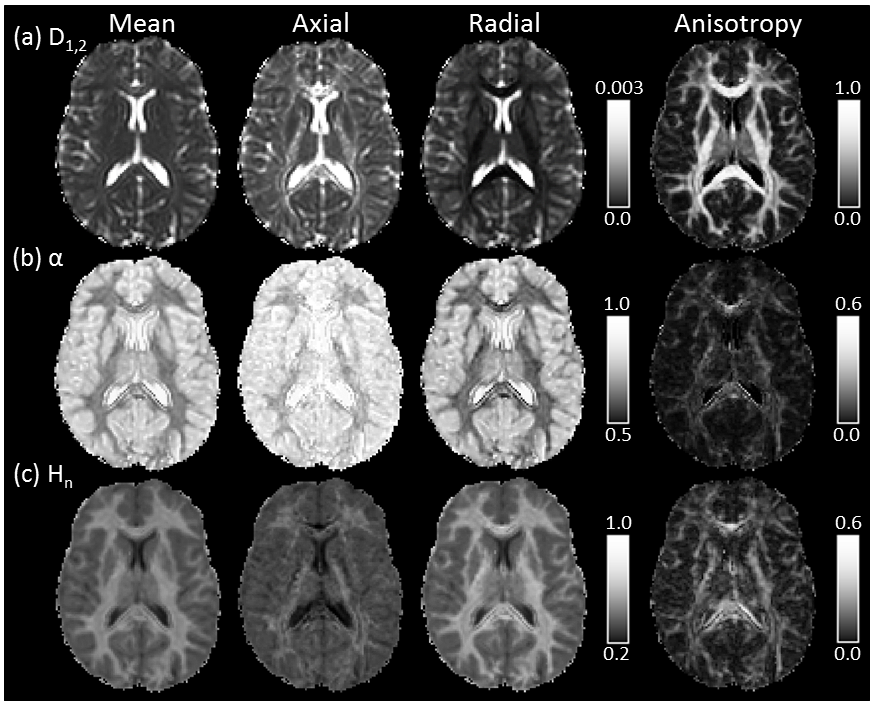
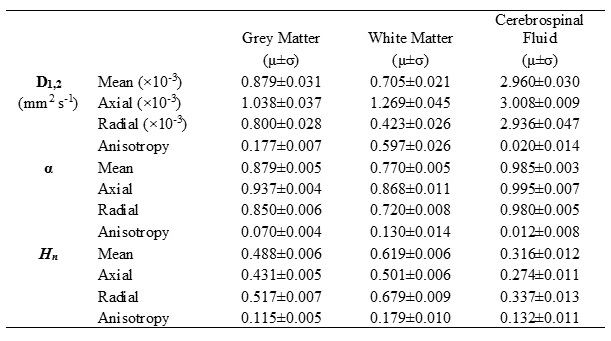
Table 1: Mean ($$$\mu$$$) and standard deviation ($$$\sigma$$$) values computed from QDI data for healthy grey matter, white matter and lateral ventricle cerebrospinal fluid. Measurements were computed from the 15 diffusion gradient direction QDTI data. Mean, axial, radial and anisotropy measurements are presented for $$$D_{1,2}$$$, $$$\alpha$$$, and $$$H_{n}$$$.