4396
Improved estimation of diffusion tensors by noise-corrected curve fitting with adaptive neighborhood regularization
Li Guo1,2,3, Xinyuan Zhang2,3, Changqing Wang4, Jian Lyu2,3, Yingjie Mei5, Ruiliang Lu1, Mingyong Gao1, and Yanqiu Feng2,3
1Department of MRI, The First People’s Hospital of Foshan (Affiliated Foshan Hospital of Sun Yat-sen University), Foshan, China, 2School of Biomedical Engineering, Southern Medical University, Guangzhou, China, 3Guangdong Provincial Key Laboratory of Medical Image Processing, Southern Medical University, Guangzhou, China, 4School of Biomedical Engineering, Anhui Medical University, Hefei, China, 5Philips Healthcare, Guangzhou, China
1Department of MRI, The First People’s Hospital of Foshan (Affiliated Foshan Hospital of Sun Yat-sen University), Foshan, China, 2School of Biomedical Engineering, Southern Medical University, Guangzhou, China, 3Guangdong Provincial Key Laboratory of Medical Image Processing, Southern Medical University, Guangzhou, China, 4School of Biomedical Engineering, Anhui Medical University, Hefei, China, 5Philips Healthcare, Guangzhou, China
Synopsis
The noncentral Chi noise in magnitude image may significantly affect the reliability of quantitative analysis in diffusion-weighted (DW) magnetic resonance imaging (MRI), especially at high b-value and/or higher order modeling of diffusion signal such as diffusion kurtosis imaging (DKI). We developed a novel first-moment noise-corrected curve fitting model with adaptive neighborhood regularization (MN1CM-ANR) algorithm for DKI. By fitting the signal to its first-moment (i.e. the expectation of the signal), MN1CM-ANR can effectively compensate the bias due to the noncentral Chi noise. In addition, by exploiting the neighboring pixels to regularize the curve fitting, MN1CM-ANR can reduce the measurement variance.
Purpose
Diffusion-weighted (DW) magnetic resonance imaging (MRI) remains challenging as a result of the low signal-to-noise (SNR). Multichannel array coils are usually applied, and the magnitude reconstruction results in non-central Chi noise distribution. This noise may introduce significant bias and variance in the estimated diffusion parameters, especially at high b-values and/or higher order modeling of diffusion signal such as diffusion kurtosis imaging (DKI) 1. The goal of this work is to propose a novel curve fitting model with adaptive neighborhood regularization for DKI, which can improve the accuracy and precision of DKI parameters.Methods
To reduce the bias in DKI parameters, a first-moment noise-corrected (MN1CM) curve fitting model was adopted: fitting the DKI signals at each pixel to its first-moment (i.e. the expectation of the signals). The first-moment of the measured signal SM can be formulated as 2:$$E(S_{M})=\sigma\sqrt{\frac{\pi}{2}}\frac{(2L-1)!!}{2^{L-1}(L-1)!}1F1(-\frac{1}{2};L;-(\frac{S^{DKI}}{\sqrt{2}\sigma})^{2}),{~~~~~~}(1)$$
where σ is the standard deviation of noise; L is the number of receiver coils; !! is the double factorial: n!! = n(n-2)(n-4)…; 1F1 is the confluent hyper-geometric function; SDKI represents the theoretical DKI model signal.
To further reduce the variance in DKI parameter estimates, an adaptive neighborhood regularization (ANR) was incorporated into the MN1CM curve fitting model: neighboring pixels with similar DKI signals were simultaneously fitted to reduce the effect of noise and the weighting of each neighboring pixel was adaptively determined based on the interpixel signal similarity. The MN1CM curve fitting with ANR (named as MN1CM-ANR) algorithm can be given by minimizing the following objective function:
$$\min_{\theta}||S_{x_{i}}-f(\theta)||_2^2+\sum_{x_{j}\in_{W_{i}},j\neq{i}}\alpha(x_{i},x_{j})||S_{x_{i}}-f(\theta)||_2^2,\forall{x_{i}}\in{I},{~~~~~~}(2)$$
where the first term is the data fidelity, and the second one is the regularization. θ denotes the parameter vector containing the non-DW signal S0, diffusion tensor D, and kurtosis tensor K; $$$S_{x_{i}}$$$ is the vector representing the measured DKI signals at target pixel xi in image domain I; f(·) is the MN1CM curve fitting model (right-hand in Eq. (1)); xj is the neighboring pixel in search window Wi around target pixel xi; α(xi,xj) is the regularization parameter and was adaptively calculated as follows 3,4:
$$\alpha(x_{i},x_{j})=exp(-\frac{||S_{x_{i}}-S_{x_{j}}||_2^2}{12h^{2}}),\forall{x_{j}}\in{W_{i}}{~~}and {~~}x_{j}\neq{x_{j}},{~~~~~~}(3)$$
where h is the smoothing parameter and is related to the noise level (h = βσ, where β is a tuning parameter). Nonlinear optimization was implemented to solve Eq. (2). A rapid look-up table method was used to accelerate the calculation of the confluent hypergeometric function 5.
To evaluate the performance of the proposed MN1CM-ANR algorithm, simulation was performed based on the MASSIVE database 6. First, the reference D, K and tensor-derived parameters were estimated using nonlinear least square (NLS) estimator. Second, the estimated D, K were used to simulate the reference data with 10 non-DW signal and DW signal on four shells with b-values of 500 s/mm2, 1000 s/mm2, 2000 s/mm2, and 3000 s/mm2. The number of diffusion gradient directions per shell is 36, 50, 50, and 50. Third, the reference serial images were used to generate noncentral Chi (L = 4) distributed serial images with SNR of 15.
We compared the following methods using the simulation: 1) NLS, curve fitting without denoising and noise-correction; 2) NLM+NLS, curve fitting after non-local means (NLM) denoising 7; 3) MN1CM, noise-correction curve fitting without denoising; 4) NLM+MN1CM, noise-correction curve fitting after denoising; 5) MN1CM-ANR, simultaneous noise-correction curve fitting and denoising. In this study, the search window Wi was set to 9×9 and the smoothing parameter h was set to 1.5σ for MN1CM-ANR. With regard to the NLM+NLS, NLM+MN1CM, the optimal h was selected by visual inspection of the denoised image.
Results
Figures 1 and 2 show the fitted fractional anisotropy (FA) maps, colored FA maps, mean diffusivity (MD) maps, mean kurtosis (MK) maps and their corresponding error maps. Numbers in bottom right are root-mean-square-error (RMSE). The NLS and MN1CM methods produced noisy maps. Although the NLM+NLS, and NLM+MN1CM methods produced maps that are less affected by the noise, measurement errors were obvious. The MN1CM-ANR algorithm effectively reduced the effect of noise on maps and reduced the measurement errors. Figure 3 presents the FA, MD and MK quantification errors for all the algorithms. The FA and MK errors of MN1CM-ANR are more concentrated around zeros with smaller bias (solid line) and narrower variance (dashed line).Discussion
We developed a novel first-moment noise-corrected curve fitting model with adaptive neighborhood regularization (MN1CM-ANR) algorithm for DKI. MN1CM-ANR can simultaneously correcting the noise bias and exploiting information redundancy across spatial domain and along diffusion encoding directions. Simulation results demonstrated that the MN1CM-ANR method can successfully mitigate the effect of noise on DKI parameters and reduced the bias and variance of the estimated diffusion parameters. Note that NLM+MN1CM also used both the noise-corrected curve fitting and neighborhood pixels to reduce the effect of noise but in a two-stage pattern, which may induce the potential error propagation from the denoising stage to the curve fitting stage. We expect to further improve MN1CM-ANR by incorporating outlier detection scheme 8,9 to deal with the physiological noise such as artifacts caused by motion or system instabilities in the future.Conclusion
The MN1CM-ANR can reduce the effect of noise on DKI parameters with improved accuracy and precision.Acknowledgements
No acknowledgement found.References
[1] Jensen JH, et al. “Diffusional Kurtosis Imaging: The Quantification of Non-Gaussian Water Diffusion by Means of Magnetic Resonance Imaging’’. Magnetic Resonance in Medicine 53(6): 1432-1440 (2005). [2] Feng YQ, et al. “Improved MRI R2* Relaxometry of Iron-Loaded Liver with Noise Correction”. Magnetic Resonance in Medicine 70(6): 1765-1774 (2013). [3] Zhang XY, et al. “Improved Liver R2* Mapping by Averaging Decay Curves”. Scientific Reports doi: 10.1038/s41598-017-05683-5 (2017). [4] Wang CQ, et al. “Improved Liver R*2 Mapping by Pixel-Wise Curve Fitting With Adaptive Neighborhood Regularization” Magnetic Resonance in Medicine 80(2): 792-801 (2018). [5] Wang CQ, et al. “Rapid Look-Up Table Method for Noise-Corrected Curve Fitting in the R2* Mapping of Iron Loaded Liver”. Magnetic Resonance in Medicine 73(2): 865-871 (2015). [6] Froeling M, et al. ““MASSIVE” Brain Dataset: Multiple Acquisitions for Standardization of Structural Imaging Validation and Evaluation”. Magnetic Resonance in Medicine 77(5): 1797-1809 (2017). [7] Wiest-Daesslé N, et al. “Non-Local Means Variants for Denoising of Diffusion-Weighted and Diffusion Tensor MRI”. Medical Image Computing and Computer Assisted Intervention. 10(Pt2): 344-351 (2007). [8] Chang LC, et al. “RESTORE: Robust Estimation of Tensors by Outlier Rejection”. Magnetic Resonance in Medicine 53(5): 1088-1095 (2005). [9] Collier Q, et al. “Iterative Reweighted Linear Least Squares for Accurate, Fast, and Robust Estimation of Diffusion Magnetic Resonance Parameters”. Magnetic Resonance in Medicine 73(6): 2174-2184 (2015).Figures
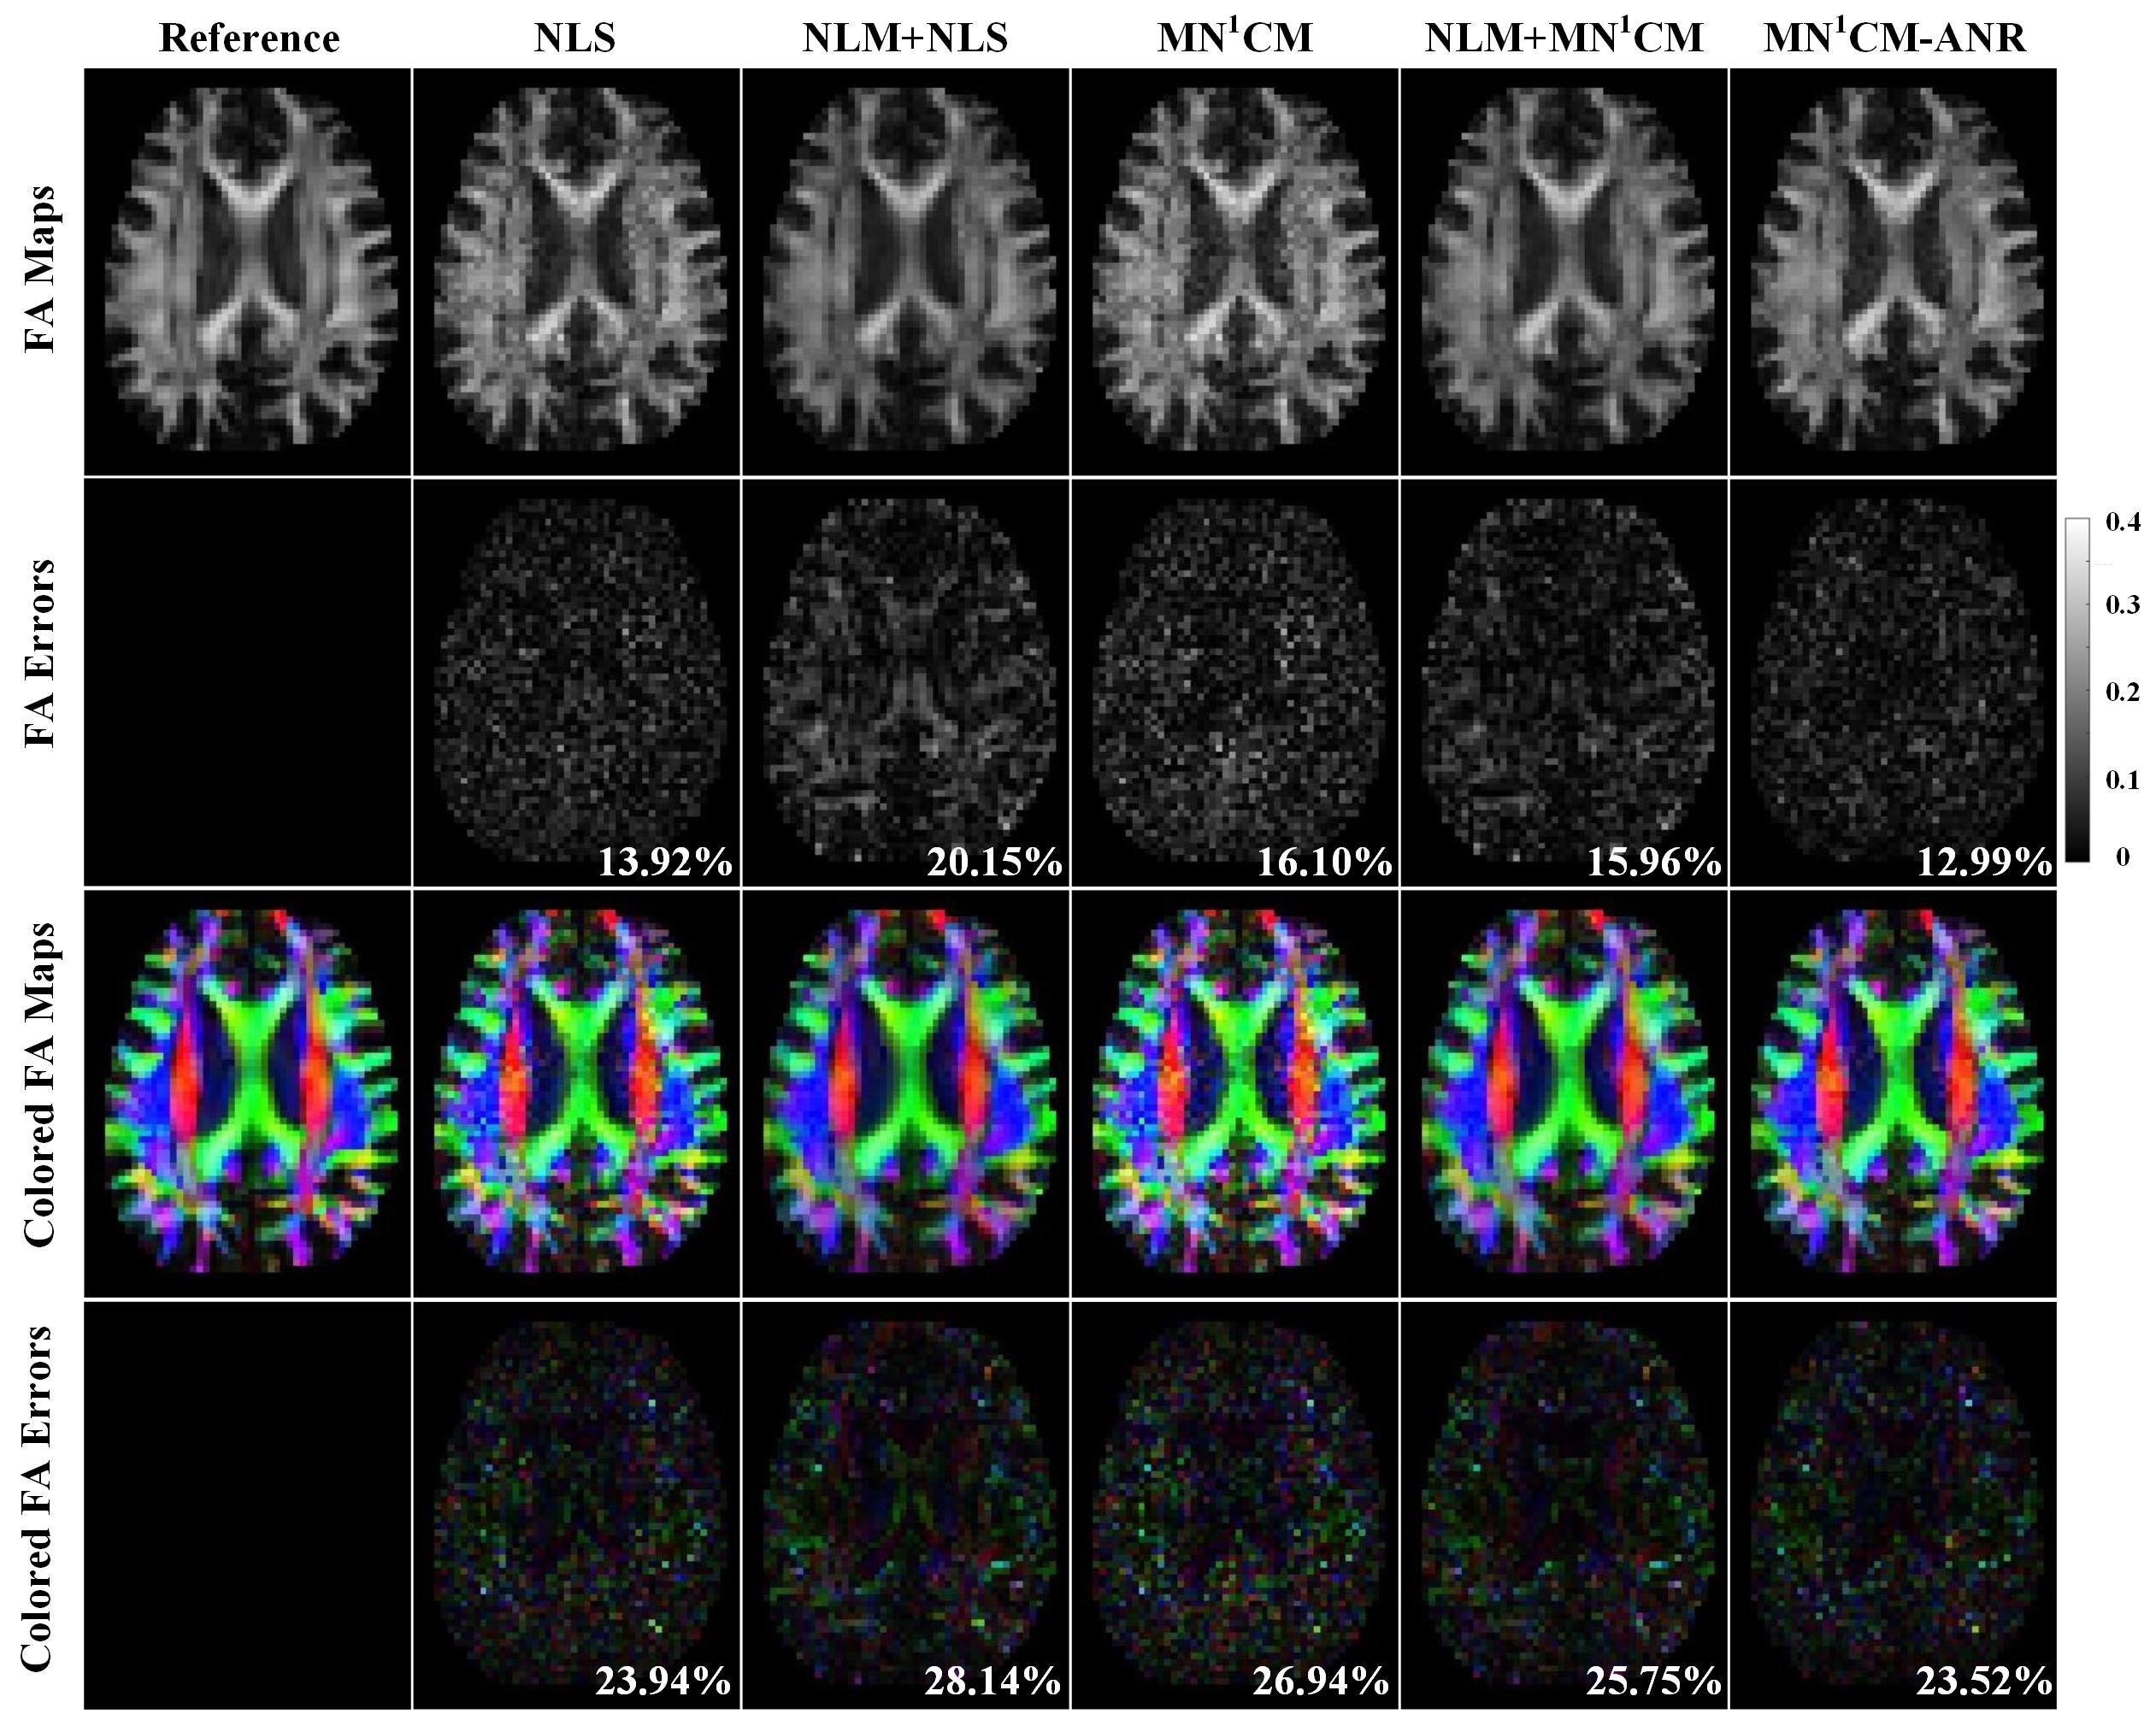
Figure
1. FA, colored FA, and the corresponding error maps of the NLS, NLM+NLS, MN1CM,
NLM+MN1CM, MN1CM-ANR. The reference maps are presented in
the first column. The error images show the absolute difference between the
reference map and the estimated map. The color is based on the orientation of
the primary eigenvector of diffusion tensors: red for right-left, green for
anterior-posterior, and blue for inferior-superior. Numbers in bottom right
represent RMSE.
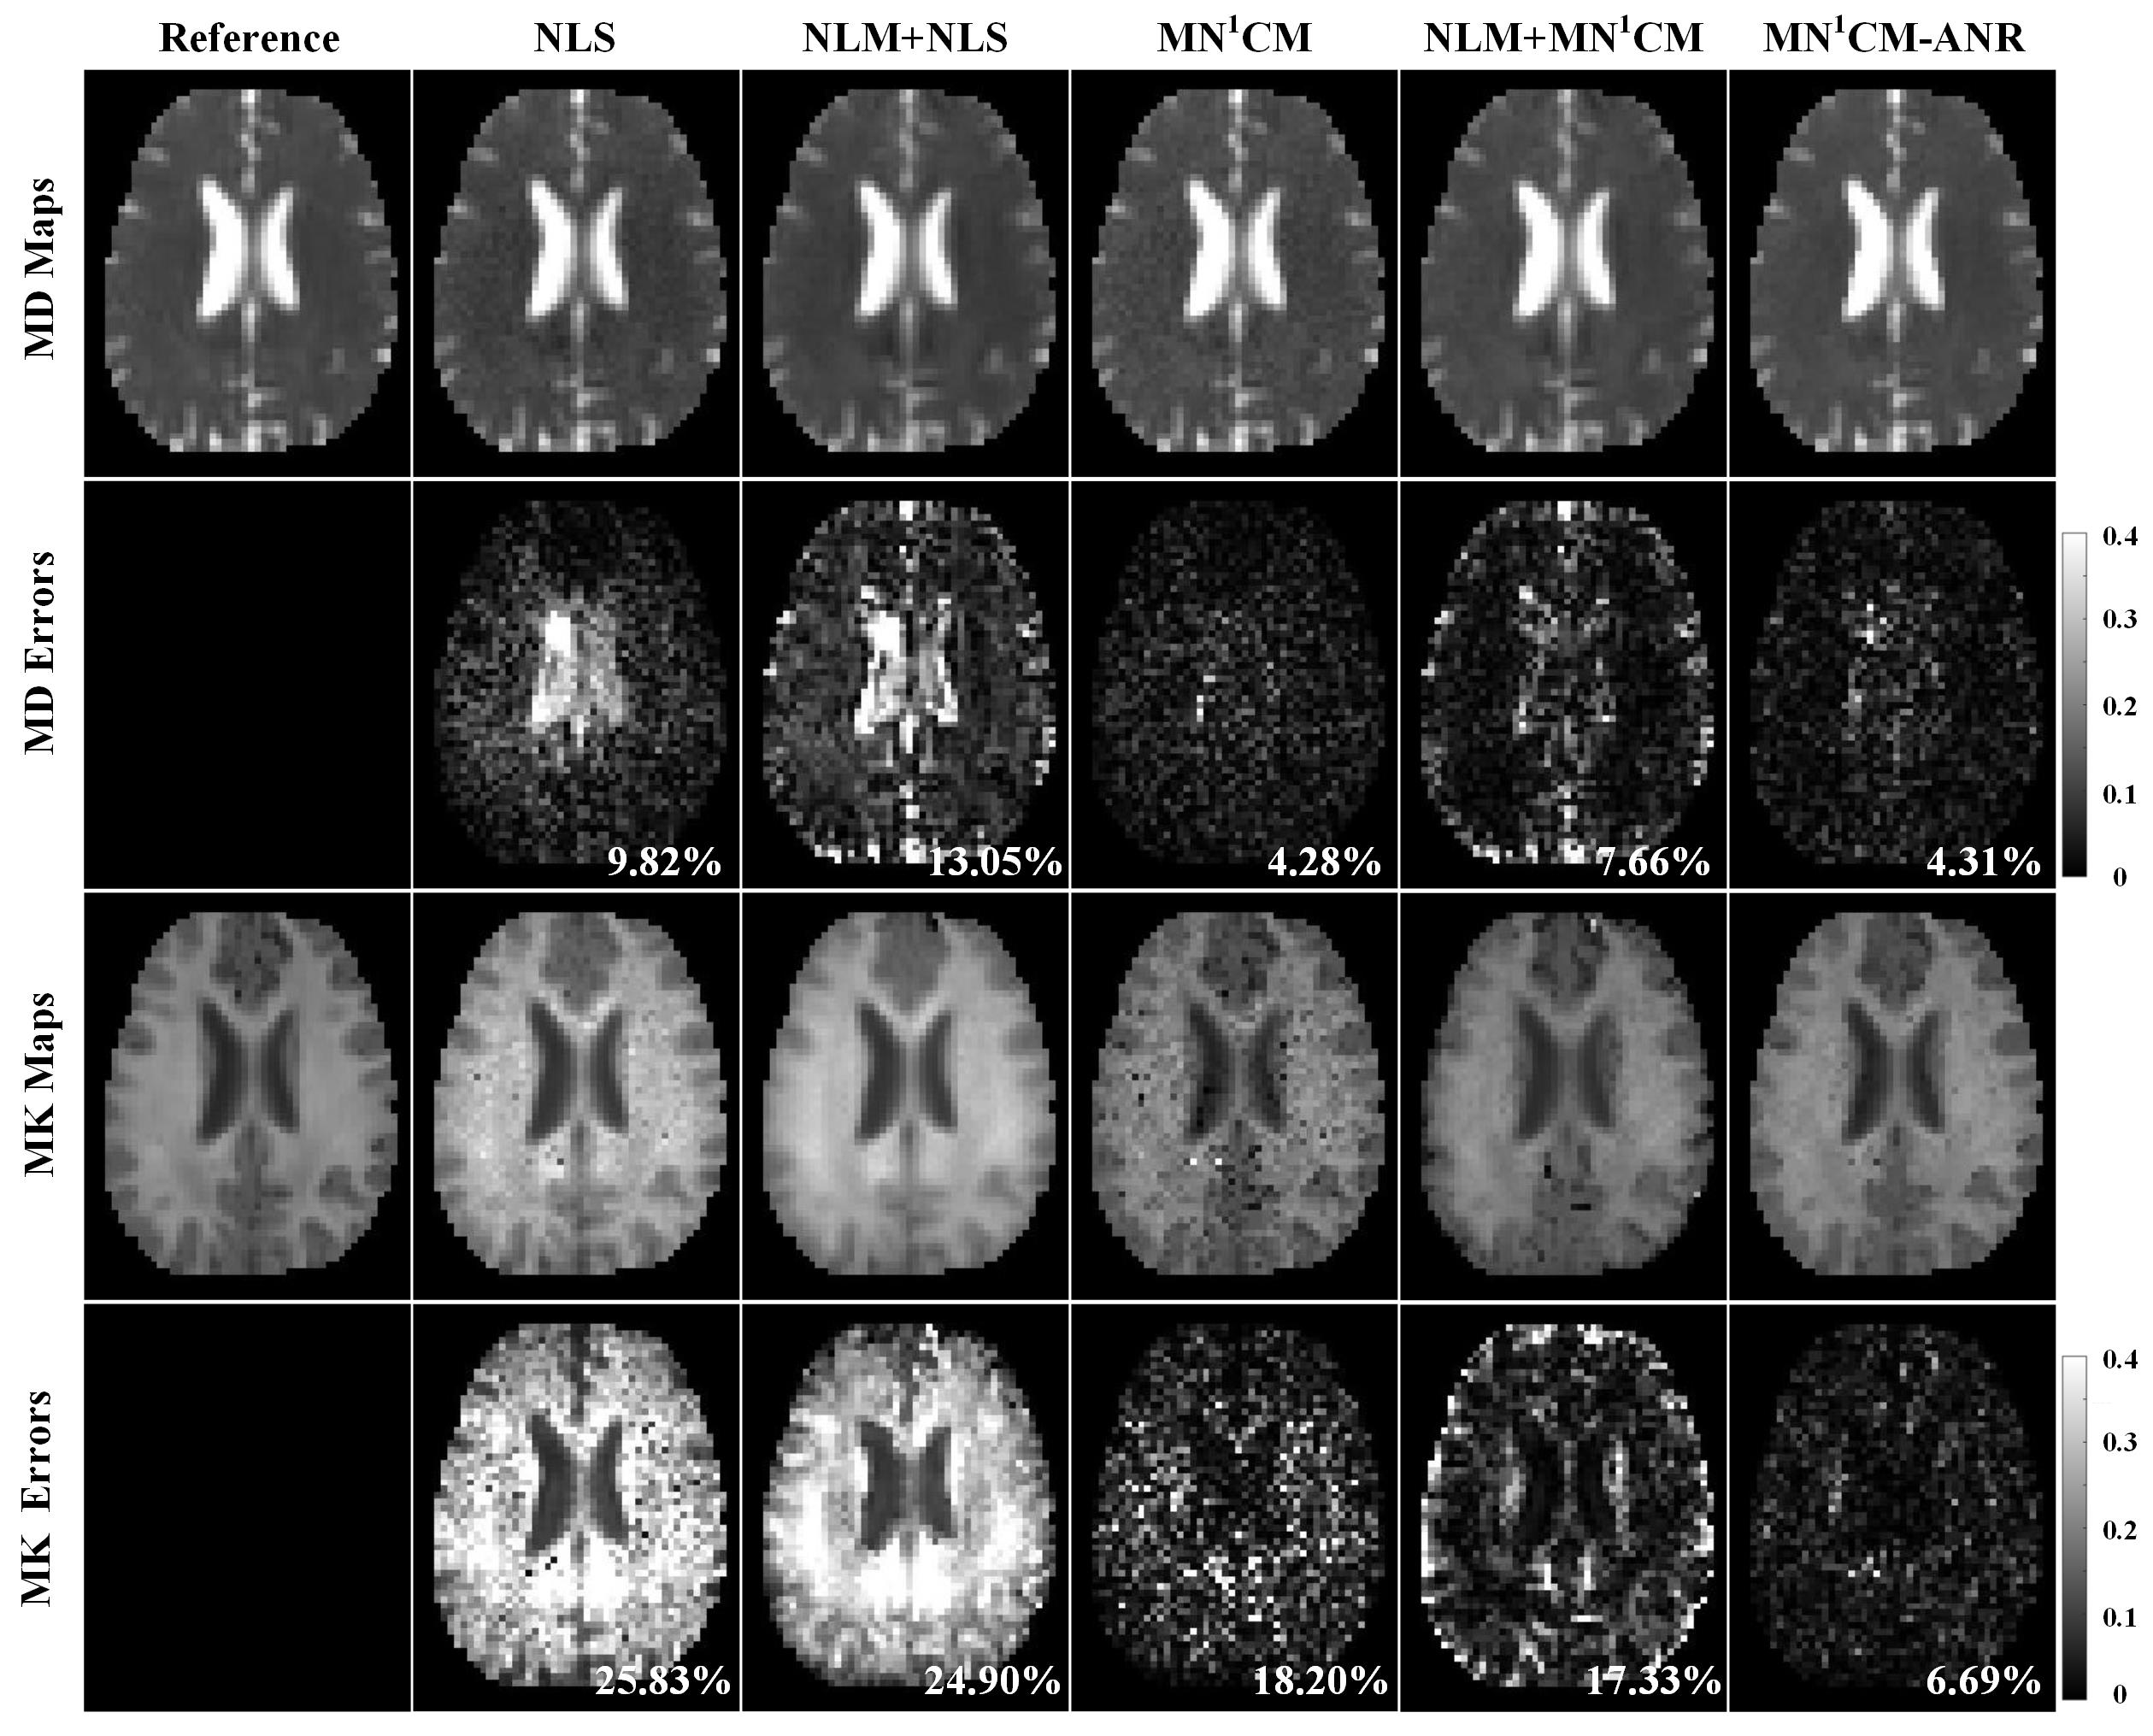
Figure
2. MD, MK, and the corresponding error maps of the NLS, NLM+NLS, MN1CM,
NLM+MN1CM, MN1CM-ANR. The reference maps are presented in
the first column. The error images show the absolute difference between the
reference map and the estimated map. Numbers in bottom right represent RMSE.
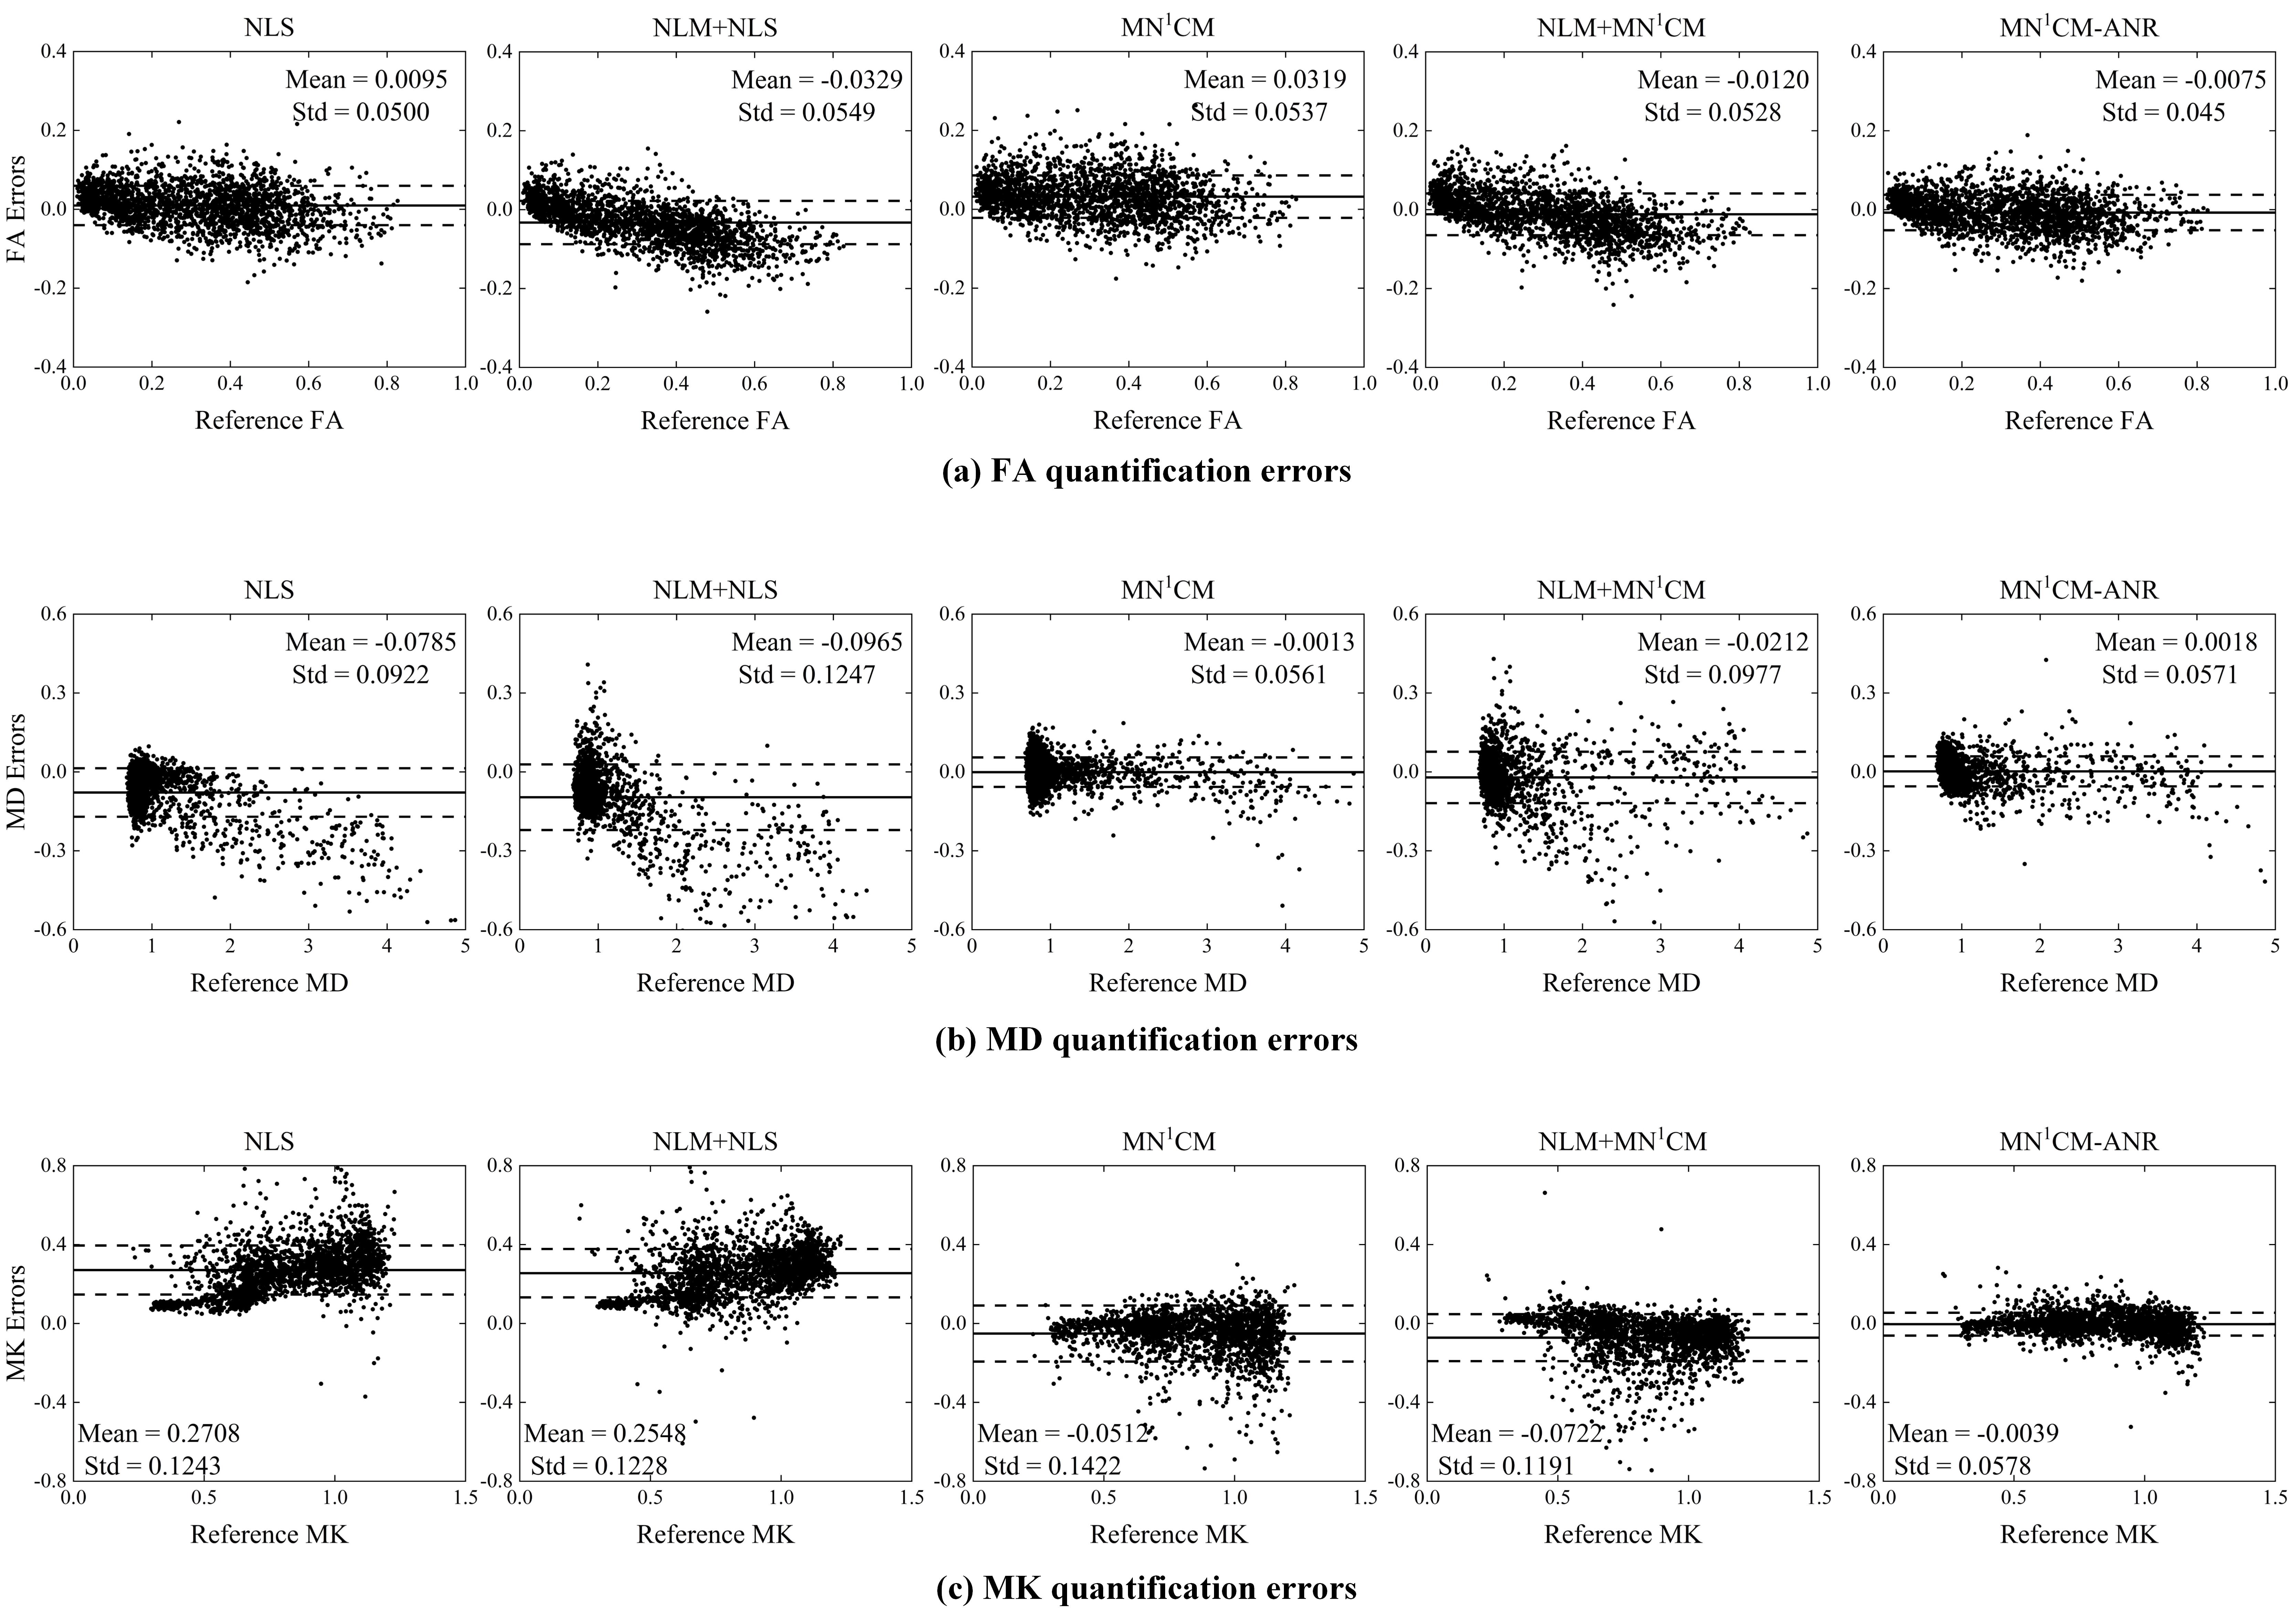
Figure
3. Quantitative comparison of FA, MD, and MK estimation. (a) FA quantification
errors. (b) MD quantification errors. (c) MK quantifications. The bias (solid
line) and the standard variation (dash line) are also shown.