4392
Diffusion tensor imaging in identificationof stageIendometrial carcinoma and endometrial poly
Xuedong Wang1, Ailian Liu1, ShiFeng Tian1, Lizhi Xie2, and Qingwei Song1
1The first affiliated hospital of dalian medical university, DaLian, China, 2GE Healthcare, MR Research China, Beijing, Beijing, China
1The first affiliated hospital of dalian medical university, DaLian, China, 2GE Healthcare, MR Research China, Beijing, Beijing, China
Synopsis
Diffusion tensor imaging (DTI), a type of MR functional imaging, can reflect the direction of the diffusion motion of water moleculesas well as describe the free diffusion rate of water molecules. The characteristic suggested the DTI were helpful in distinguishing endometrial carcinoma (EC) from endometrial polyp (EP).
Objective
To investigate the value of the quantitative parameters of DTI in the identification of stage I endometrial carcinoma (EC) and endometrial polyp (EP).Introduction
There are many overlaps between the clinical manifestations and imaging characteristics[1]. EC is mainly based on surgical treatment, and auxiliary treatment is selected according to high risk factors after surgery. EP is mainly performed by hysteroscopic polypectomy, so there is a big difference in treatment and prognosis between them. Preoperative diagnosis mainly relies on biopsy, an invasive examination, which is often related to the experience of the operator, and there are limitations such as insufficient sampling and inapplicable for patients with cervical or vaginal stenosis [2].So, a non-contrast method was introduced to distinguish EC from EP.Methods
30 patients with stage I EC and 27 patients with EP, confirmed by postoperative pathological examination, were retrospectively reviewed, all patients underwent 1.5T MRI (including DTI and DWI sequence) before operation. The apparent dispersion coefficient (ADC) and fractional anisotropy (FA) of in focal parenchymal areas of two observers were measured (Figure1, 2). The consistency of the measurement results was tested using intra-group correlation coefficient (ICC).The difference of parameters between the two lesions groups, were analyzed by independent- samples T test or Mann-Whitney test. The ROC curve was applied to evaluate effectiveness of statistically significant parameters in the differential diagnosis of two groups. DeLong test was used to compare statistically significant of the AUC and ADCT, FA and ADC.Results
The consistency measured by two observers was good (ICC>0.75)(Table 1).ADCT、ADC of EC group were smaller than EP group, FA was greater than the EP group, their values were (1.062±0.232)X10-9 vs (1.656±0.305)X10-9mm2/s、(0.987±0.199)X10-3 vs(1.285±0.355)X10-3 mm2/s、0.153±0.054 vs. 0.118±0.050 respectively with statistical difference(all P<0.05,Table 2). ADCT, ADC and FA were 1.368 x10⁻⁹mm2 /s, 1.03 x10⁻³ mm2/s and 0.135 respectively as the differential diagnosis thresholds, the corresponding diagnostic sensitivity and specificity were 88.9% and 100%、100% and 66.7%、63.3% and 80.5%, respectively ,AUC were 0.985、0.896 and 0.746, respectively(Table 3).The AUC of ADCT and ADC was statistically significant, while the AUC of FA and ADC values was not statistically significant.Discussion and Conclusion
The growth of EC tissue is more vigorous, with higher internal cell density, irregular morphology, tighter cell arrangement, less internal and external space and intercellular stroma, and more restricted diffusion of water molecules, so the ADCT is reduced. EP was arranged sparsely, glands were dilated, interstitial fibrous tissue was proliferated, and the degree of limited diffusion of water molecules was small, so ADCT was increased. The quantitative parameters of DTI sequence can effectively identify stage I EC and EP, ADCT of DTI has more diagnostic value than ADC of DWI.Acknowledgements
no aknowledgements foundReferences
[1] BALCACER P, COOPER KA, HUBER S, et al. Magnetic Resonance Imaging Features of Endometrial Polyps: Frequency of Occurrence and Interobserver Reliability [J]. J Comput Assist Tomogr, 2018, 42(5):721-726.
[2] ZHU Y, LIU Z, DU M, et al. Macrophages in patients with recurrent endometrial polyps could exacerbate Th17 responses [J]. Clin Exp PharmacolPhysiol, 2018, 45(11):1128-1134.
Figures

Table 1 The values of ADCT (×10-9mm2/s),
FA and ADC (×10-3mm2/s) were measured by two observers and the consistency test
results were obtained

Table 2 The values of ADCT (×10-9mm2/s), FA
and ADC (×10-3mm2/s) between the two groups.
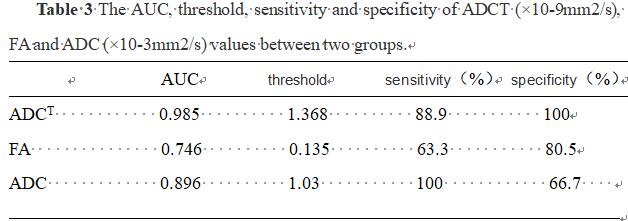
Table 3 The AUC, threshold, sensitivity and
specificity of ADCT (×10-9mm2/s), FA and ADC (×10-3mm2/s) values between two
groups.

Figure 1. Female, 52 years old, EC. T2WI showed a slightly higher signal
(a), T1WI showed a lower signal (b), (c) was DWI, and (d) was ADC image of DWI,
ADC value was 0.82×10⁻³mm2/s. (e) was DTI, (f) and (g) were ADCT
and FA of DTI, respectively, and the ADCT and FA values were
0.898×10⁻⁹mm2/s and 0.135. (h) is pathological figure (HE×100). The glands of
the heterotype cells are dense without stroma.
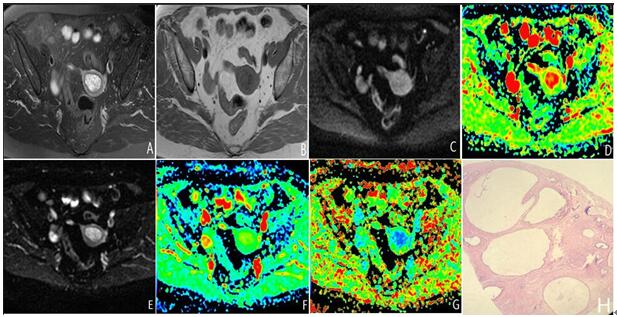
Figure 2. Female, 71 years old, EP. T2WI showed a
slightly higher signal (a), T1WI showed a low signal (b), (c) was DWI, (d)was the ADC image of
DWI, ADC value was 1.64×10⁻³mm2/s, (e) was DTI, (f) and (g) were ADCT
and FA images respectively, ADCT and FA values were 2.24×10⁻⁹mm2/s
and 0.0884,
respectively. (h) is pathological figure (HE×100), glands dilated,
interstitial fibrous tissue hyperplasia.