4390
The efficacy of ADC value of DWI in differentiating extrahepatic cholangiocarcinoma from mass-forming cholangitis
Yaxin Niu1, Ailian Liu1, Ye Li1, and Lizhi Lizhi Xie2
1The First Affiliated Hospital of Dalian Medical University, Dalian Medical University, Da Lian, China, 2GE Healthcare, MR Research China, BeiJing, China, Beijing, China
1The First Affiliated Hospital of Dalian Medical University, Dalian Medical University, Da Lian, China, 2GE Healthcare, MR Research China, BeiJing, China, Beijing, China
Synopsis
Diffusion-weighted imaging reflects the micro-movements of water molecules.
Introduction
Extrahepatic cholangiocarcinoma (EHCC) is defined as cancers occurring at the left or right hepatic duct to the ampulla1.Accurate differentiation between EHCC and mass-forming cholangitis is essential because the treatment and prognosis differ significantly. Surgical resection withnegative surgical marginis the mainly for treatment of EHCC. Mass-forming cholangitis is cured on anti-inflammation therapy and hormone therapy. Some EHCCs and mass-forming cholangitis may share similar enhancement pattern and clinical symptoms, making it difficult to differentiate between these two diseases. Therefore,we try to introduce anon-contrast method to distinguish between EHCC and mass-forming cholangitis.Objective
To explore the application value of DWI and IVIM model in the differential diagnosis of extrahepatic cholangiocarcinoma and cholangitis.Methods and Data
we retrospectively collected in 50 patients who received 1.5TMRI upper abdominal examination in our hospital from 2015 to June 2019, and each patient received axial T1WI, T2WI, DWI and IVIM sequence scans. Among them, 31 cases (31 lesions) were included in the treatment of extrahepatic cholangiocarcinoma, and 19 cases (19 lesions) were included in the treatment of cholangitis. ADC value, true diffusion coefficient (D) value, perfusion related diffusion coefficient (D*) value and perfusion coefficient (f) value of the single-exponential model were used to quantitatively measure and statistically analyze the lesions of the two groups. Intra-group correlation coefficient (ICC) was used to analyze the consistency of the measurement results of the two observers. The independent sample t-test was used for normal distribution, and the Mann-whitney U rank sum test was used for non-normal distribution. The diagnostic efficacy of the statistically significant parameters was evaluated using the ROC curve of diagnostic efficacy.Results
The measurement data of the two physicians were consistent (ICC >0.9). The values of ADC, D, D* and f in the extrahepatic cholangiocarcinoma group were lower than those in the cholangitis group, with statistically significant differences (P<0.05). The corresponding AUC of ADC, D, D* and f values were 0.707、0.716、0.834 and 0.732, respectively, with sensitivity of 63.2%, 63.2%, 84.2% and 73.7%, specificity of 71.0%, 74.2%, 83.9% and 73.7% respectively.Conclusion and Discussion
The value of ADC is of great value in evaluating the severity of lesions, determining pathological grade and differentiating benign from malignant tumors2. In present study, the preliminary data demonstrate that DWI and IVIM imaging provide important information for the differential diagnosis of EHCC and cholangitis.Higher cell densities restrict diffusion and exhibit low ADC values, otherwise, high ADC values are present.Histologically, cell densitiesof EHCC are higher than those of mass-forming cholangitis, which results in small extracellular space and would yield low ADC values. That’s why the ADC values of EHCC were lower than those of mass-forming cholangitis.Acknowledgements
No acknowledgement found.References
1. Esnaola N F, Meyer J E, Karachristos A, et al. Evaluation and management of intrahepatic and extrahepatic cholangiocarcinoma. [J]. Cancer, 2016, 122(9):1349-1369.
2. Cui X Y, Chen H W. Role of diffusion-weighted magnetic resonance imaging in the diagnosis of extrahepatic cholangiocarcinoma[J]. World Journal of Gastroenterology Wjg, 2010, 16(25):3196.
Figures
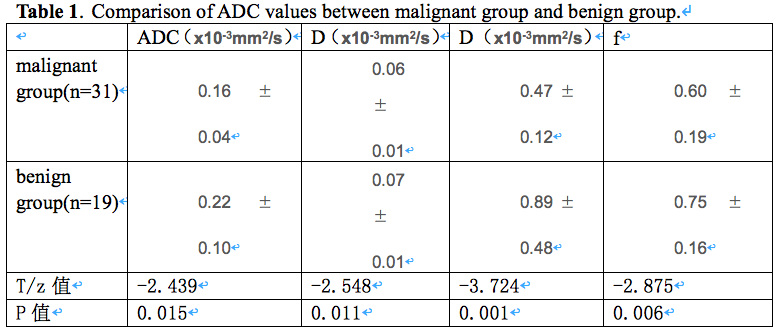
Table 1.Comparison of ADC values between malignant group and benign group.
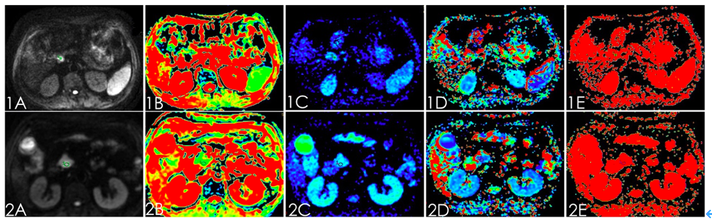
Figure 1. Diffusion-weighted image in 66-year-old man with mass-forming cholangitis shows lesion high signal intensity. DWI (A), ADC map(B), D map (C), D* map (D), f map (E).Figure 2. Diffusion-weighted image in 60-year-old man with EHCC shows lesion high signal intensity. DWI (A), ADC map(B), D map (C), D* map (D), f map (E).
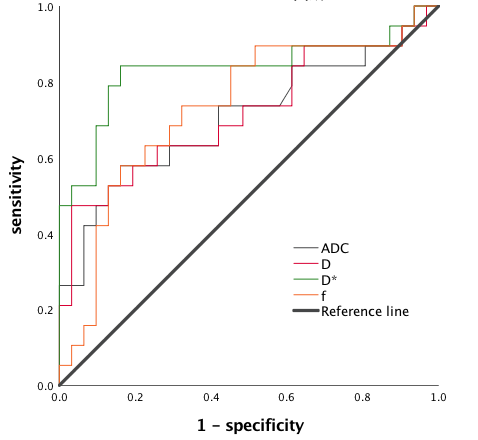
Figure 3. The ROC curve of ADC in patient group.