4389
Diffusion tensor residuals as a potential biomarker for brain tissue damage in memory clinic patients1Image Sciences Institute, University Medical Center Utrecht, Utrecht, Netherlands, 2Department of Neurology, University Medical Center Utrecht Brain Center, Utrecht, Netherlands
Synopsis
DTI metrics are often used without assessing the goodness of fit of the estimation model. We investigated local changes in fit residuals induced by pathology. To this end, a template of expected normalized residuals was created with 10 healthy controls, then voxel-wise comparisons were performed against the residuals of subjects affected by dementia. Results show that the residuals of infarcted regions are significantly different as compared to healthy tissue, whereas no differences were observed in hyperintensities. The fit residuals of the DTI model can be used to complement the information of DTI metrics at detecting microstructural changes in brain lesions.
Introduction
Fit residuals can be used to quantify the goodness of fit of a chosen model to measured signals as, for instance, the diffusion tensor model (DTI) in diffusion MRI1. However, common DTI metrics, as the fractional anisotropy (FA) and the mean diffusivity (MD), are often used without quantifying the appropriateness of the model. In this study, we investigated whether the residuals computed from a DTI fit can be used to complement DTI metrics to detect the microstructural changes in the brain induced by neurodegenerative and vascular pathology in patients from a memory clinic.Methods
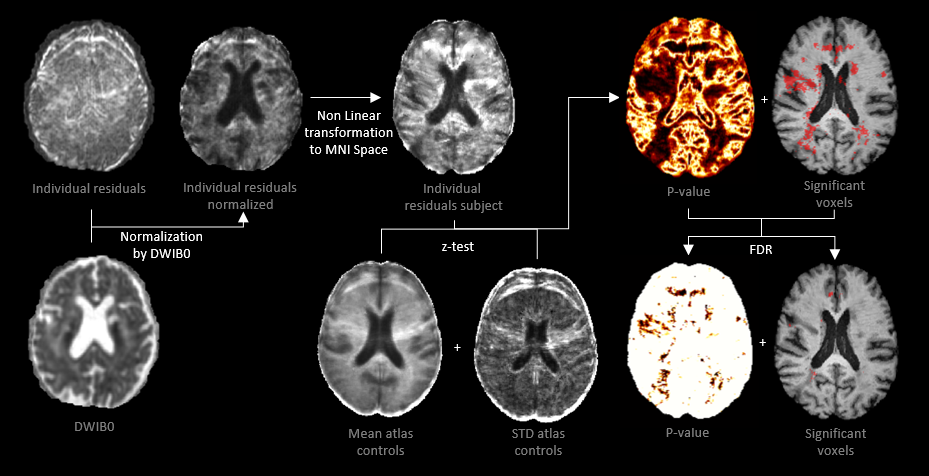
We used data of ten controls and ten patients (mean age 79.2 ± 7 years, 50% male) with amnestic mild cognitive impairment (a-MCI) and early stage Alzheimer’s disease (AD) collected from the Memory clinic of the University Medical Center Utrecht. Data consisted of 46 volumes (1 b=0s/mm2, 45 b=1200s/mm2, TE=73ms, TR=6638ms, voxel-size 1.7x1.7x2.5mm3). The datasets also include T1w images with voxel-size 1x1x1mm3, which were annotated by a clinical specialist to delineate eventual white matter hyperintensities (WMHs) and infarcts. dMRI data were corrected using ExploreDTI2 for subject motion, eddy currents, and EPI deformations including B-matrix adjustments3. The diffusion tensor was computed using robust extraction of kurtosis indices with linear estimation (REKINDLE)4 to obtain the FA, MD, and mean residuals metrics. Tissue segmentation maps were determined by the Computational Anatomy Toolbox (CAT) with a probability threshold of 95%. The mean residuals can be written as: $$ R=\frac{1}{K}\sum_{k=1}^{K} \mid \normalsize DWI_{obs}^{k} \normalsize - DWI_{mod}^{k} \mid $$with K being the number of DW volumes, DWIobs the observed signal, and DWImod the modeled signal: $$DWI_{mod}^{k}=DWI^{0}e^{-B_{k}D_{fit}}$$
DWI0 is the non-DW image, Bk the B-matrices, and Dfit the fitted diffusion tensor. The mean residuals were normalized by DWI0 per voxel. We investigated whether DTI residuals can identify voxels were the goodness of fit of the DTI model is significantly different than in healthy tissue by performing a voxel-wise comparison of the residuals between controls and patients. To this end, T1w images of ten healthy controls were non-linearly registered5 to the MNI-152 T1 template6, then the mean residuals maps were co-registered and their average/standard deviation computed. Before a z-test was performed, the mean residuals of the patients were smoothed with a 5mm full width at half maximum Gaussian filter. The procedure, shown in Figure 1, was also performed for analysis of the FA and MD. Finally, false discovery rate (FDR) correction was applied (uncorrected p-value<0.05)7. As an additional correction, only clusters of size greater than 50 voxels were retained. The images showing the significant differences were superimposed as color overlays on the T1w images in the template space.
Results
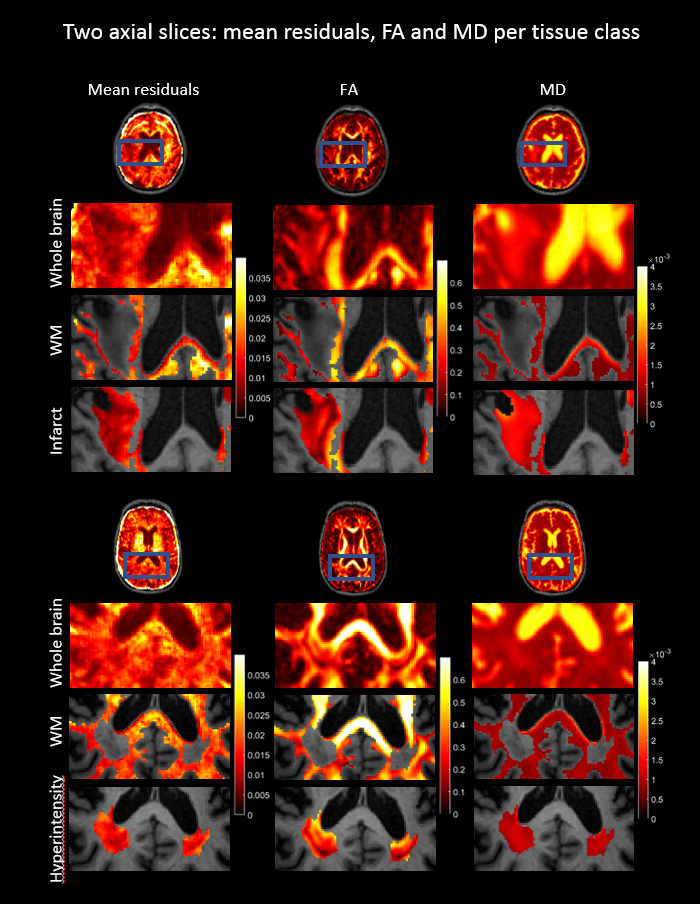
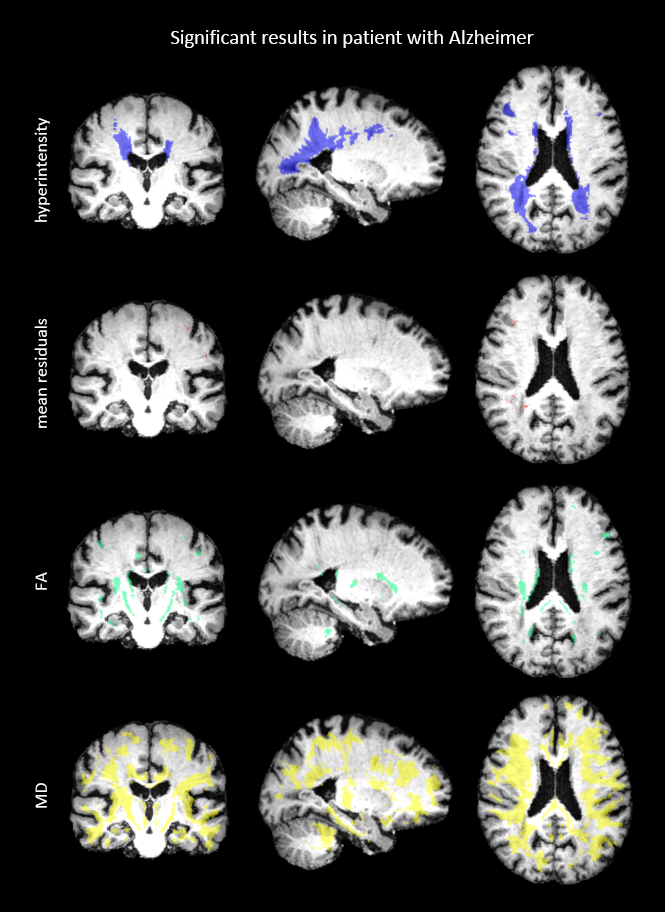
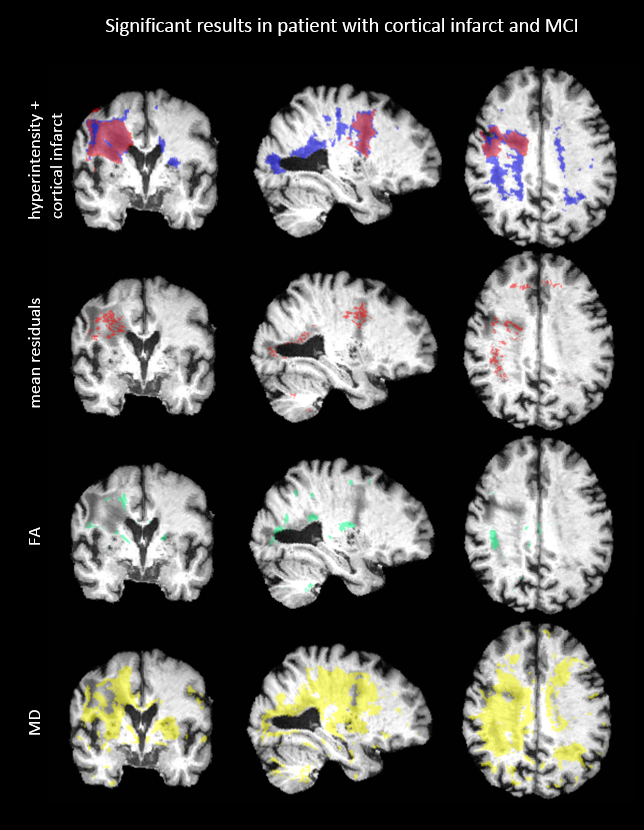
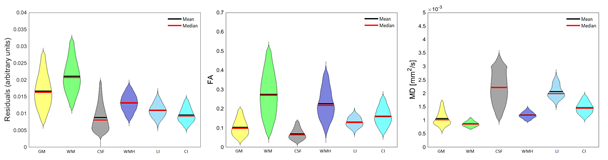
Figure 2 shows the mean residuals, FA and MD values of example axial slices of two patients. The first results (upper four rows) show that the mean residuals and the MD are changed within a cortical infarct as compared to the surrounding tissue. The second example shows that a WMH is characterized by changes in FA and MD, but no clear changes in the mean residuals. The significant results of a comparison between a patient and the atlas are shown in Figure 3 and 4. Significantly different FA and MD values but not residuals are revealed in a WMH. Conversely, microstructural changes in a cortical infarct are captured by the mean residuals but not by FA and MD changes, in analogy to Figure 2. Figure 5 shows the statistical distribution of FA, MD and residuals as violin plots for different regions-of-interest (ROIs). A decrease is shown in the residuals for all ROIs compared to the surrounding tissue, especially for the cortical infarct, and the variance of the ROIs is smaller. The FA reveals more isotropic results for the ROIs, especially for the lacunar infarct, but also overlap with the FA in the surrounding tissue. An increase in the MD is shown especially in both the infarcts.Discussion
In this study, we have shown that DTI residuals can complement the information of DTI metrics to describe microstructural changes induced by pathology, as WMHs and infarcts. The mean residuals show no clear significant differences in the regions of WMHs, implying that the goodness of fit of the DTI model in WMHs is comparable to that in healthy tissue, and that the observed changes in FA and MD are likely to be genuine. Conversely, the mean residuals in the region of the infarct do show significant differences, suggesting caution in interpreting changes in DTI metrics in these regions. A drawback of the method used, voxel-wise analysis, is the chance on detecting false positives. As a result of the multiple corrections applied, it is possible that less microstructural changes were detected by residuals, for example a lacunar infarct which often spans a few voxels. Furthermore, the MNI atlas defines a standard anatomy which is structurally different from our dataset of elderly with dementia, involving loss of hippocampal volume and changes in ventricular shape.Conclusions
The fit residuals of the DTI model can be used to detect microstructural changes induced by pathology, raising awareness on the reliability of any detected change in DTI metrics, and potentially allowing to distinguish between different lesion types.Acknowledgements
References
1. Kristoffersen, A. (2011). Statistical
assessment of non‐Gaussian diffusion models. Magnetic resonance in medicine, 66(6),
1639-1648.
2. Leemans, A. J. B. S. J. J. D. K., Jeurissen, B., Sijbers, J., & Jones, D. K. (2009, April). ExploreDTI: a graphical toolbox for processing, analyzing, and visualizing diffusion MR data. In Proc Intl Soc Mag Reson Med (Vol. 17, p. 3537).
3.
Leemans, A.,
& Jones, D. K. (2009). The B‐matrix must be
rotated when correcting for subject motion in DTI data. Magnetic
Resonance in Medicine: An Official Journal of the International Society for
Magnetic Resonance in Medicine, 61(6), 1336-1349.
4.
Tax, C. M., Otte, W. M., Viergever, M. A.,
Dijkhuizen, R. M., & Leemans, A. (2015). REKINDLE: robust extraction of kurtosis INDices with linear
estimation. Magnetic Resonance in Medicine, 73(2),
794-808.
5.
Klein, S., Staring, M., Murphy, K., Viergever,
M. A., & Pluim, J. P. (2009). Elastix: a
toolbox for intensity-based medical image registration. IEEE
transactions on medical imaging, 29(1), 196-205.
6.
Collins, D. L.,
Neelin, P., Peters, T. M., & Evans, A. C. (1994). Automatic 3D intersubject
registration of MR volumetric data in standardized Talairach space. Journal of
computer assisted tomography, 18(2), 192-205.
7. Benjamini, Y., & Hochberg, Y. (1995). Controlling the false discovery rate: a practical and powerful approach to multiple testing. Journal of the Royal statistical society: series B (Methodological), 57(1), 289-300.
Figures