4388
Improved parameter maps calculation in IVIM-diffusion-weighted MRI using a noise compensation fitting model1Department of Diagnostic and Interventional Radiology, Ulm University Medical Center, Ulm, Germany, 2Department of Internal Medicine II, Ulm University Medical Center, Ulm, Germany
Synopsis
In standard diffusion-weighted imaging, the parameter maps are calculated based on a set of magnitude images. The standard fitting model of the parameter maps does not take a noise-induced bias into account. A noise offset model for Intravoxel Incoherent Motion (IVIM) in Diffusion Weighted Imaging (DWI) is introduced and the impact on diffusion parameter maps is evaluated for muscle and synovia of the knee joint. Parameter fitting using the noise-offset model results in faster signal decay of the fitted curve and therefore in increased diffusion coefficients compared to standard IVIM mapping.
Introduction
In diffusion-weighted imaging, the parameter maps are calculated based on a set of magnitude images. The magnitude images used for the parameter fit contain noise which is not considered in the usual fit equation for Apparent Diffusion Coefficient (ADC) or for Intravoxel Incoherent Motion (IVIM) calculation. If the noise-induced baseline is not considered, then the parameter curve is fitted until the signal reaches the zero baseline. In this work, a noise offset model (IVIM) in Diffusion Weighted Imaging (DWI) is introduced and the impact on diffusion parameter maps is evaluated for muscle and the synovia of the knee.Methods & Materials
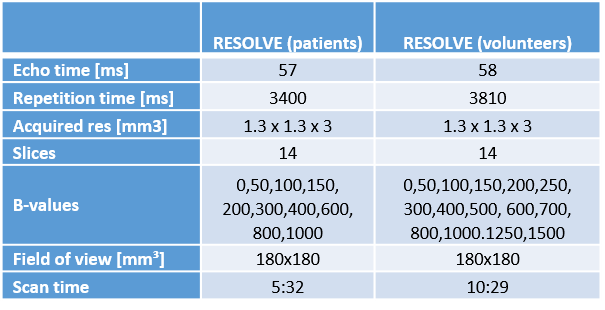
In this study, five volunteers (mean age: 27 ± 4 years) and 2 patients (20 ± 1 years) were included. All imaging was performed on a 3T whole-body MRI (Skyra, Siemens Medical, Germany). Volunteers underwent an examination including a survey scan and a RESOLVE scan with 15 B-values each. To adequately reproduce the decay curve, incremental B-values were acquired in steps of 50 mm/s2 in the range with significant perfusion-related signal [1] and in steps of 100 mm/s2 until standard clinical maximal B-value of 800 mm/s2. To investigate the effect of noise compensation, additional high B-values (1000, 1250 and 1500 mm/s2) are included. Patients underwent a RESOLVE scan with 10-B-values (Bmax = 1000mm/s2) with a scan duration of 5:32min during clinical routine and an additional post-contrast transverse T1-weighted scan. Detailed scan parameters are listed in Figure I. For fitting of the diffusion D, perfusion/pseudo-diffusion D* and perfusion fraction f parameter maps, two different fitting models were investigated - the standard IVIM equation:$$S = S_0 ((1-f)e^{-bD}+fe^{-bD^*})$$
and a baseline corrected version of the IVIM equation:
$$S_{baseline} = S_0 ((1-f)e^{-bD}+fe^{-bD^*}) +S_{noise}$$
where Snoise is the noise-induced signal bias. The parameter fitting was performed as “segmented” two-step fit: in the first step, only images with B-values were used where the influence of the pseudo-diffusion is negligible (assuming D* = 0). The threshold for the segmented fit was chosen to B = 200 mm/s2 [1]. Thus the fitting model can be simplified to a mono-exponential signal decay function. Therefrom D and f can be obtained [2]. In the second fit-step, these D and f values were used and then the perfusion coefficient was calculated. For quantitative analyses, a ROI for manual segmentation was placed on the muscle. In patients, the synovial signal was evaluated accordingly.
Results
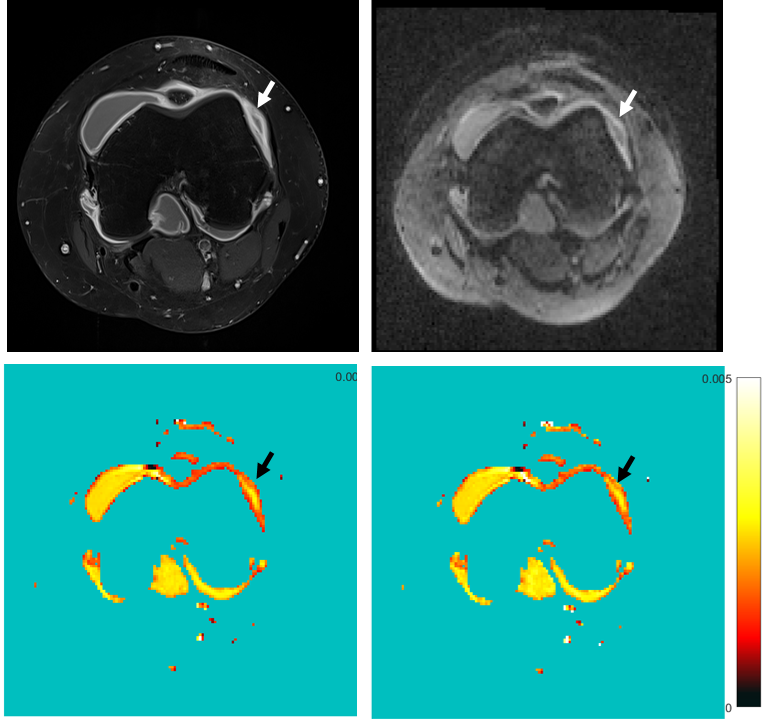
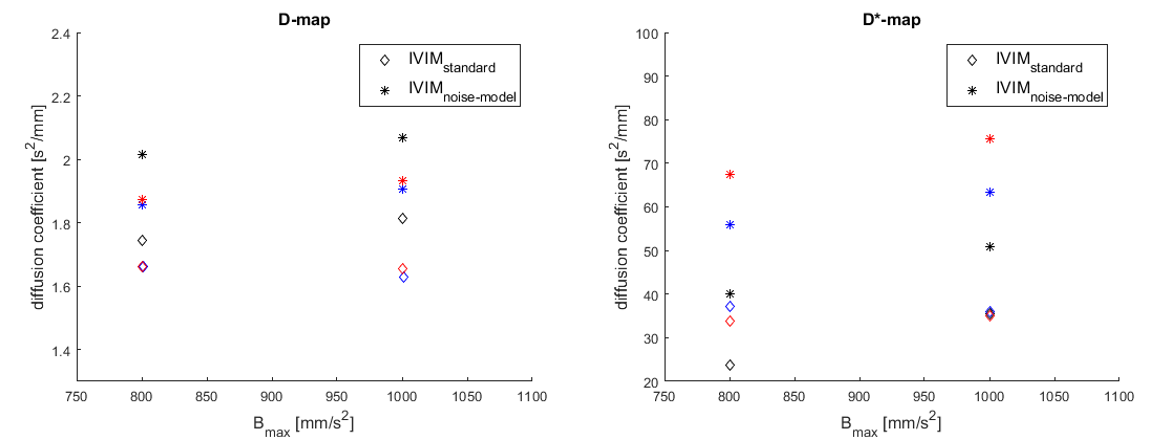
Figure II shows the contrast-enhanced T1-weighted image (a), the diffusion weighted image at B = 1000mm/s2 (b) and the D maps computed from standard IVIM (c) and noise offset approach (d) in a patient with juvenile idiopathic arthritis of the knee. The inflamed synovium shows much higher signal intensity in the diffusion map calculated from the investigated offset approach compared to standard calculation. The quantitative results for mean signal decay coefficients D and D* are shown in Figure III and IV. For all cases, the diffusion and pseudo-diffusion coefficients, estimated by the noise-offset model, are increased compared to the standard IVIM model. The evolution of parameter values in muscle over Bmax is shown in Figure III. The values for D and D* increase for IVIMbaseline with increasing Bmax, while decrease for standard IVIM parameter mapping. Figure IV shows values of the muscle (volunteer: blue, patient: red) and the synovia (black) for maximum used B-value of 800 and 1000mm/s2. As can be expected from literature [1], the diffusion values of the muscle are smaller than those of the synovia using the identical parameter model. Comparing the D and D*values of the synovia from the standard IVIM to IVIMbaseline values they are even below the values in the muscle.Discussion
The magnitude images used for parameter mapping in DWI yield a noise offset which usually differs from zero. If this offset is left unconsidered, the data fitting results in a prolonged decay curve and therefore leads to a reduced decay coefficient. This leads to underestimation of the received diffusion coefficient. Since the offset represents the noise in the magnitude images, it can be expected that the underestimation of the diffusion values depends on the signal-to-noise (SNR) ratio of the DWI scan and therefore this underestimation decreases with increasing SNR.Conclusion
The investigated noise-offset model for IVIM parameter fitting indicates that the diffusion coefficients measured in clinical routine underestimate the true diffusion and pseudo-diffusion coefficient. Variations of the diffusion parameter depending on the SNR of the MR Images could lead to incorrect diagnosis in clinical routine. The impact of varying signal-to-noise ratio between DWI scans using different hardware and sequence parameter settings on clinical evaluation has to be further evaluated.Acknowledgements
No acknowledgement found.References
[1] Hilbert F. et.al. Intravoxel incoherent motion magnetic resonance imaging of the knee joint in children with juvenile idiopathic arthritis. Pediatr. Radiol. (2017) 47:681-690
[2] Sigmund E.et al. Intravoxel incoherent Motion (IVIM) imaging of tumor microenvironment in Locally Advanced Breat Cancer: Magn: Reson. Med. 2011 65(5):1437-1447
Figures