4385
Delineating the grey matter-white matter interface directly from diffusion MRI data1School of Psychology, Cardiff University Brain Research Imaging Centre, Cardiff, United Kingdom, 2School of Medicine, Cardiff University Brain Research Imaging Centre, Cardiff, United Kingdom, 3BRAIN Biomedical Research Unit, Cardiff, United Kingdom
Synopsis
Anatomically constrained tractography aims to reduce the number of false positive streamlines by applying anatomically realistic priors. Grey matter-white matter interface is currently extracted based on T1 information requiring the availability of a T1 volume and its accurate co-registration with diffusion MRI data. Here we describe an alternative method based on multi-shell multi-tissue constrained spherical deconvolution that produces the interface without the need for T1. We go ahead and compare our method with the existing one and show a potential application.
Introduction
The ability of diffusion MRI (dMRI)-derived tractography to describe white matter pathways non-invasively is of enormous scientific and clinical utility. However, the mapping from diffusion signal to fibre orientations is an ill-posed problem, resulting in a large number of false positive streamlines.1 The concept of anatomically constrained tractography (ACT) aims to overcome this limitation by applying anatomically realistic priors.2,3 One step of ACT involves defining a grey matter-white matter interface (GMWMI) based on T1 information with a need to accurately co-register T1 and dMRI volumes. We present a method to produce GMWMI directly from dMRI data based on multi-shell multi-tissue constrained spherical deconvolution (MSMT-CSD)-derived fibre orientation distributions, thereby avoiding the need for such co-registration.Methods
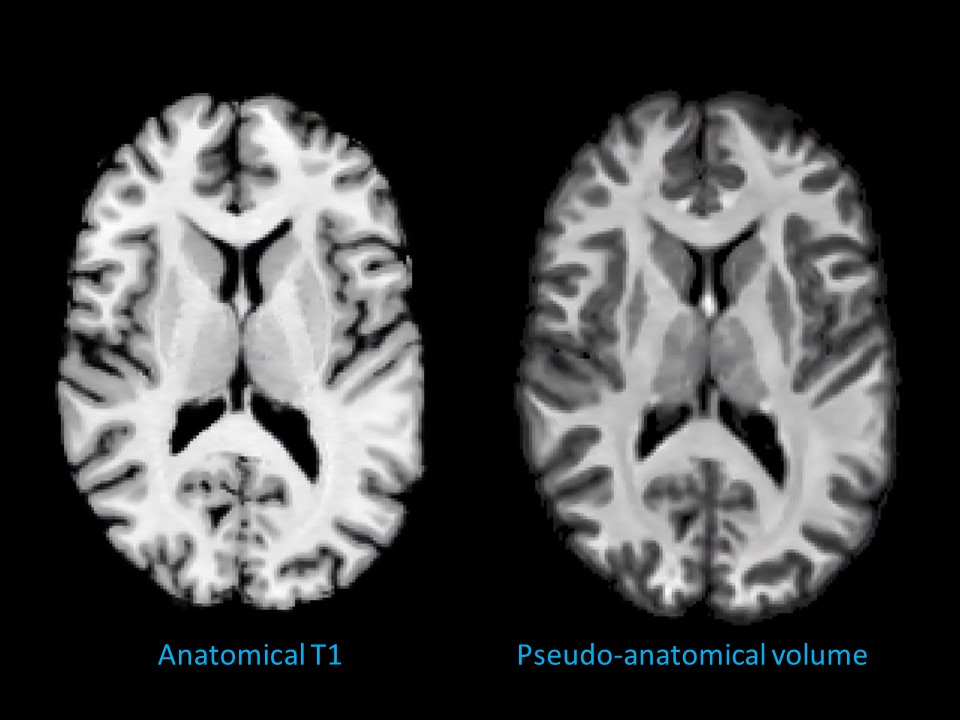
Acquisition and processing: One volunteer was scanned on a 3T Siemens Connectom system. An anatomical T1 volume (voxel size: 1x1x1 mm3, TR/TE 2300/2.81 ms) and a dMRI dataset (single-shot spin echo, echo planar, voxel size: 2×2×2 mm3; b=0/200/500/1200/2400/4000/6000 s/mm2 in 13/20/20/30/61/61/61 directions, respectively; TR/TE 3000/59 ms) were procured. dMRI dataset was upsampled to 1x1x1 mm3, denoised,4 corrected for signal drift5 and slicewise6 intensity outliers, Eddy current distortion and motion artefact,7 EPI distortion,8 gradient non-linearity9 and Gibbs artefact.10Pseudo-anatomical volume generation: Fibre orientation distribution (FOD) volumes11 were derived using 3-tissue response function estimation12 and subsequent MSMT-CSD.13 Bias field correction14 was applied. A pseudo-anatomical volume (PAV) was calculated by adding the intensity-normalised white matter (WM) and grey matter (GM) FODs with the latter multiplied by 2.5 times its mean positive intensity. The product was thresholded at 7.5% of maximum intensity to ensure a null non-brain voxel intensity (Fig.1). T1 volume was co-registered15 with PAV for comparison.
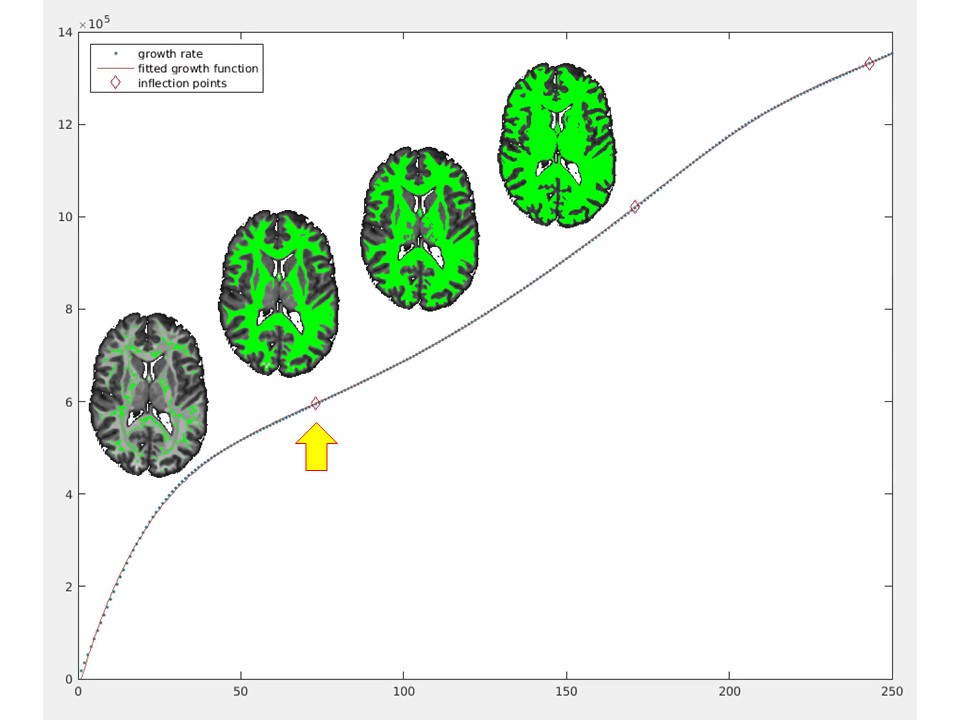
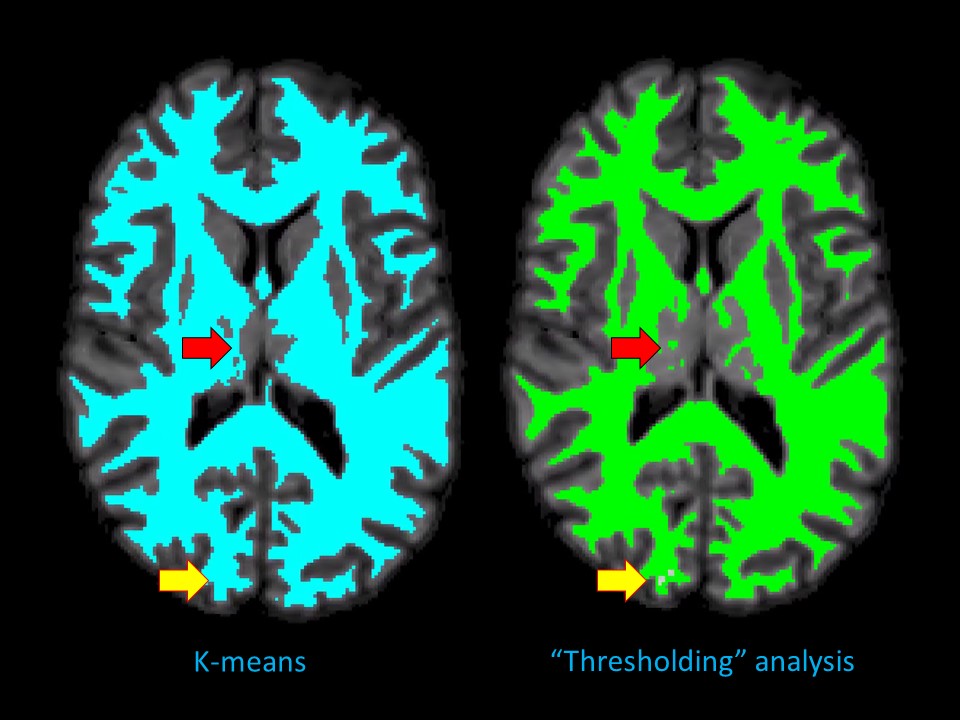
dGMWMI extraction: An exemplary WM voxel (v0) was identified by sampling non-null voxels of thresholded WM FOD (n=30) and finding one whose intensity was closest to the median sampled intensity. Two methods of extracting the initial WM mask were then compared. The first (M1) consisted of using K-means algorithm16 to split PAV voxels into two classes and associating the class containing the v0 with WM. The second (M2, referred to as “thresholding” analysis) consisted of repeatedly recruiting voxels while increasing intensity threshold starting from v0 so that more voxels were recruited with each iteration. Iteration number was plotted against the number of recruited voxels and a seventh-degree polynomial was fitted to the data. As “speeding up” of recruitment was expected after most of WM was included, the first inflection point where the function became concave upwards was determined (Fig.2). Following this step, deep grey matter (DGM) structures and the brainstem were segmented using FSL FIRST.17 The ventricles were segmented by applying the eroded brain mask on the cerebrospinal fluid FOD and leaving only the component with the largest number of ‘connected’ voxels. The final dGMWMI mask was produced by generating a boundary around the initial WM mask, applying dilated inverted binary DGM, brainstem and ventricular masks, and drawing additional boundaries around each DGM structure.
Results
PAV extraction: The FOD-derived PAV demonstrated a sharp grey-white matter contrast despite being derived from a 2x2x2mm3 dMRI volume (Fig. 1). This allowed for a sufficiently precise GMWMI extraction in subsequent steps.Initial WM mask: Fig. 2 shows how M2 identifies the point where all WM voxels have been recruited. This translates into the initial WM mask shown in Fig. 3 (right). In comparison with M1 (Fig. 3, left), it tends to be more constrained which better avoids the DGM structures but can under-recruit subcortical WM.
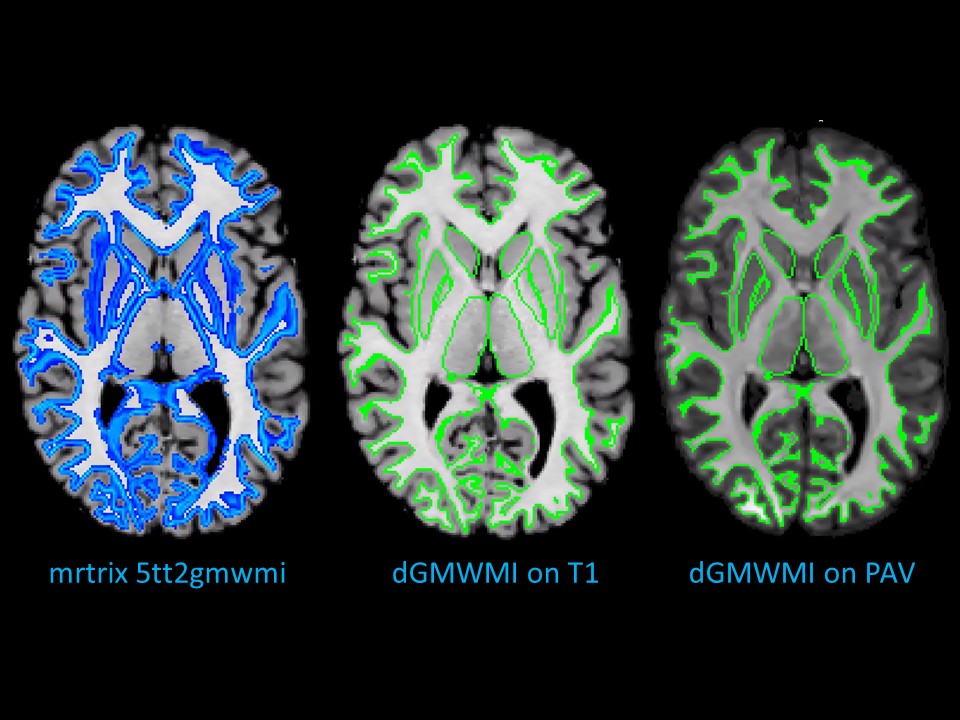
Qualitative comparison with mrtrix 5tt2gmwmi: Fig. 4 shows the final dGMWMI, its relationship with co-registered T1, and how it compares with T1-derived GMWMI produced in mrtrix, with good correspondence between the cases. dGMWMI appears “cleaner” as it does not consider partial volume effects (which may or may not be desired based on the application). Note that the boundary can be pushed deeper into the GM if created on the outside of the WM.
Discussion
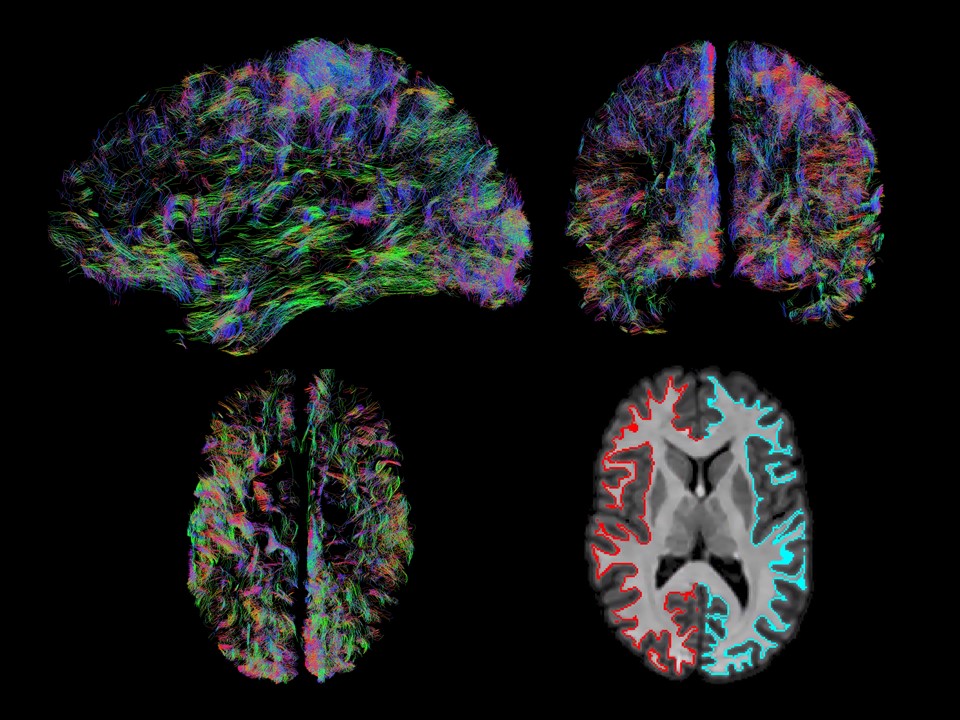
The demonstrated method allows for delineation of GMWMI with high quality without the need for a T1 volume. This avoids the potential imperfections resulting from T1-to-dMRI co-registration which can be particularly problematic with high gradient strengths and especially around the cortical surfaces. An example of such use is extraction of U-shaped fibres for studying cortico-cortical connectivity (Fig. 5) where it can be combined with other methods.18 A modified version of “thresholding” analysis using voxel connectivity can be applied to improve segmentation of individual structures based on their intensities (used to remove the cerebellum in this example). Other data types (such as fractional anisotropy) can be similarly exploited to inform segmentation. There is a potential advantage in computational time when FODs are already available in sufficiently high resolution omitting the T1 to dMRI co-registration. While this method is based on MSMT-CSD, our future direction is to test it with lower gradients and single-shell 3-tissue response function estimation.12Conclusions
This work demonstrates an alternative option for grey matter-white matter interface extraction derived directly from dMRI data. It avoids the need for T1 co-registration where it is not required for subsequent processing steps. This allows retrospective studies with missing or corrupted T1 data to benefit from advanced tractography methods using anatomical priors.Acknowledgements
DS
is supported by the Wellcome Trust-funded GW4 Clinical Academic Training
fellowship and Welsh Clinical Academic Track fellowship. SB is supported by the
Wellcome Trust Inspire Vacation Studenship.
CMWT is supported by a Rubicon grant (680-50-1527) from the
Netherlands Organisation for Scientific Research (NWO) and a Sir Henry Wellcome
Fellowship (215944/Z/19/Z).
References
- Maier-Hein KH, Neher PF, Houde JC, et al. The challenge of mapping the human connectome based on diffusion tractography. Nat Commun 2017;8(1):1349.
- Smith RE, Tournier JD, Calamante F, et al. Anatomically-constrained tractography: improved diffusion MRI streamlines tractography through effective use of anatomical information. Neuroimage 2012;62(3):1924-1938.
- Girard G, Whittingstall K, Deriche R, et al. Towards quantitative connectivity analysis: reducing tractography biases. Neuroimage 2014;98:266-278.
- Veraart J, Novikov DS, Christiaens D, et al. Denoising of diffusion MRI using random matrix theory. Neuroimage 2016;142:394-406.
- Vos SB, Tax CM, Luijten PR, et al. The importance of correcting for signal drift in diffusion MRI. Magn Reson Med 2017;77(1):285-299.
- Sairanen V, Leemans A, Tax CMW. Fast and accurate Slicewise OutLIer Detection (SOLID) with informed model estimation for diffusion MRI data. Neuroimage 2018;181:331-346.
- Andersson JLR, Sotiropoulos SN. An integrated approach to correction for off-resonance effects and subject movement in diffusion MR imaging. Neuroimage 2016;125:1063-1078.
- Andersson JL, Skare S, Ashburner J. How to correct susceptibility distortions in spin-echo echo-planar images: application to diffusion tensor imaging. Neuroimage 2003;20(2):870-888.
- Glasser MF, Sotiropoulos SN, Wilson JA, et al. The minimal preprocessing pipelines for the Human Connectome Project. Neuroimage 2013;80:105-124.
- Kellner E, Dhital B, Kiselev VG, et al. Gibbs-ringing artifact removal based on local subvoxel-shifts. Magn Reson Med 2016;76(5):1574-1581.
- Tournier JD, Calamante F, Connelly A. Robust determination of the fibre orientation distribution in diffusion MRI: non-negativity constrained super-resolved spherical deconvolution. Neuroimage 2007;35(4):1459-1472.
- Dhollander T, Raffelt D, Connelly A. Unsupervised 3-tissue response function estimation from single-shell or multi-shell diffusion MR data without a co-registered T1 image. ISMRM Workshop on Breaking the Barriers of Diffusion MRI2016.
- Jeurissen B, Tournier JD, Dhollander T, et al. Multi-tissue constrained spherical deconvolution for improved analysis of multi-shell diffusion MRI data. Neuroimage 2014;103:411-426.
- Tustison NJ, Avants BB, Cook PA, et al. N4ITK: improved N3 bias correction. IEEE Trans Med Imaging 2010;29(6):1310-1320.
- Avants BB, Tustison NJ, Song G, et al. A reproducible evaluation of ANTs similarity metric performance in brain image registration. Neuroimage 2011;54(3):2033-2044.
- Arthur D, Vassilvitskii S. k-means++: The Advantages of Careful Seeding: Stanford InfoLab; 2006.
- Patenaude B, Smith SM, Kennedy DN, et al. A Bayesian model of shape and appearance for subcortical brain segmentation. Neuroimage 2011;56(3):907-922.
- St-Onge E, Daducci A, Girard G, et al. Surface-enhanced tractography (SET). Neuroimage 2018;169:524-539.
- Chamberland M, Whittingstall K, Fortin D, et al. Real-time multi-peak tractography for instantaneous connectivity display. Front Neuroinform 2014;8:59.
Figures