4384
A Study on Time Dependency of the Fractional Order Calculus Diffusion Model1Center for Magnetic Resonance Research, University of Illinois at Chicago, Chicago, IL, United States, 2Department of Bioengineering, University of Illinois at Chicago, Chicago, IL, United States, 3Department of Medical Physics, University of Wisconsin-Madison, Madison, WI, United States, 4Department of Radiology, School of Medicine and Public Health, University of Wisconsin-Madison, Madison, WI, United States, 5Department of Radiology and Neurosurgery, University of Illinois at Chicago, Chicago, IL, United States
Synopsis
Parameters in many diffusion models depend on diffusion time. However, time-dependent diffusion behaviors in the long diffusion time regime have not been well studied because a longer diffusion time would lead to a longer TE, substantially reducing signal-to-noise ratio in conventional spin-echo diffusion pulse sequences. In this study, we employed a STEAM diffusion sequence to investigate the diffusion-time dependence of parameters in a fractional order calculus diffusion model. Our results showed substantial dependence of all diffusion parameters on diffusion times in the range of 100-1000 ms.
Introduction
It has been recognized that diffusion-weighted (DW) MR signal deviates from a mono-exponential decay, particularly at high b-values1 (e.g., > 1500 sec/mm2 for human brain). Over the past two decades, several advanced models have been proposed to characterize this non-Gaussian diffusion behavior1-5. One of these models is the fractional order calculus (FROC) model3, which features a new set of parameters: anomalous diffusion coefficient D, intra-voxel diffusion heterogeneity parameter β, and a spatial variable µ. In parallel with the development of non-Gaussian diffusion models, it has been increasingly recognized that diffusion parameters derived from various diffusion models are dependent on diffusion time (Δ)6. Studies on time dependency of non-Gaussian diffusion models would provide new insights into the complex diffusion phenomena in biological tissues and contribute to the ongoing efforts to probe tissue microstructures through diffusion imaging. Unfortunately, varying diffusion times has been challenging in a conventional spin-echo pulse sequence, especially in the long diffusion time regime6,7, because a longer Δ leads to a longer TE and thus substantially reduced signal-to-noise ratio (SNR). In this study, we employed a stimulated echo acquisition mode (STEAM)6,8 pulse sequence to vary Δ by changing the mixing time (TM) across a wide range without lengthening TE. Using the STEAM sequence, we investigated the time dependency of the FROC model parameters.Methods
Image Acquisition: A single-shot STEAM DW sequence (Figure 1a) was implemented on a 3-T MR scanner (Discovery MR750; GE Healthcare, Waukesha, WI). Using this pulse sequence, healthy human subjects were scanned with an 8-channel head coil at six different TM values: 100, 200, 400, 600, 800, and 1000 ms. The corresponding Δ for the TMs are listed in Figure 1b. At each TM, DW images were acquired with 10 b-values (50, 100, 200, 500, 800, 1000, 1500, 2000, 2500, and 3000 sec/mm2) in the three orthogonal directions. The other acquisition parameters were: TR = 4000 ms, slice thickness = 4 mm, FOV = 20 x 20 cm2, and matrix size = 128 x 128. The total scan time was 30 min 48 s.Image Analysis: According to the FROC model, the DW signal intensity S is given by3:
$$S = S_0exp[-D\mu^{2(\beta-1)}(\gamma G_d\delta )^{2\beta}(Δ- \frac{2\beta - 1}{2\beta + 1}\delta)],$$
where S0 is the signal intensity without diffusion weighting, Gd, δ, and Δ are the diffusion gradient amplitude, pulse width, and lobe separation (or diffusion time), respectively. The set of DW images with multiple b-values was fitted to the FROC model voxel-by-voxel by using an iterative Levenberg-Marquardt algorithm in Matlab. In the fitting, D was first estimated by a mono-exponential model at lower b-values (≤ 1500 sec/mm2). This was followed by a simultaneous estimation of β and µ by using all b-values. Regions of interest (ROIs) were placed on multiple gray matter (GM) and white matter (WM) structures such as the putamen and genu of the corpus callosum, respectively. The mean parameter values were computed over the GM and WM ROIs. The GM/WM contrast was calculated using the following equation for each TM.
$$Contrast = \mid\frac{\lambda _{GM} - \lambda _{WM}}{\lambda _{GM} + \lambda _{WM}}\mid,$$
where λ represents the mean parameter value of D, β, or μ.
Results
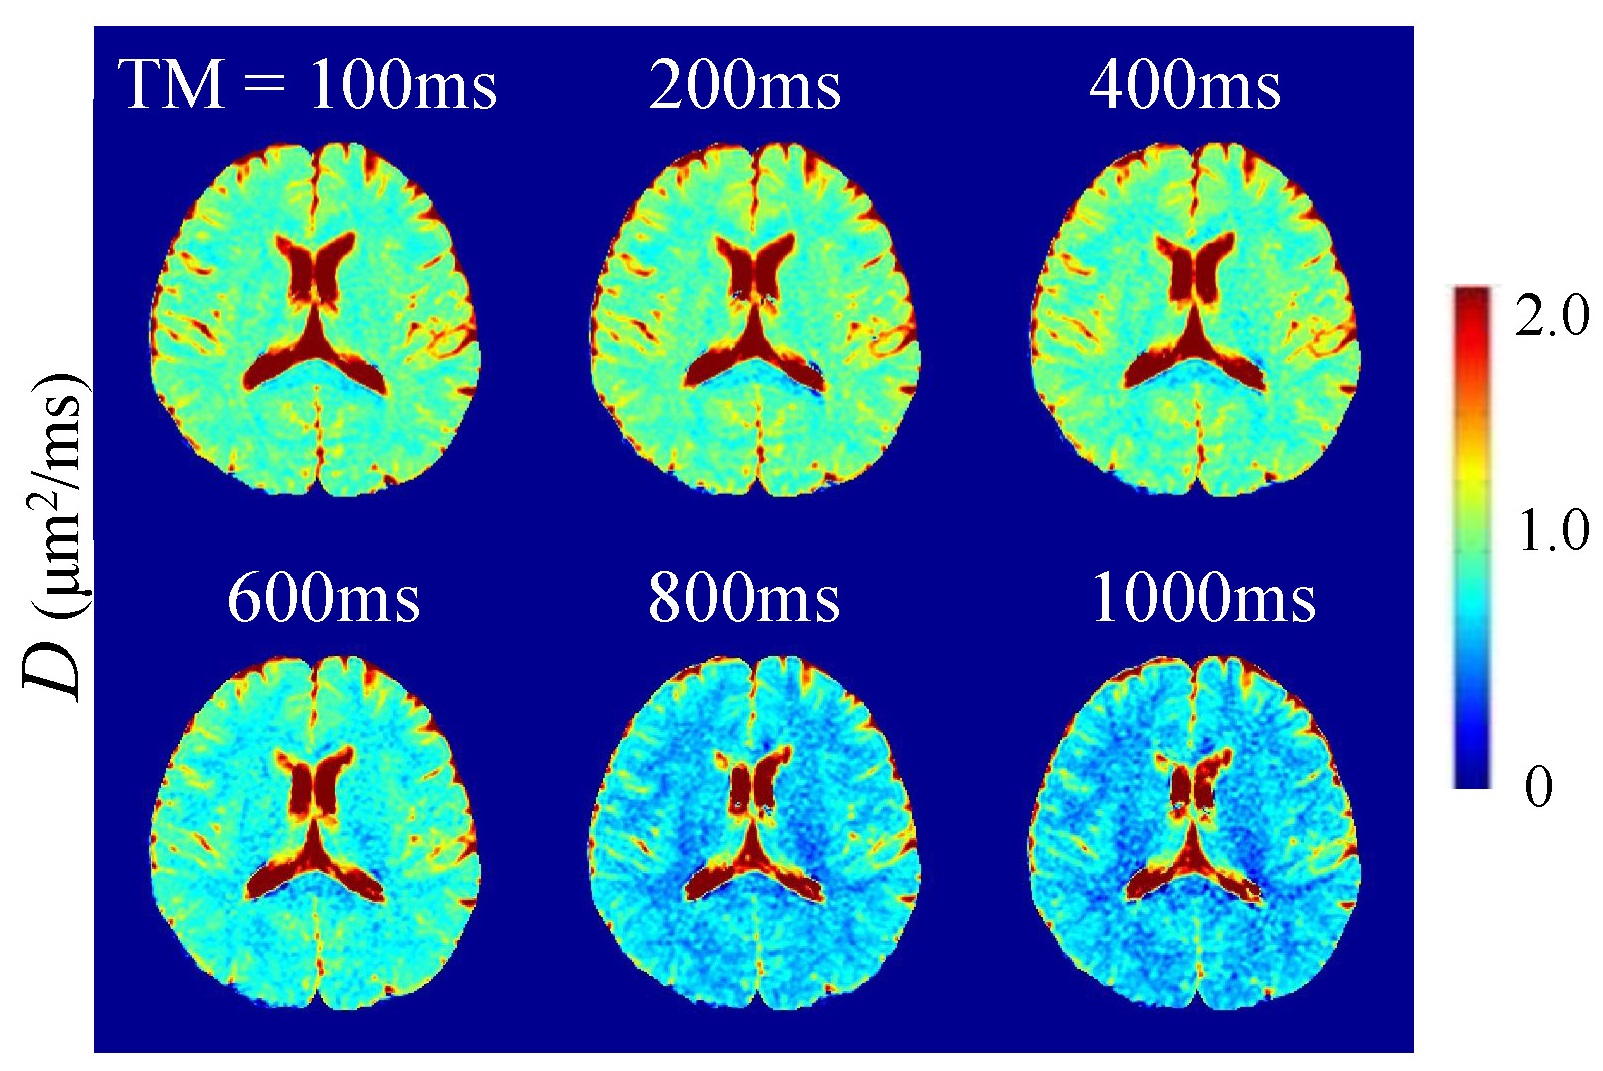
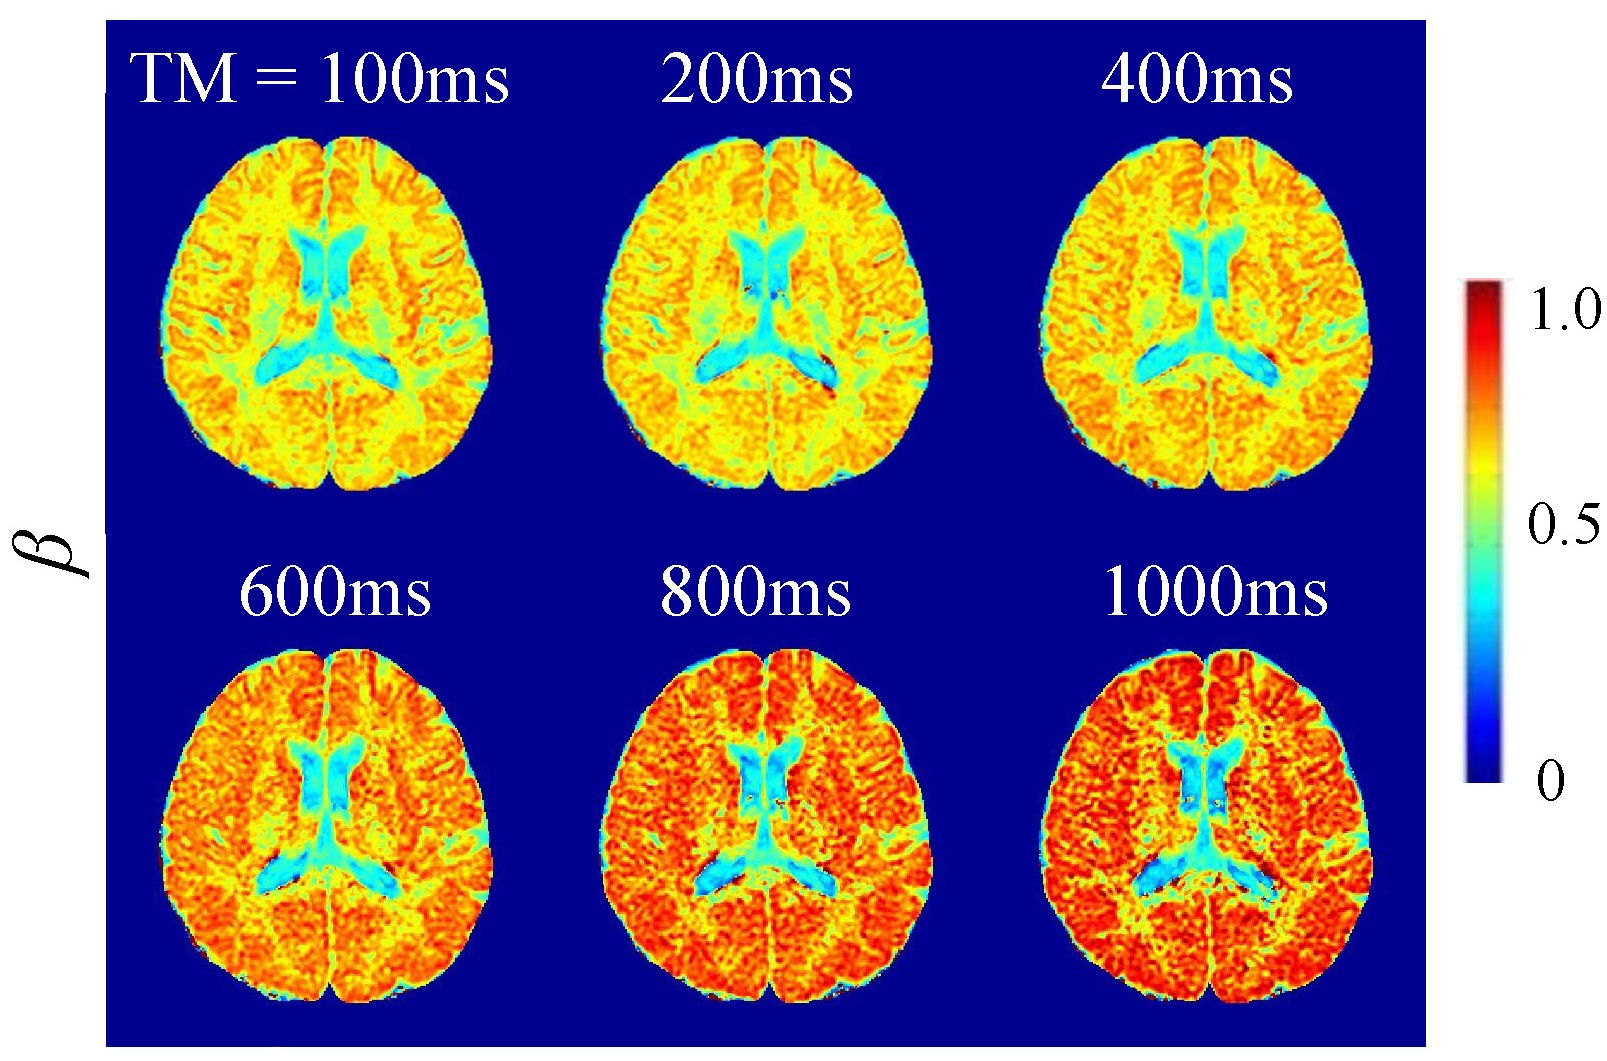
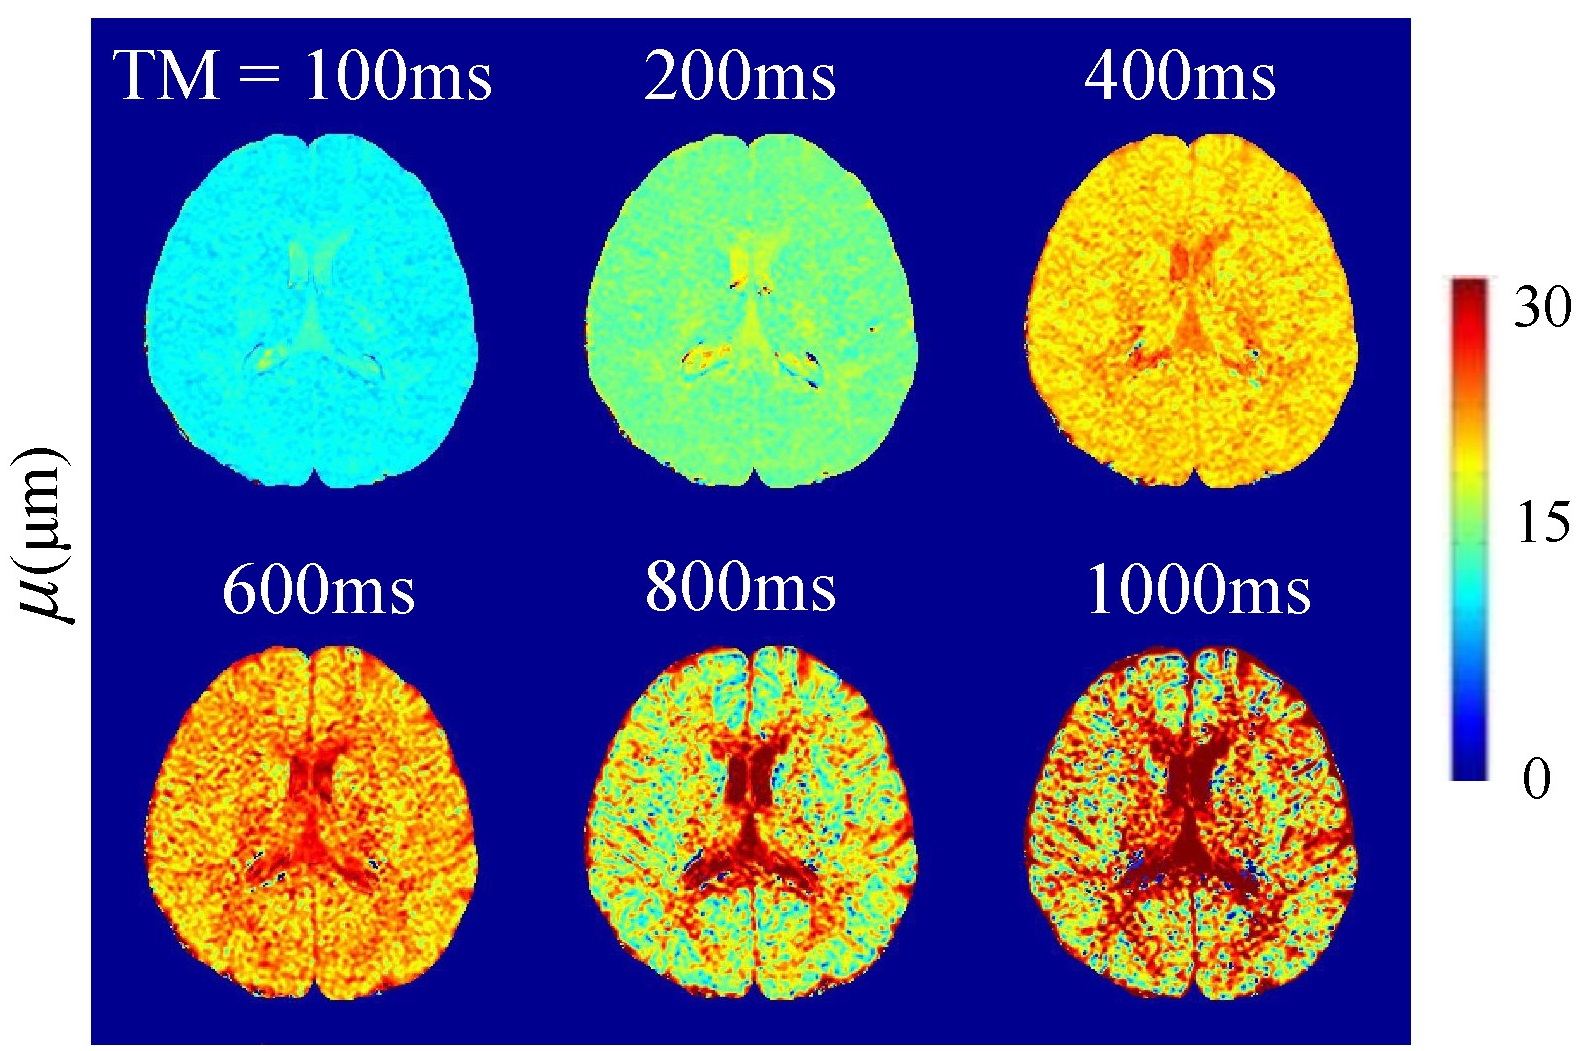
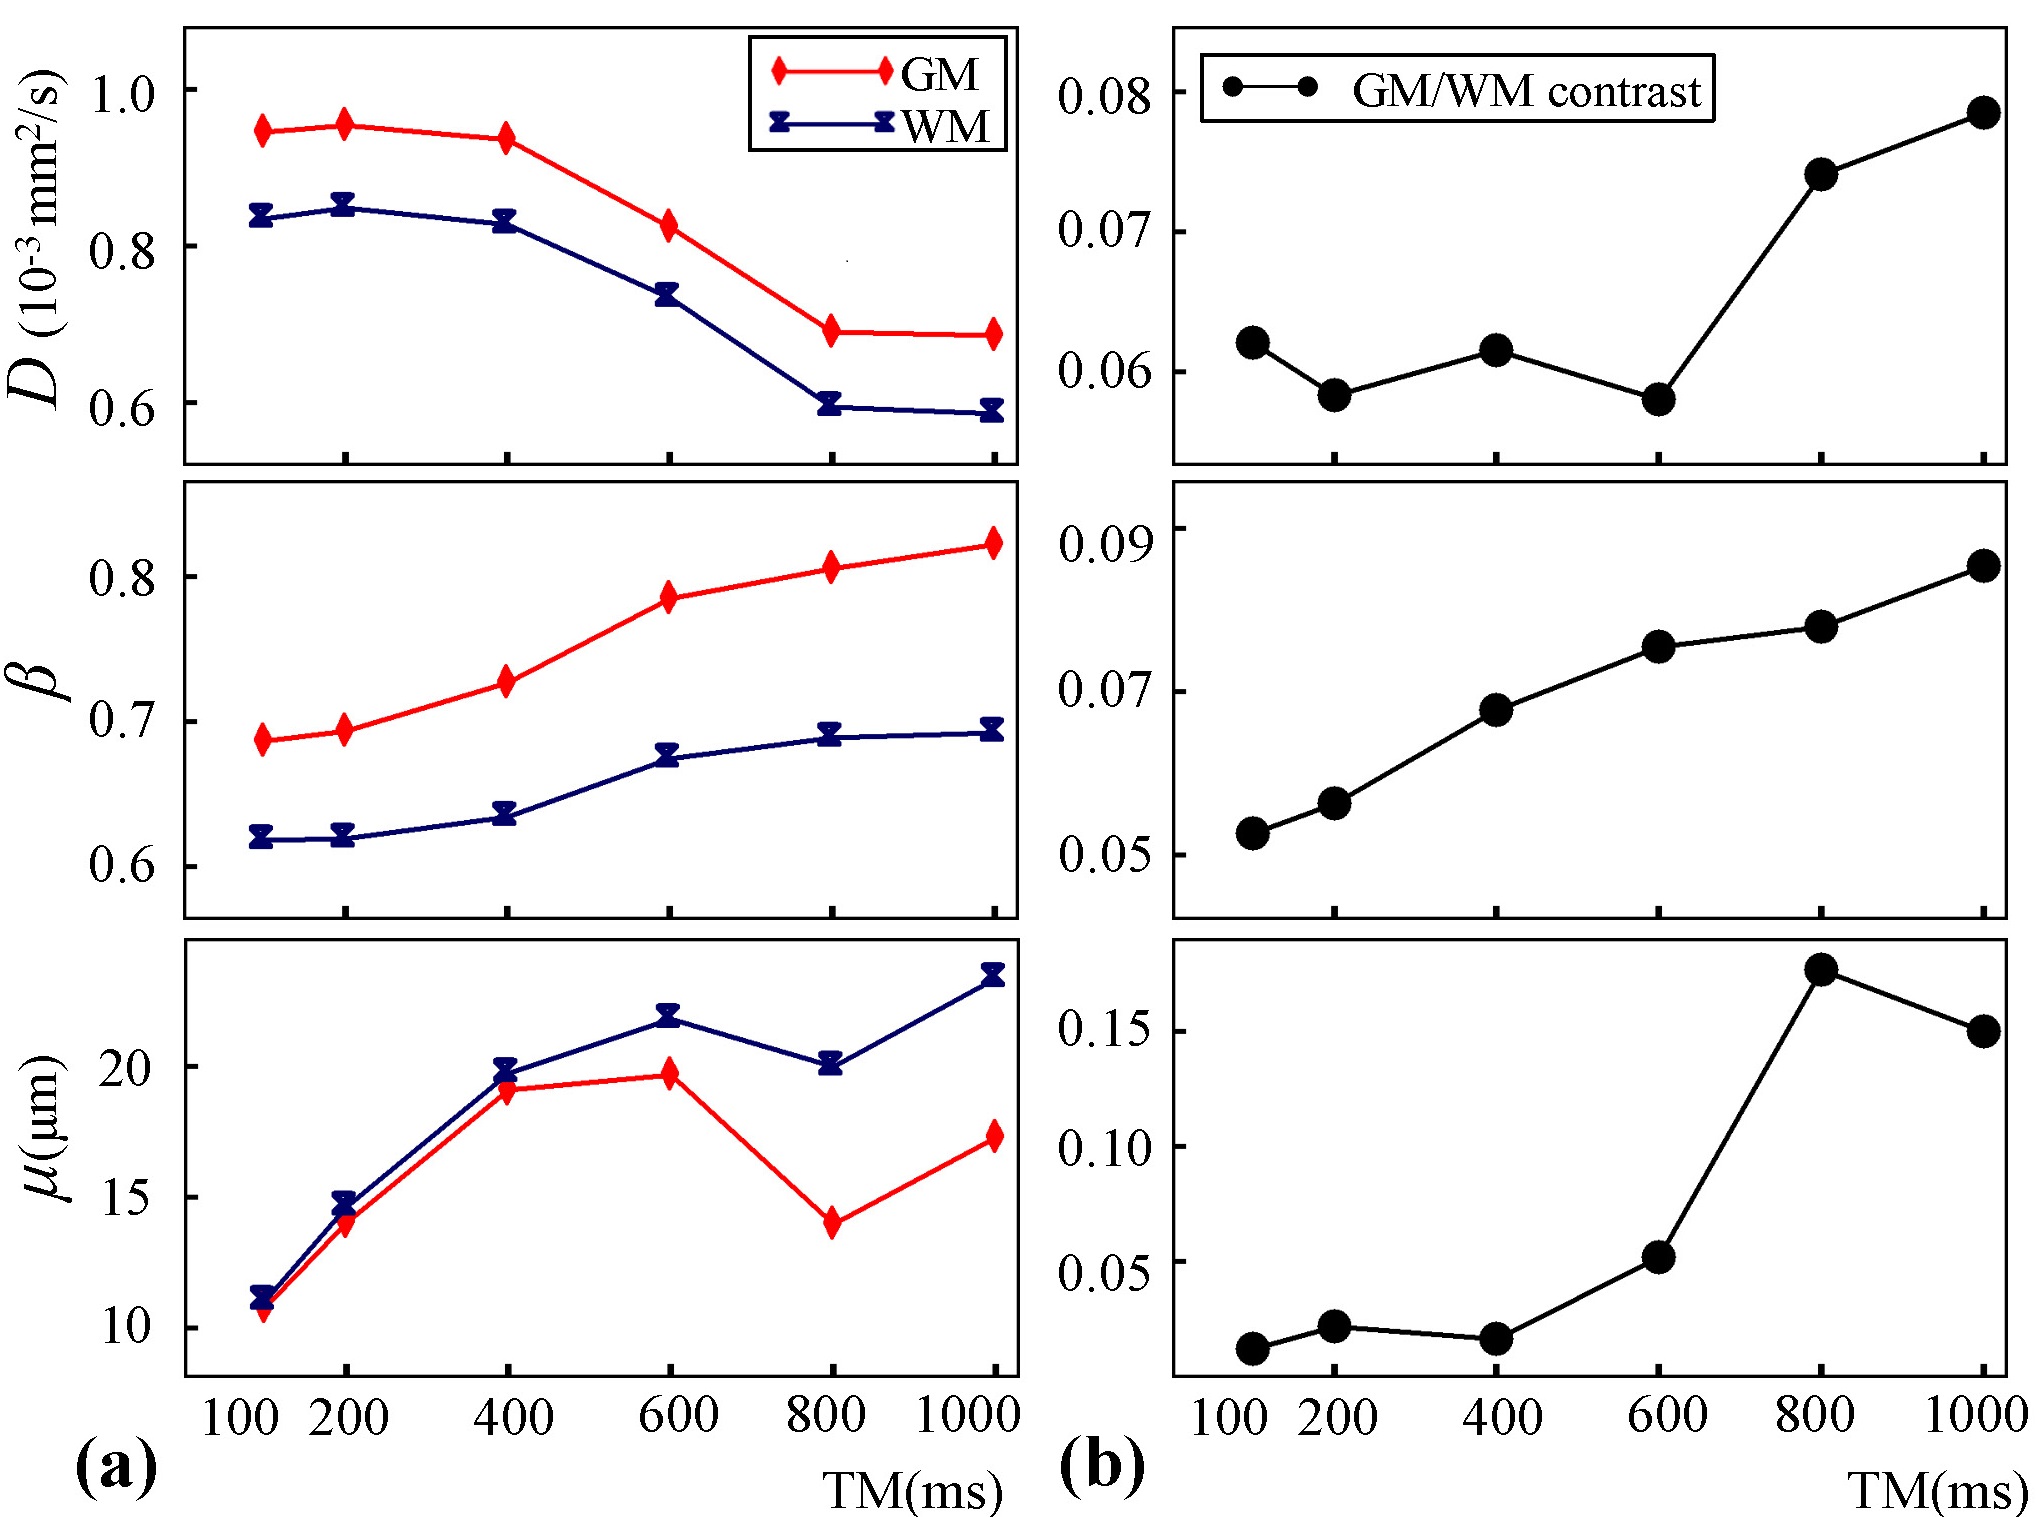
Figures 2-4 display a set of representative color-coded D, β, and μ maps of the FROC model at six TMs, respectively. With increased diffusion time (or TM), all the parameters exhibited substantial changes in both GM and WM regions. The time dependency of D, β, and μ is further illustrated in Figure 5a where the mean parameter values are plotted against TM for GM and WM ROIs. Among the three FROC model parameters, D decreased as TM increased, while both β and μ exhibited an increasing trend with the increased TM. The time dependency of the GM/WM contrast in D, β, and μ maps are shown in Figure 5b, where the GM/WM contrast increased with TM in all three FROC parameters.Discussion and Conclusion
The decrease in D at longer diffusion times was most likely caused by the increased diffusion restriction experienced by the water molecules; and is consistent with previous studies6,7. The parameter, μ, has been reported to be positively correlated with D at short diffusion times9. At longer diffusion times, such correlation no longer existed because μ exhibited an opposite trend to that of D. This was possibly caused by the increased heterogeneous environment sensed at longer diffusion times. The β parameter of the FROC model has been correlated with the intra-voxel diffusion heterogeneity. At short to intermediate diffusion times (e.g., < 100 ms), β was observed to decrease as diffusion time increased (data not shown). However, as the diffusion time became longer (e.g., > 100 ms), β began to show an increasing trend (Fig. 5a). The exact reason is unknown, possibly because of the varying impact of free, restricted, and hindered diffusion components on β, which requires further investigation. In conclusion, using a STEAM sequence, we have observed substantial dependence of FROC parameters on diffusion time. We have also found that a higher GM/WM contrast can be achieved at longer diffusion times in all FROC maps. These observations may provide new insights into the ongoing efforts to probe tissue microstructures using advanced diffusion imaging models.Acknowledgements
This work was supported in part by the National Institutes of Health (5R01EB026716-01 and 1S10RR028898-01). We thank Dr. Arnaud Guidon from GE healthcare for facilitating pulse sequence exchange and initiating the research collaboration. We also thank Dr. Richard L. Magin for helpful discussions.References
1. Bennett KM, Schmainda KM, Bennett R, et al. Characterization of continuously distributed cortical water diffusion rates with a stretched‐exponential model. Magn Reson Med. 2003;50(4):727-734.
2. Jensen JH, Helpern JA, Ramani A, et al. Diffusional kurtosis imaging: The quantification of non-Gaussian water diffusion by means of magnetic resonance imaging. Magn Reson Med. 2005;53:1432-1440.
3. Zhou XJ, Gao Q, Abdullah O, et al. Studies of anomalous diffusion in the human brain using fractional order calculus. Magn Reson Med. 2010;63:562-569.
4. Ingo C, Magin RL, Colon-Perez L, et al. On random walks and entropy in diffusion-weighted magnetic resonance imaging studies of neural tissue. Magn Reson Med. 2014;71:617-627.
5. Karaman M, Sui Y, Wang H, et al. Differentiating low- and high-grade pediatric brain using a continuous-time random-walk diffusion model at high b-value. Magn Reson Med. 2016;76:1149-1157.
6. Zhang Y, Wells SA, Hernando D. Stimulated echo based mapping (STEM) of T1, T2, and apparent diffusion coefficient: validation and protocol optimization. Magn Reson Med. 2019;81:167-181.
7. Novikov DS, Jensen JH, Helpern JA, et al. Revealing mesoscopic structural universality with diffusion. PNAS. 2014;111(14):5088-93.
8. Zhang H, Sun A, Li H, et al. Stimulated echo diffusion weighted imaging of the liver at 3 Tesla. Magn Reson Med. 2017;77(1): 300-309.
9. Sui Y, Wang H, Liu G, et al. Differentiation of low-and high-grade pediatric brain tumors with high b-value diffusion-weighted MR imaging and a fractional order calculus model. Radiology. 2015;277(2): 489-96.
Figures