4382
High-resolution microscopic diffusion anisotropy imaging in the human hippocampus using multidimensional diffusion encoding1UCL Great Ormond Street Institute of Child Health, London, United Kingdom, 2UCL Centre for Medical Image Computing, London, United Kingdom
Synopsis
Several neurological diseases are associated with microstructural changes in the hippocampus which can be observed using diffusion MRI. However, DTI derived microstructural metrics such as fractional anisotropy (FA) are not able to differentiate between orientation dispersion and microscopic anisotropy. In this study, we applied an optimised multidimensional diffusion encoding sequence to measure microscopic fractional anisotropy (µFA) and normalised size variance (CMD) in the human hippocampus of healthy subjects. We also defined a clinically feasible acquisition protocol by subsampling the full data set.
Introduction
DTI of the human hippocampus has shown changes in mean diffusivity (MD) and fractional anisotropy (FA) associated with neurological diseases such as epilepsy1. However, single diffusion encoding (SDE) methods like DTI are fundamentally unable to disentangle the sources of diffusion kurtosis such as microscopic anisotropy and size distribution2-4. This can be seen in that FA appears low in voxels containing highly anisotropic microscopic structures and a high degree of orientation dispersion4. Multidimensional diffusion encoding (MDE) disentangles microscopic diffusion anisotropy (µFA), orientation dispersion, and isotropic size variance (CMD), providing more detailed information about tissue microstructure5,6. In this study, we applied an optimised microstructural imaging protocol combining linear tensor encoding (LTE) and spherical tensor encoding (STE)5 to map µFA and CMD in the human hippocampus at high-resolution.Methods
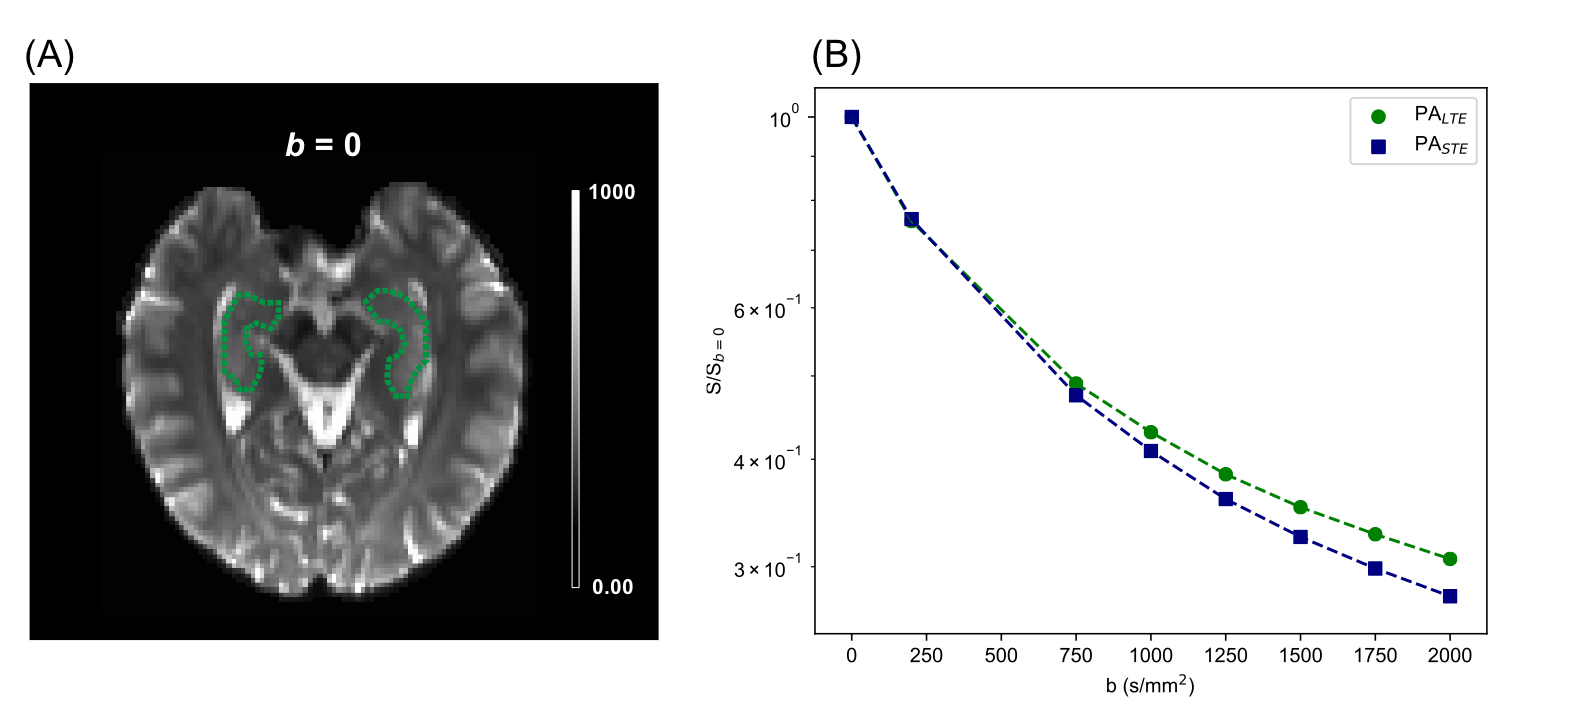
Imaging protocolTwo healthy adult volunteers were scanned on a 3T Siemens Prisma system with maximum gradient strength of 80 mT/m, maximum slew rate of 200 T/m/s, and a 20-channel head-coil array. Prior to the diffusion-weighted sequence, T1-MPRAGE was acquired to locate 30 slices parallel to the long axis of the hippocampus for the diffusion-weighted acqusition7. We used an in-house developed diffusion-weighted EPI sequence that enables measurements with arbitrary gradient waveforms. The diffusion sequence consisted of optimised8 and Maxwell-compensated9 LTE and STE waveforms with b-values of [200,750,1000,1250,1500,1750,2000] s/mm2 that were interleaved to reduce the pressure on the gradient system (Figure 1). Twelve directions were used for b-values less than 1500 and 32 directions for the rest. Imaging parameters used were TR=4.6s, TE=101ms, resolution=1.5x1.5x1.5mm3, FOV = 216x216mm2, Partial-Fourier=6/8, GRAPPA R=2, and 2 averages. Data pre-processing steps were Marchenko-Pastur denoising10, Gibbs ringing reduction11, and susceptibility and eddy-current induced distortion correction using topup and eddy in FSL12. The hippocampus was manually segmented in the reference mean b=0 image (Figure 3A). The overall scan time was 1 hour.
A subsampled data set was extracted from the full data set with the following parameters: b-values of [200,750,1250,1500,1750,2000] s/mm2 with [4,4,4,16,16,32] directions, respectively. The subsampled dataset can be acquired in 14 minutes, making it more feasible for high-resolution microstructural imaging of the hippocampus in a clinical setting.
Quantification of microstructural metrics
Microscopic fractional anisotropy (µFA) is a normalised measure of the average eigenvalue variance of the microscopic diffusion tensors2, and several methods for quantification of µFA from MDE data have been proposed. In Q-space trajectory imaging (QTI), tissue microstructure in a voxel is represented by a distribution of Gaussian diffusion tensors $$$\mathbf{D}$$$ and the signal representation depends on the classical second-order diffusion tensor $$$\langle\mathbf{D}\rangle$$$ and the novel fourth-order covariance tensor $$$\mathbb{C}$$$. MDE also enables the estimation of normalised size variance of the microscopic diffusion tensors, CMD. Based on QTI, µFA and CMD were quantified as:
$$\mu FA=\sqrt{\frac{3}{2}\frac{<\langle\mathbf{D}^{\otimes 2}\rangle,\mathbb{E}_{\text{shear}}>}{<\langle\textbf{D}^{\otimes2}\rangle,\mathbb{E}_{\text{iso}} >}}(Eq.1)$$
and
$$C_{MD}=\frac{<\mathbb{C},\mathbb{E}_{\text{bulk}}>}{<\langle\mathbf{D}^{\otimes 2}\rangle,\mathbb{E}_{\text{bulk}}>}(Eq.2)$$
where $$$\langle\mathbf{D}^{\otimes 2}\rangle$$$ and $$$\mathbb{C}$$$ were estimated and $$$\mathbb{E}_{\text{shear}}$$$, $$$\mathbb{E}_{\text{iso}}$$$, $$$\mathbb{E}_{\text{bulk}}$$$ were defined as specified in Westin et al.5 using the multidimensional diffusion MRI toolbox13.
MD and FA were extracted from a DTI fit to LTE data using DiPy14.
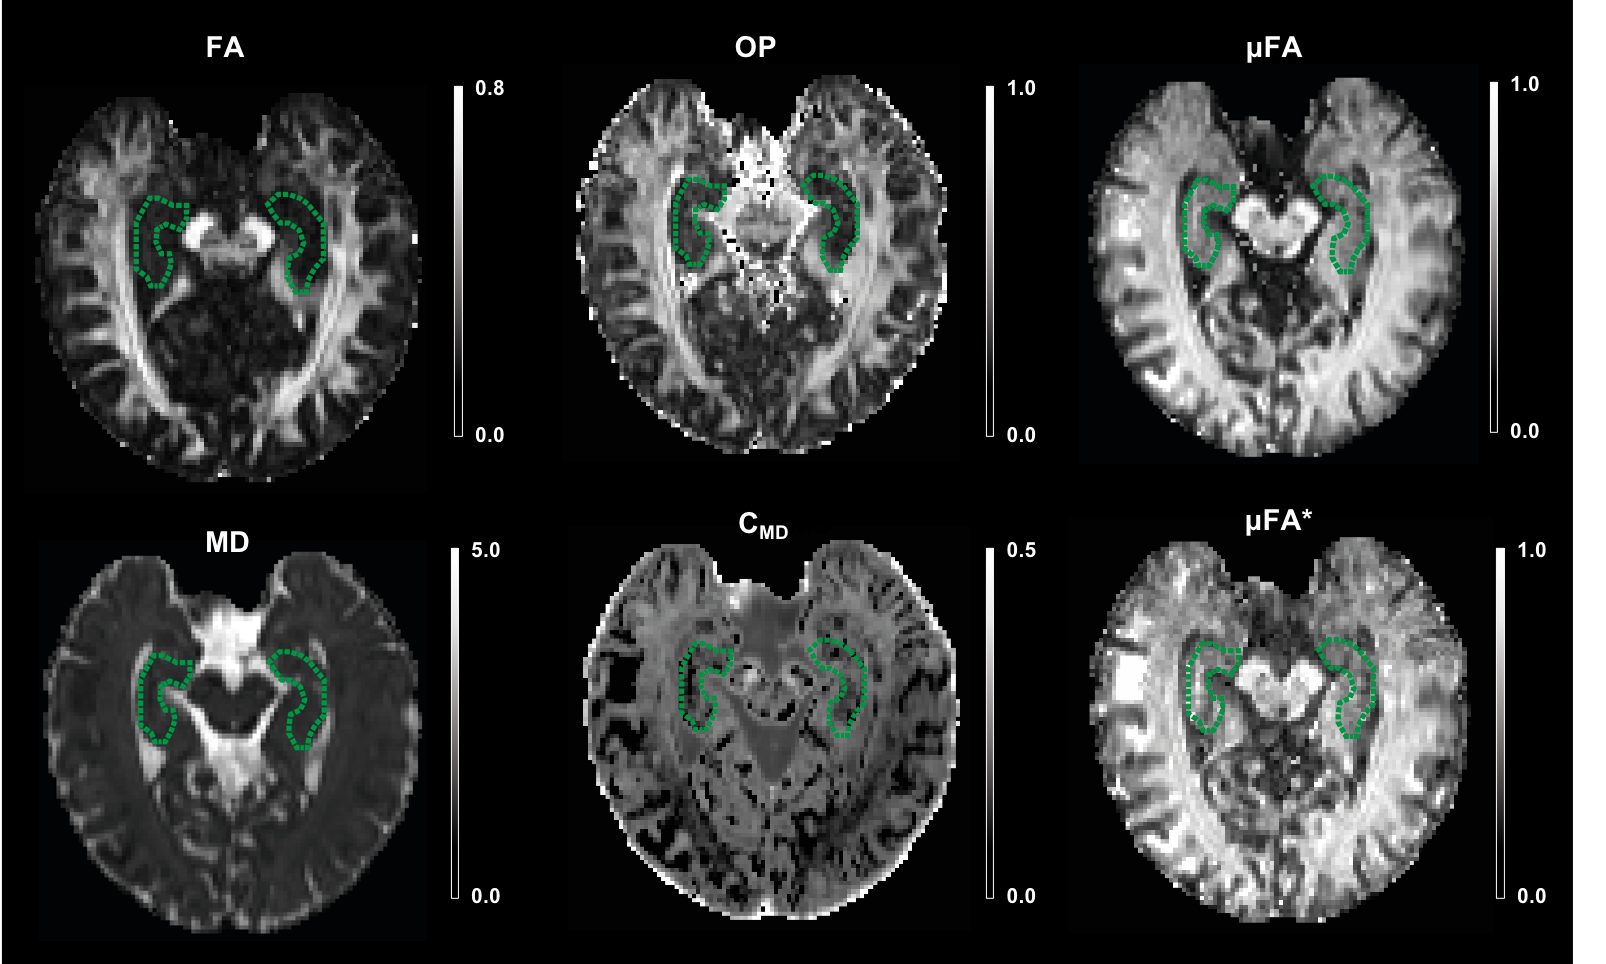
Order parameter (OP), a measure of orientation coherence of the microscopic compartments was quantified as FA divided by µFA.
Results
Figure 2 shows the powder-averaged (i.e. signal averaged over all gradient directions) data acquired with both b-tensor shapes and their difference. The manual segmentation of the hippocampus is illustrated in Figure 3A. The normalised powder-averaged signal decay curves for both LTE and STE acquisitions are shown in Figure 3B, where the difference in the signal decay curves indicates µFA. Additionally, the non-mono-exponential STE decay curve is evidence of isotropic size variance2. Microstructural maps are shown in Figure 4 and the values of these metrics are reported in Table 1. For subjects 1 and 2, hippocampus µFA was 0.49±0.09 and 0.48±0.10 which are greater than the corresponding FA values of 0.12±0.05 and 0.13±0.05. µFA calculated from the subsampled data (µFA*) had a slightly higher mean and larger variance in both subjects. However, the subsampled data set yielded visually similar maps to the full acquisition, suggesting novel microstructural information could be acquired in a clinically feasible scan time. The low OP maps reveal a high degree of orientation dispersion in the hippocampus. The large variance in CMD may suggest that isotropic size variance is difficult to reliably measure.Discussion
This study maps µFA in the human hippocampus using both a highly-sampled protocol and a reduced acquisition protocol which is specifically designed for high-resolution microstructural imaging of the hippocampus in the clinical setting. The clinical value of microstructural imaging of the hippocampus has been shown in previous studies. For instance, decreased FA and elevated MD values have been observed in the ipsilateral hippocampus of temporal lobe epilepsy patients with mesial temporal sclerosis15. Our protocol leverages the most recent advances in MDE and is able to provide more detailed characterisation of the hippocampus microstructure. Future research will focus on quantifying reference values of µFA in the healthy hippocampus by scanning more volunteers, increasing the resolution further and segmenting the hippocampal subfields for a more detailed analysis of microstructural properties of hippocampus.Conclusion
This study provides µFA maps in the healthy hippocampus using an acquisition protocol specifically designed for high-resolution microstructural imaging in the clinical setting.Acknowledgements
This study was funded by BBSRC with the London Interdisciplinary Bioscience PhD Consortium and NIHR GOSH BRC.References
[1] Nazem-Zadeh, M.R., Schwalb, J.M., Elisevich, K.V., Bagher-Ebadian, H., Hamidian, H., Akhondi-Asl, A.R., Jafari-Khouzani, K. and Soltanian-Zadeh, H., 2014. Lateralization of temporal lobe epilepsy using a novel uncertainty analysis of MR diffusion in hippocampus, cingulum, and fornix, and hippocampal volume and FLAIR intensity. Journal of the neurological sciences, 342(1-2), pp.152-161.
[2] Topgaard, D., 2017. Multidimensional diffusion MRI. Journal of Magnetic Resonance, 275, pp.98-113.
[3] Szczepankiewicz, F., Lasič, S., van Westen, D., Sundgren, P.C., Englund, E., Westin, C.F., Ståhlberg, F., Lätt, J., Topgaard, D. and Nilsson, M., 2015. Quantification of microscopic diffusion anisotropy disentangles effects of orientation dispersion from microstructure: applications in healthy volunteers and in brain tumors. NeuroImage, 104, pp.241-252.
[4] Lasič, S., Szczepankiewicz, F., Eriksson, S., Nilsson, M. and Topgaard, D., 2014. Microanisotropy imaging: quantification of microscopic diffusion anisotropy and orientational order parameter by diffusion MRI with magic-angle spinning of the q-vector. Frontiers in Physics, 2, p.11.
[5] Westin, C.F., Knutsson, H., Pasternak, O., Szczepankiewicz, F., Özarslan, E., van Westen, D., Mattisson, C., Bogren, M., O'Donnell, L.J., Kubicki, M. and Topgaard, D., 2016. Q-space trajectory imaging for multidimensional diffusion MRI of the human brain. NeuroImage, 135, pp.345-362.
[6] Shemesh, N., Jespersen, S.N., Alexander, D.C., Cohen, Y., Drobnjak, I., Dyrby, T.B., Finsterbusch, J., Koch, M.A., Kuder, T., Laun, F. and Lawrenz, M., 2016. Conventions and nomenclature for double diffusion encoding NMR and MRI. Magnetic resonance in medicine, 75(1), pp.82-87.
[7] Treit, S., Steve, T., Gross, D.W. and Beaulieu, C., 2018. High resolution in-vivo diffusion imaging of the human hippocampus. Neuroimage, 182, pp.479-487.
[8] Sjölund, J., Szczepankiewicz, F., Nilsson, M., Topgaard, D., Westin, C.F. and Knutsson, H., 2015. Constrained optimization of gradient waveforms for generalized diffusion encoding. Journal of Magnetic Resonance, 261, pp.157-168.
[9] Szczepankiewicz, F., Westin, C.F. and Nilsson, M., 2019. Maxwell‐compensated design of asymmetric gradient waveforms for tensor‐valued diffusion encoding. Magnetic resonance in medicine.
[10] Veraart, J., Novikov, D.S., Christiaens, D., Ades-Aron, B., Sijbers, J. and Fieremans, E., 2016. Denoising of diffusion MRI using random matrix theory. NeuroImage, 142, pp.394-406.
[11] Kellner, E., Dhital, B., Kiselev, V.G. and Reisert, M., 2016. Gibbs‐ringing artifact removal based on local subvoxel‐shifts. Magnetic resonance in medicine, 76(5), pp.1574-1581.
[12] Smith, S.M., Jenkinson, M., Woolrich, M.W., Beckmann, C.F., Behrens, T.E., Johansen-Berg, H., Bannister, P.R., De Luca, M., Drobnjak, I., Flitney, D.E. and Niazy, R.K., 2004. Advances in functional and structural MR image analysis and implementation as FSL. Neuroimage, 23, pp.S208-S219.
[13] Markus Nilsson, Filip Szczepankiewicz, Björn Lampinen, André Ahlgren, João P. de Almeida Martins, Samo Lasic, Carl-Fredrik Westin, and Daniel Topgaard. An open-source framework for analysis of multidimensional diffusion MRI data implemented in MATLAB. Proc. Intl. Soc. Mag. Reson. Med. (26), Paris, France, 2018.
[14] E. Garyfallidis, M. Brett, B. Amirbekian, A. Rokem, S. Van Der Walt, M. Descoteaux, I. Nimmo-Smith and DIPY contributors, "DIPY, a library for the analysis of diffusion MRI data", Frontiers in Neuroinformatics, vol. 8, p. 8, Frontiers, 2014.
[15] Chiang, S., Levin, H.S., Wilde, E. and Haneef, Z., 2016. White matter structural connectivity changes correlate with epilepsy duration in temporal lobe epilepsy. Epilepsy research, 120, pp.37-46.
Figures