4381
Diffusion MRI response function estimates vary more across pathways than across subjects1Vanderbilt University Institute of Imaging Science, Nashville, TN, United States, 2Biomedical Engineering, Vanderbilt University, Nashville, TN, United States, 3Radiology and Radiological Sciences, Vanderbilt University Medical Center, Nashville, TN, United States, 4Electrical Engineering, Vanderbilt University, Nashville, TN, United States, 5Image Sciences Institute, University Medical Center Utrecht, Utrecht, Netherlands, 6CUBRIC, School of Physics, Cardiff University, Cardiff, United Kingdom
Synopsis
We investigated the diffusion fiber response function by characterizing the modelled diffusivity, the shape, and the size of the diffusion signal in regions of single fiber populations. We show that the various descriptors of the diffusion signal vary significantly across white matter pathways within a subject, and across subjects for a given pathway. Analysis of variance suggests that variability between pathways is greater than across subjects. Understanding the response function and its variation are necessary for accurate fiber orientation characterization, as well as characterizing microstructural effects from geometrical effects within a voxel.
Introduction
The diffusion MRI signal is sensitive to structures on the micrometer length scale and thus aids investigations into tissue microstructural properties, for example compartmental signal fractions, apparent diffusivities, sizes, and orientation dispersion. However, there appears to be a limit to the number of parameters that can be reliably estimated from dMRI data1. The remedy is usually to separate estimation of orientation- and microstructure-information or to fix parameters to a predefined value. For example, fiber orientation distributions are commonly computed by first estimating a global fiber response function (which represents the signal from ‘straight’ axons of a single bundle). In turn, the orientation distribution can be factorized out and/or crossing fascicles can be assumed to have the same microstructural properties to simplify the problem. Here, we sought to study a regime with lower complexity and focus on voxels with a single fiber population (SFP). Estimates of the global response function are commonly obtained from SFP-voxels, and studies suggest this estimate does not show significant variation across subjects2. Alternatively, it is well known that diffusion properties vary across the brain3, and investigations distinguishing SFP’s by pathway suggest that variability between tracts may exceed inter-subject variability4,5–variation that may be obscured when averaging across the whole brain. Understanding the variations in response function estimates across pathways and individuals may play a role in accurately quantifying microstructural properties and fiber distributions in both single-and multi-fiber voxels.Methods
For 15 subjects, we investigate diffusion-weighted signal in SFPs of 12 WM pathways, utilizing several measures to describe the signal in SFPs comprising estimates of the response function. We ask (1)Within a subject, do these measures vary across pathways? (2)Given a pathway, do these measures vary across subjects? And (3)Across a population, do these measures differ by subject, differ by pathway, and is there interaction so that pathways differ by subject?We utilized scans from the MGH-USCH HCP dataset, acquired on a Siemens 3T Connectom scanner (1.5mm isotropic resolution, b-values=1,000, 3,000, 5,000, and 10,000s/mm2).
We first extract SFP-voxels (i.e, a single peak in the fiber distribution). To do this, we use multi-shell multi-tissue constrained spherical deconvolution6, retaining only voxels with a ratio of second-peak/first-peak amplitude smaller than a preset ratio threshold (0.05) to define our final SFP mask. We implemented whole-brain tractography and Recobundles7 tract-extraction to allocate SFPs to 12 WM pathways. Figure 1 shows tracts and SFP-voxels in a representative subject.
The diffusion signal in SFPs was characterized using 8 measures, including diffusion tensor measures of mean, axial, and radial diffusivities (MD, AD, RD), and the tensor shape and scale8. Scale is derived from RD and represents isotropic diffusion, whereas shape depends on AD and RD differences and represents anisotropic diffusion. These metrics were analyzed for b=1000.
For all shells, we characterized fiber response function estimates using an additional descriptor deemed “signal in the fiber-frame”. We executed a global search for the fiber-frame axis in which the signal is most nearly axisymmetric. Spherical harmonic (SH) coefficients of the response function (i.e., the signal in the fiber-frame) are calculated, with only m=0 components given for p=2:2:pMax, where pMax=6. Thus, we are attempting to describe only the anisotropic part of the response (subtracting the isotropic part) using 3 coefficients (c(2),c(4),c(6)) in the SH expansion.
Results
Figure 2 shows boxplots of SFP descriptors across 12 pathways for a representative subject, as well as glyphs of the anisotropic part of the estimated response function for each pathway. Variation in modelled diffusivity, and response function shape and size, are apparent across pathways.Figure 3 shows boxplots and glyphs for a representative pathway across all subjects. Small differences are observable, suggesting variation across subjects for a given pathway.
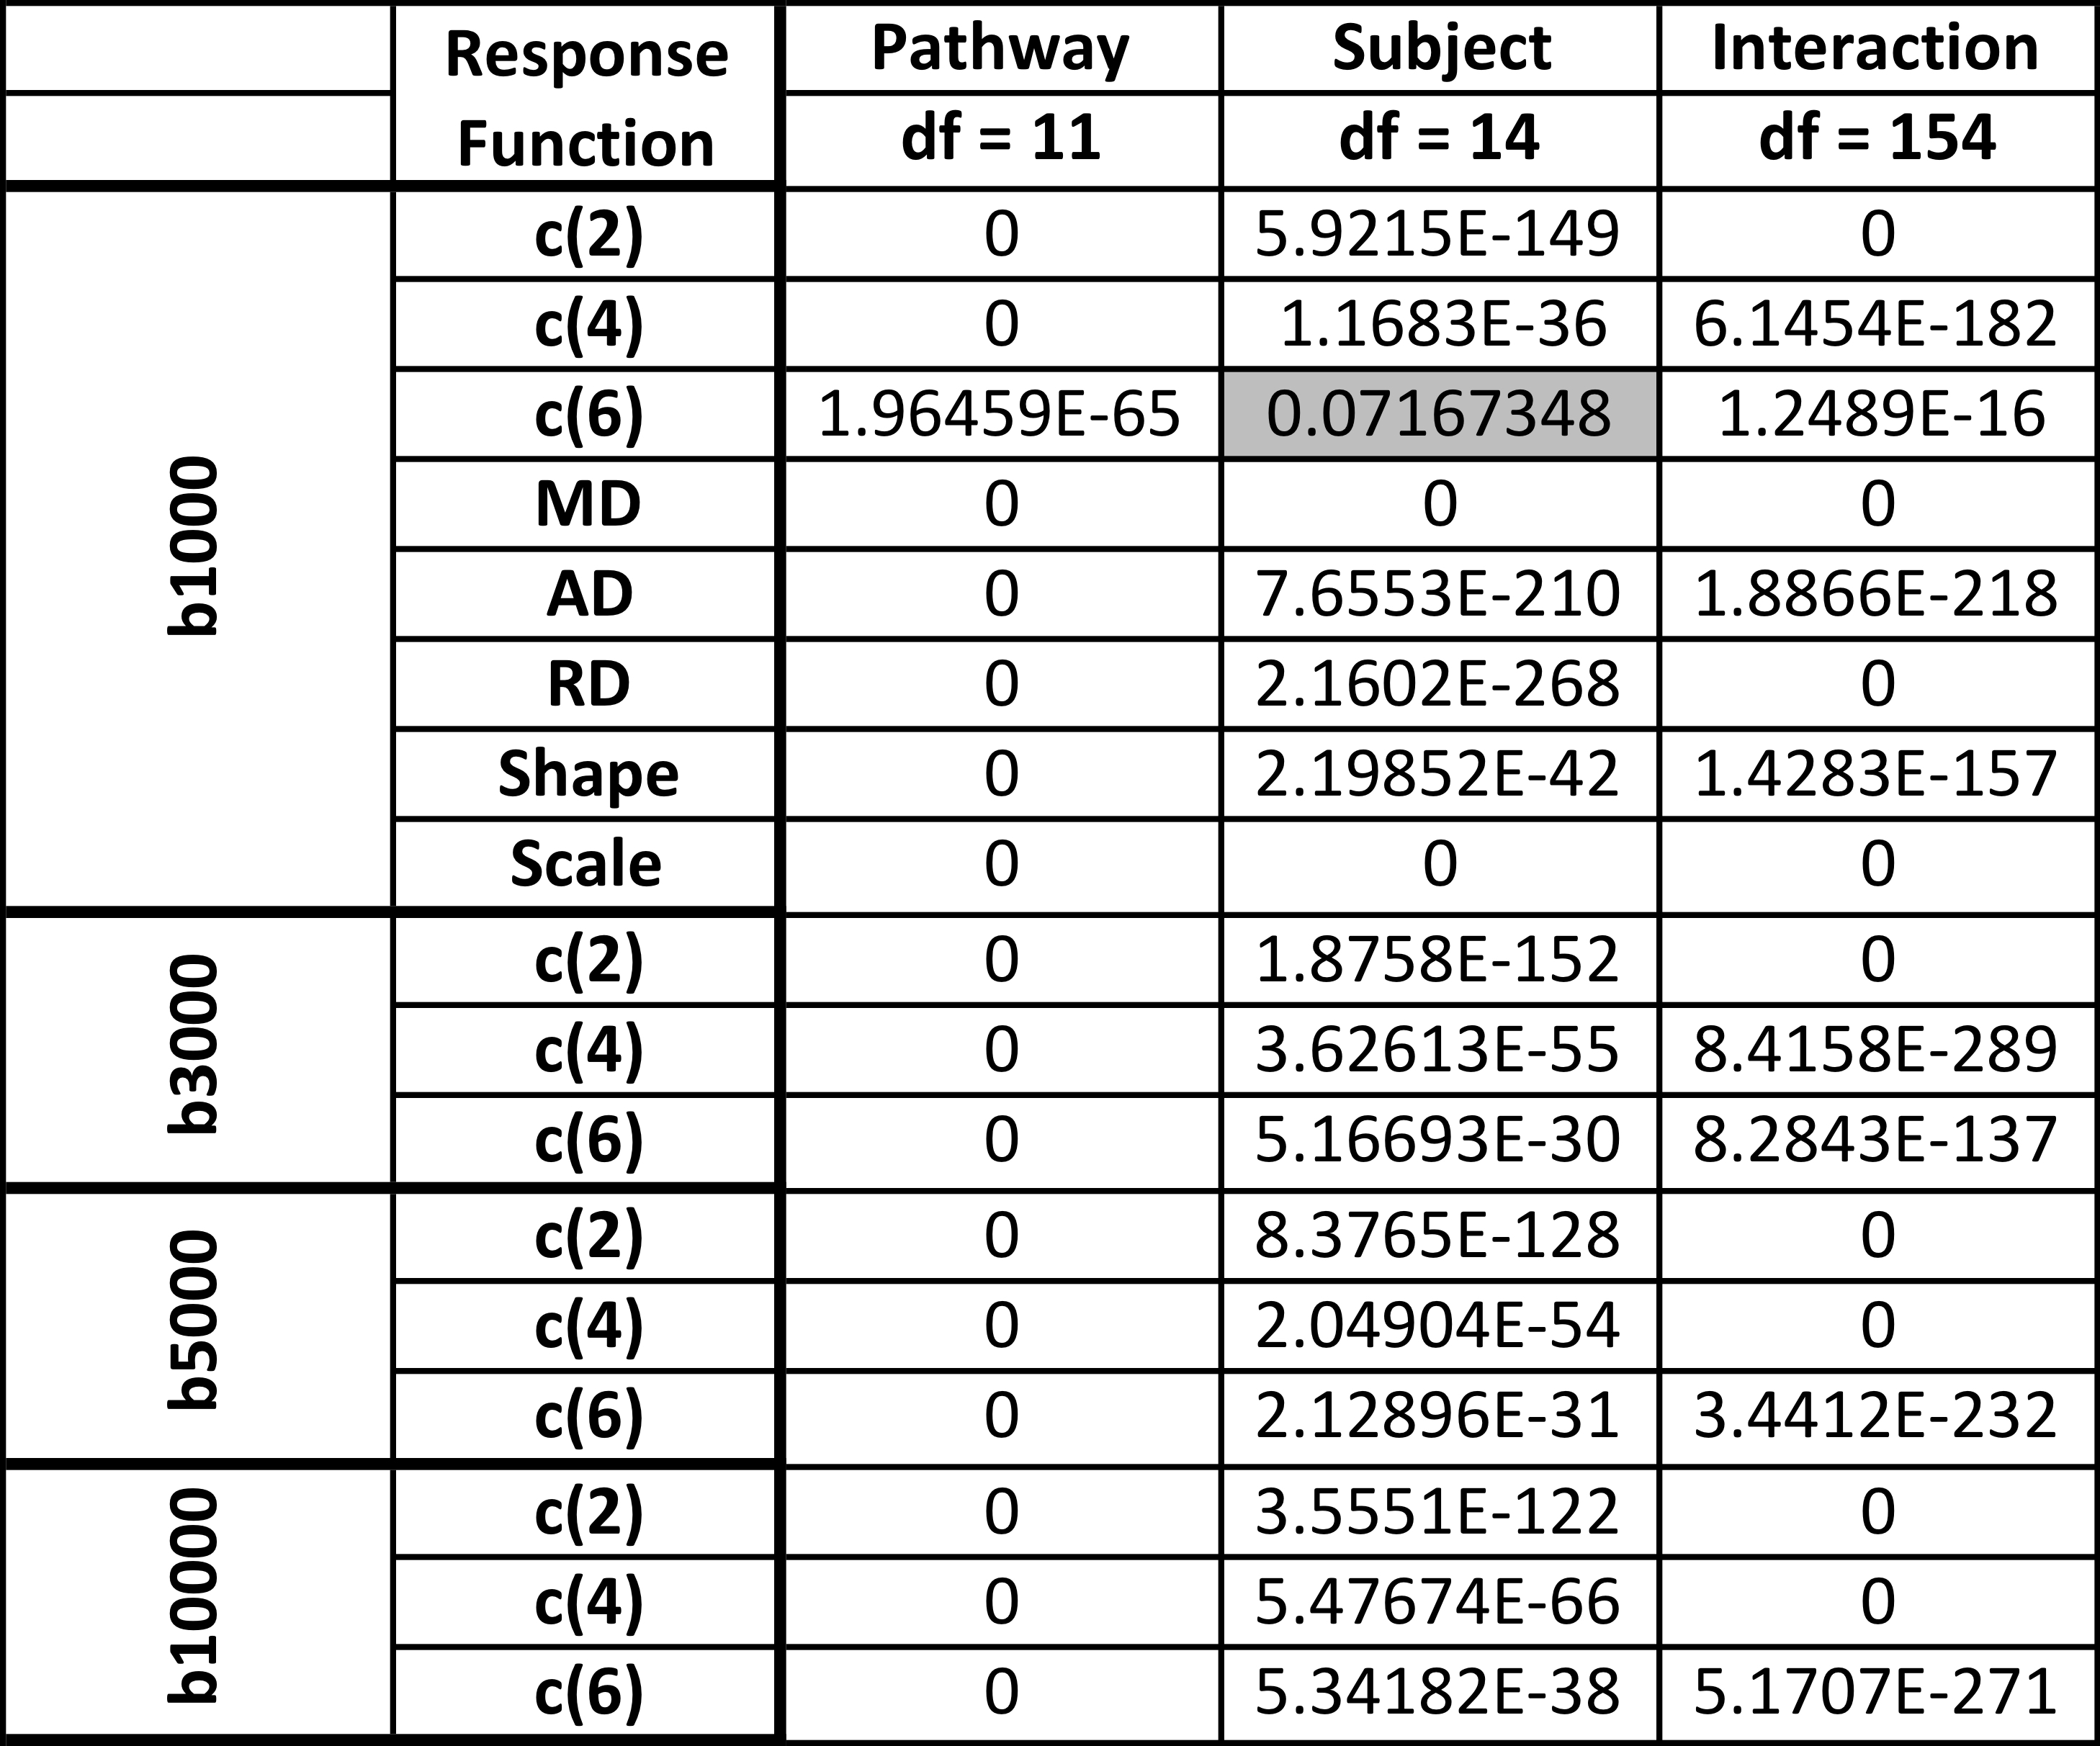
Variation was quantified using a one-way ANOVA test (Table 1). First, for every subject, we tested whether these descriptors vary across pathways. Table 1(top) shows that all measures vary across the brain (more specifically, at least one group is different from the others), with the exception of the c(6) for b=1000. Second, for every pathway, we tested whether there is significant variation across subjects. Table 1,(bottom) shows all measures vary significantly across subjects, with the exception of c(6) and measures of the anisotropic estimated response function in the UF.
Finally, an n-way ANOVA (factors of subject and pathway, with two-factor interaction) suggests that across a population, all metrics vary across pathways and subjects (Table 2). Importantly, variation across pathways has larger F-statistics, suggesting that variability is greater across pathways than between subjects.
Discussion
We show that various measures derived from the diffusion signal in SFP-regions vary across the brain and across subjects. Importantly, we find more variation across pathways than across subjects.Variation in the estimated response function may affect tracking in special cases9,10 and may also affect population studies11 of apparent fibre density12 or hindrance-modulated orientational-anisotropy13. To advance microstructural modeling in complex WM, it's critical to disambiguate angular affects from intrinsic diffusion effects, and in this context, it’s important to have knowledge of the voxel-wise response function, and this study paves the way to characterize its variability. Future studies will investigate changes along pathways, and attempt to characterize the signal corresponding to specific bundles in crossing-fiber regions.
Acknowledgements
Acknowledgements CMWT is supported by a Rubicon grant (680-50-1527) from the Netherlands Organisation for Scientific Research (NWO) and a Sir Henry Wellcome Fellowship (215944/Z/19/Z). This work was conducted in part using the resources of the Advanced Computing Center for Research and Education at Vanderbilt University, Nashville, TN. This work was supported by the National Institutes of Health under award numbers R01EB017230, RO1NS058639, and T32EB001628.References
1. Tax, C.M., et al., Recursive calibration of the fiber response function for spherical deconvolution of diffusion MRI data.Neuroimage, 2014. 86: p. 67-80.
2. Tournier, J.D., F. Calamante, and A. Connelly, Robust determination of the fibre orientation distribution in diffusion MRI: non-negativity constrained super-resolved spherical deconvolution.Neuroimage, 2007. 35(4): p. 1459-72.
3. Jeurissen, B., J. Sijbers, and J.-D. Tournier. Assessing inter-subject variability of white matter response functions used for constrained spherical deconvolution. in Proc. Intl. Soc. Mag. Reson. Med. 23. 2015.
4. Fieremans, E., J.H. Jensen, and J.A. Helpern, White matter characterization with diffusional kurtosis imaging.Neuroimage, 2011. 58(1): p. 177-88.
5. Tax, C.M.W., Less Confusion in Diffusion MRI. 2016, Utrecht University: Utrecht University.
6. Tax, C.M.W., et al. Localizing and characterizing single fiber populations throughout the brain. in Proc. Intl. Soc. Mag. Reson. Med. 23. 2015.
7. Jeurissen, B., et al., Multi-tissue constrained spherical deconvolution for improved analysis of multi-shell diffusion MRI data.Neuroimage, 2014. 103: p. 411-426.
8. Garyfallidis, E., et al., Recognition of white matter bundles using local and global streamline-based registration and clustering.Neuroimage, 2018. 170: p. 283-295.
9. Dell'Acqua, F., et al., A model-based deconvolution approach to solve fiber crossing in diffusion-weighted MR imaging.IEEE Trans Biomed Eng, 2007. 54(3): p. 462-72.
10. Schilling, K.G., et al., Histologically derived fiber response functions for diffusion MRI vary across white matter fibers-An ex vivo validation study in the squirrel monkey brain.NMR Biomed, 2019. 32(6): p. e4090.
11. Guo, F., et al., Effects of Inaccurate Response Function Calibration on Characteristics of the Fiber Orientation Distribution in Diffusion MRI.bioRxiv, 2019: p. 760546.
12. Raffelt, D., et al., Apparent Fibre Density: a novel measure for the analysis of diffusion-weighted magnetic resonance images.Neuroimage, 2012. 59(4): p. 3976-94.
13. Dell'Acqua, F., et al., Can spherical deconvolution provide more information than fiber orientations? Hindrance modulated orientational anisotropy, a true-tract specific index to characterize white matter diffusion.Hum Brain Mapp, 2013. 34(10): p. 2464-83.
Figures