4380
Reproducibility crisis in diffusion MRI: Contribution of software processing pipelines1Harvard Medical School, Boston, MA, United States, 2Brigham and Women's Hospital, Boston, MA, United States
Synopsis
This study attempts to highlight the reproducibility problem in clinical diffusion MRI studies by comparing different software in a large diffusion MRI data, collected from multiple sites with 291 schizophrenia patients and 251 healthy controls. We fit diffusion tensor using FSL, MRtrix and Slicer with ordinary-least-squares (OLS) and weighted-least-squares (WLS) methods. To assess biological differences (measured by FA) between controls and patients, we computed effect-sizes (Cohen’s d) at each site using each software. We observed significant software effects with each software package producing significantly different results, when either OLS or WLS, was used.
Introduction
Echo-planar imaging acquisitions for diffusion MRI (dMRI) can be affected by eddy current and geometric distortions. Previous studies have demonstrated the necessity for correcting for these distortions in dMRI data1,2,3. However, the effects of different diffusion tensor fitting software on diffusion measures have not been explored in a large clinical dataset. With the advent of large multi-site datasets collected worldwide and pooled together for joint analysis, it is imperative to know how different processing pipelines for even the simplest diffusion tensor imaging (DTI) model affects statistical results. This is critical as results from various DTI studies in mental disorders produce inconsistent and conflicting results, leading to very low reproducibility of the findings4,5,6. Further, a popular method to pool multi-site data involves using meta/mega analysis7 often involves pooling data processed with different software packages. How such pooling affects the effect-sizes between groups has not been well characterized. This study highlights and attempts to quantify the effects of software-specific DTI fits on fractional anisotropy (FA), the conventional DTI measure of white matter (WM) integrity, in a large dMRI dataset. We fit diffusion tensor using FSL, MRtrix and Slicer with ordinary least squares (OLS) and weighted least squares (WLS) methods. Additionally, to assess whether the inter-group variability (biological differences are measured by FA, between healthy controls and schizophrenia patients) is preserved, we quantified the software effects in multiple clinical dMRI datasets acquired with different acquisition parameters.Methods
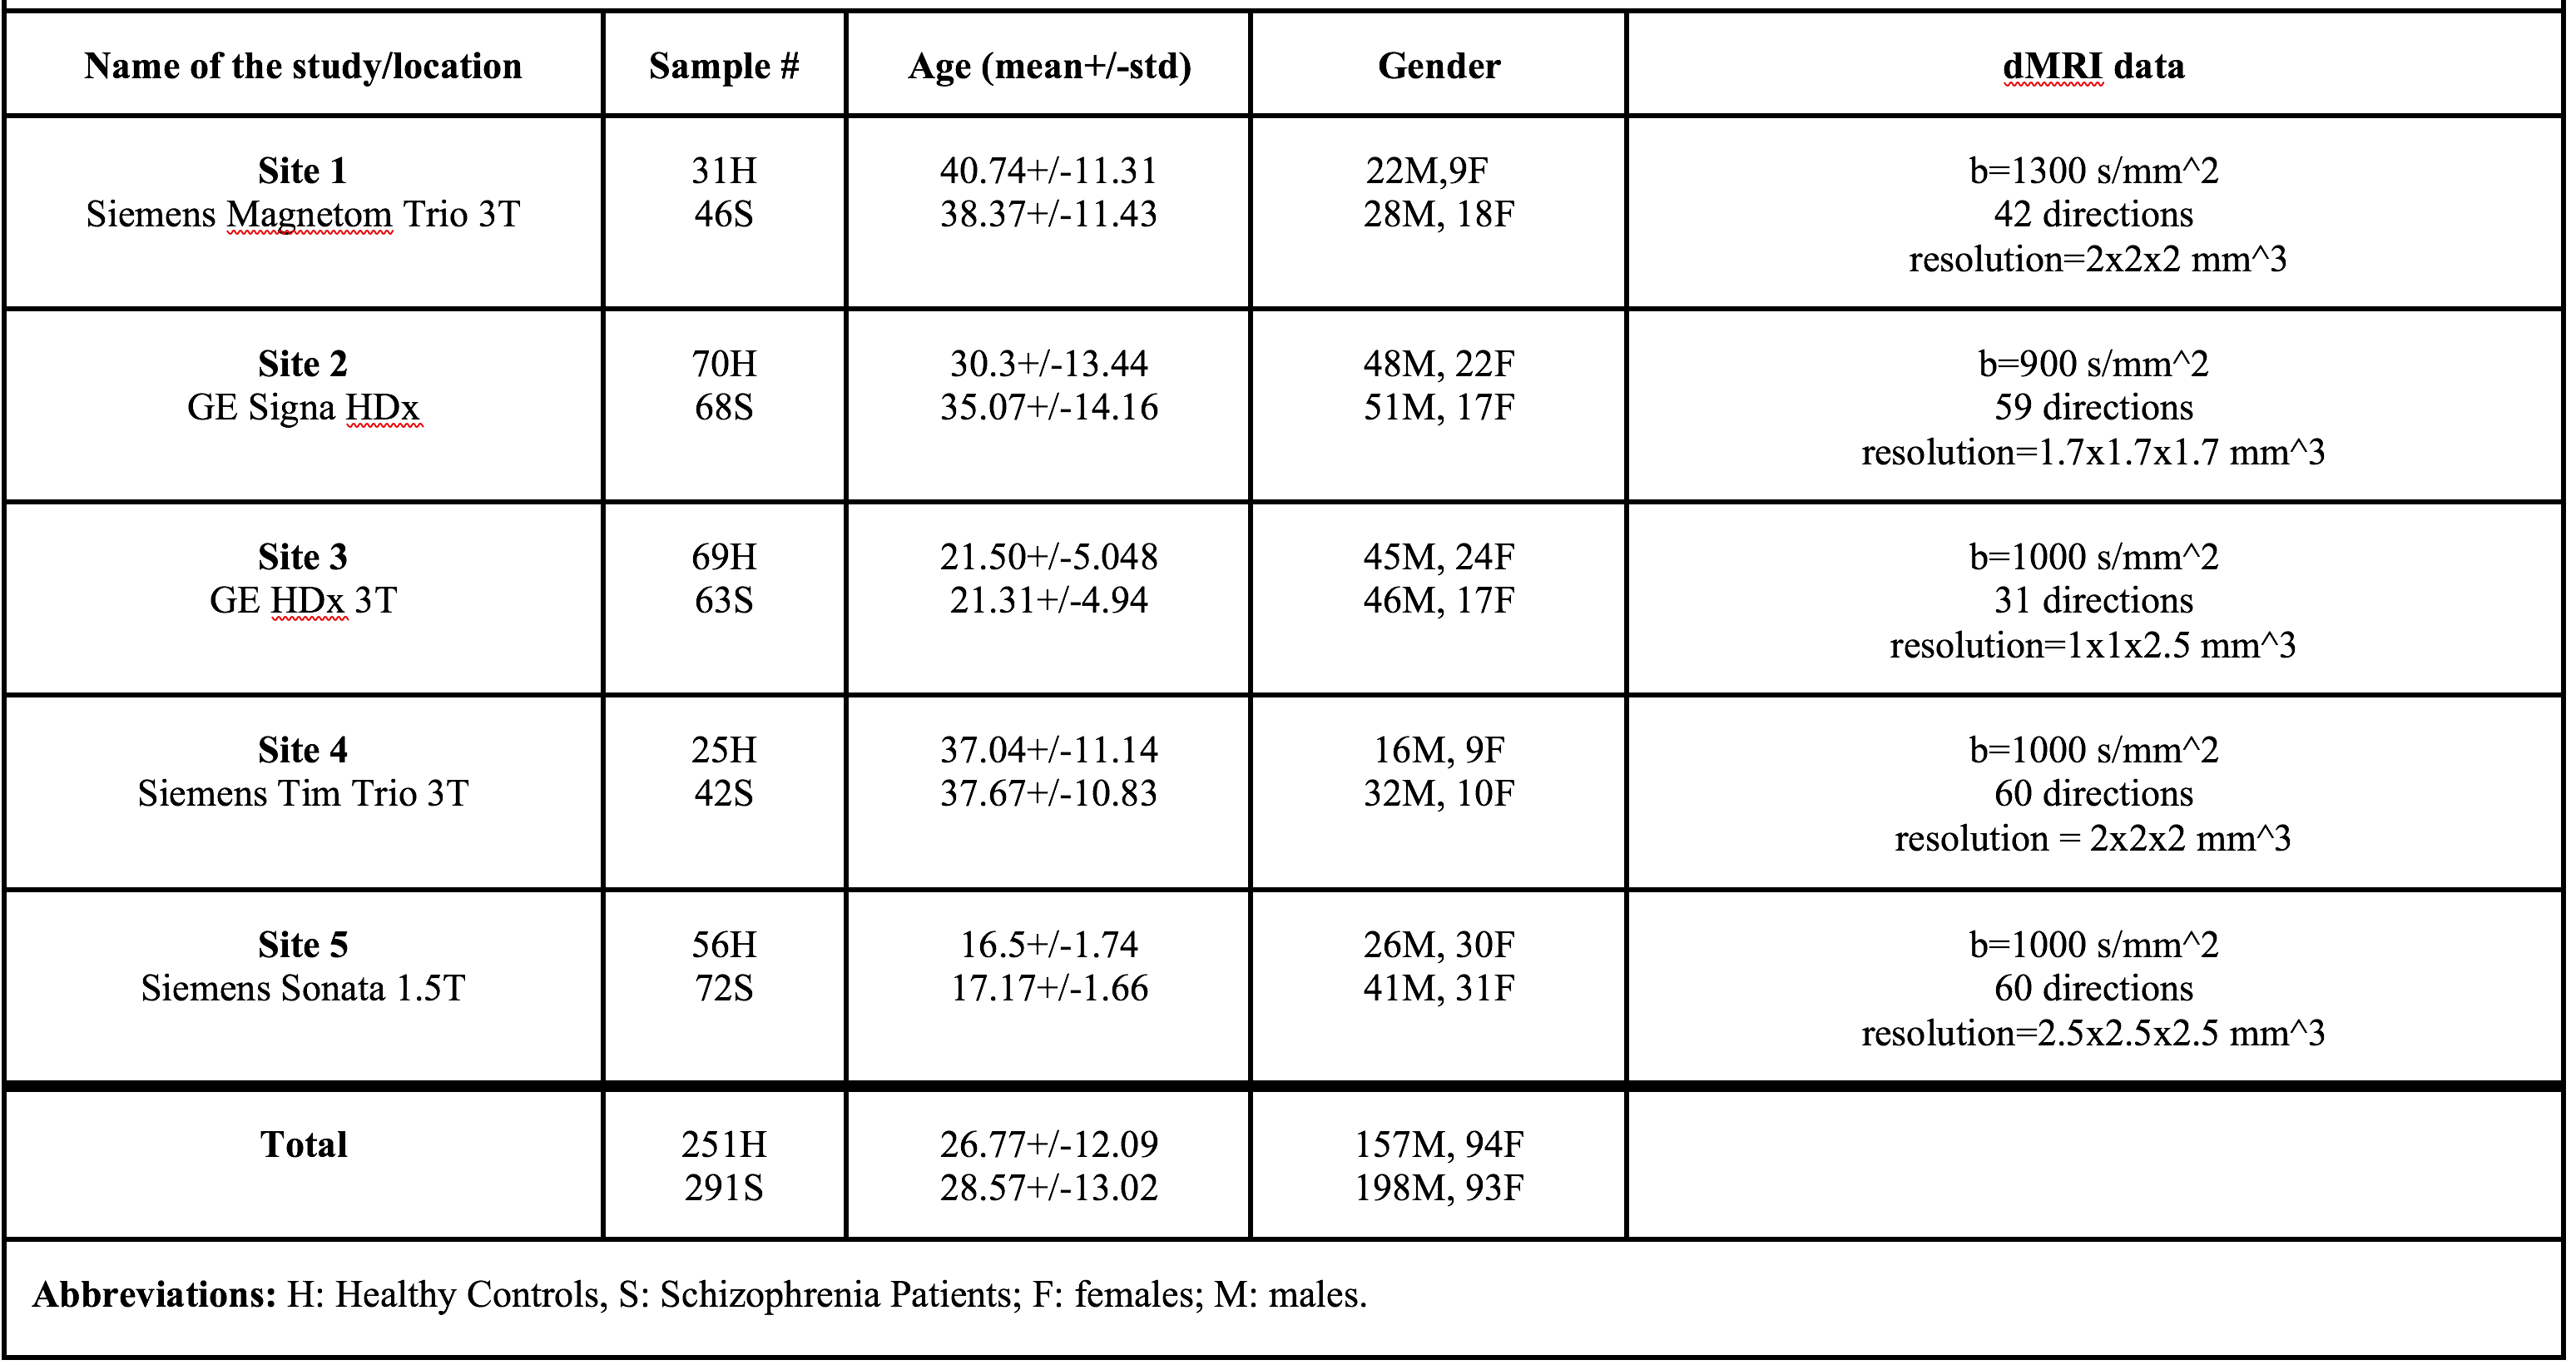
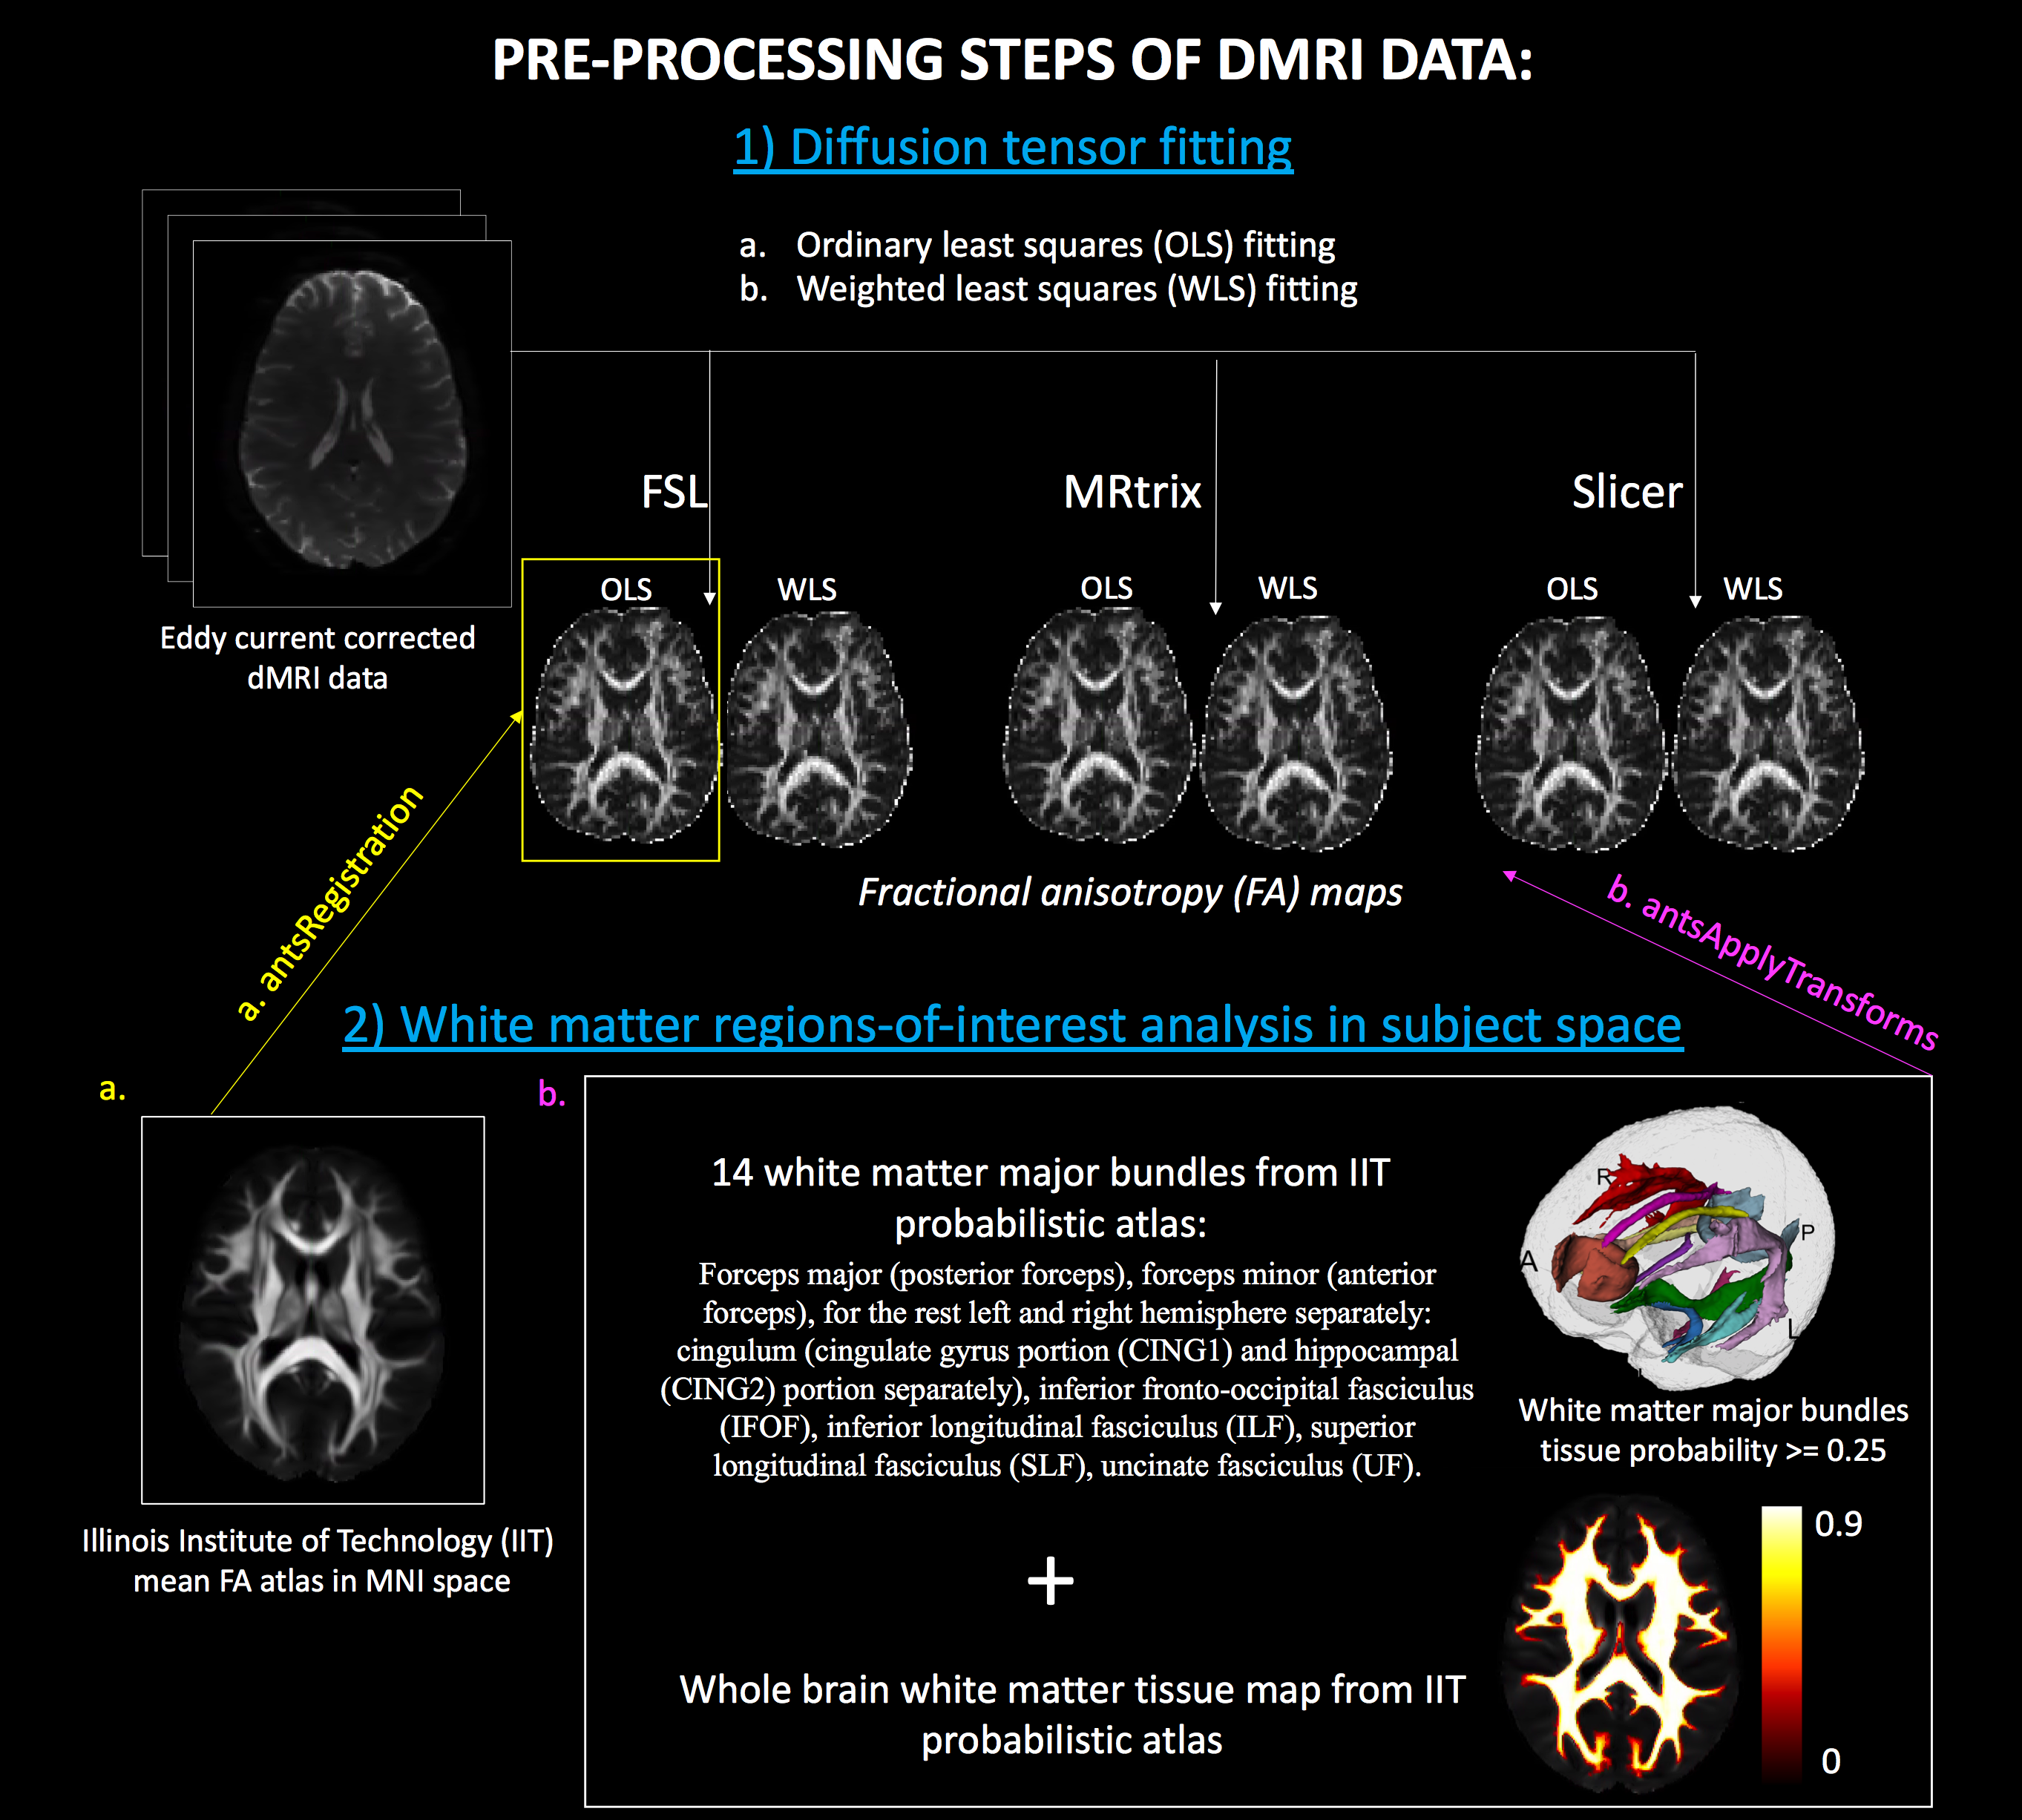
This study included dMRI data of 542 subjects including 291 schizophrenia patients and 251 healthy controls, recruited from 5 sites. Refer to Figure 1 for the details of the demographics and acquisition parameters. A standardized processing procedure (axis alignment, motion and eddy-current correction) was carried out using https://github.com/pnlbwh/pnlutil for all subjects. Brain masking was performed with BET8. Next, we computed FA in all subjects using three software (FSL9 , MRtrix10 and Slicer11) with OLS and WLS fitting. To compare software effects on whole brain WM and major bundles, Illinois-Institute-of-Technology (IIT) FA atlas in MNI space10,12 was registered to the FA maps in subject space13. We warped the IIT probabilistic atlas of the whole brain WM and 14 major bundles to the subject space. The probabilistic threshold was set to 0.25 to extract clearly defined regions-of-interest (ROI) and whole brain maps (refer to Figure 2 for the preprocessing steps). We computed mean FA in each ROI and whole brain WM. Analysis-of-variance (anova) was used to assess the statistical differences between the three software packages. Tukey’s-test was run to adjust the p-values for multiple comparisons. Finally, and most importantly, the effect-sizes (Cohen’s d) of FA differences between patients and controls were computed for each software separately (and for each site) to assess whether the inter-group differences, were preserved across software.Results
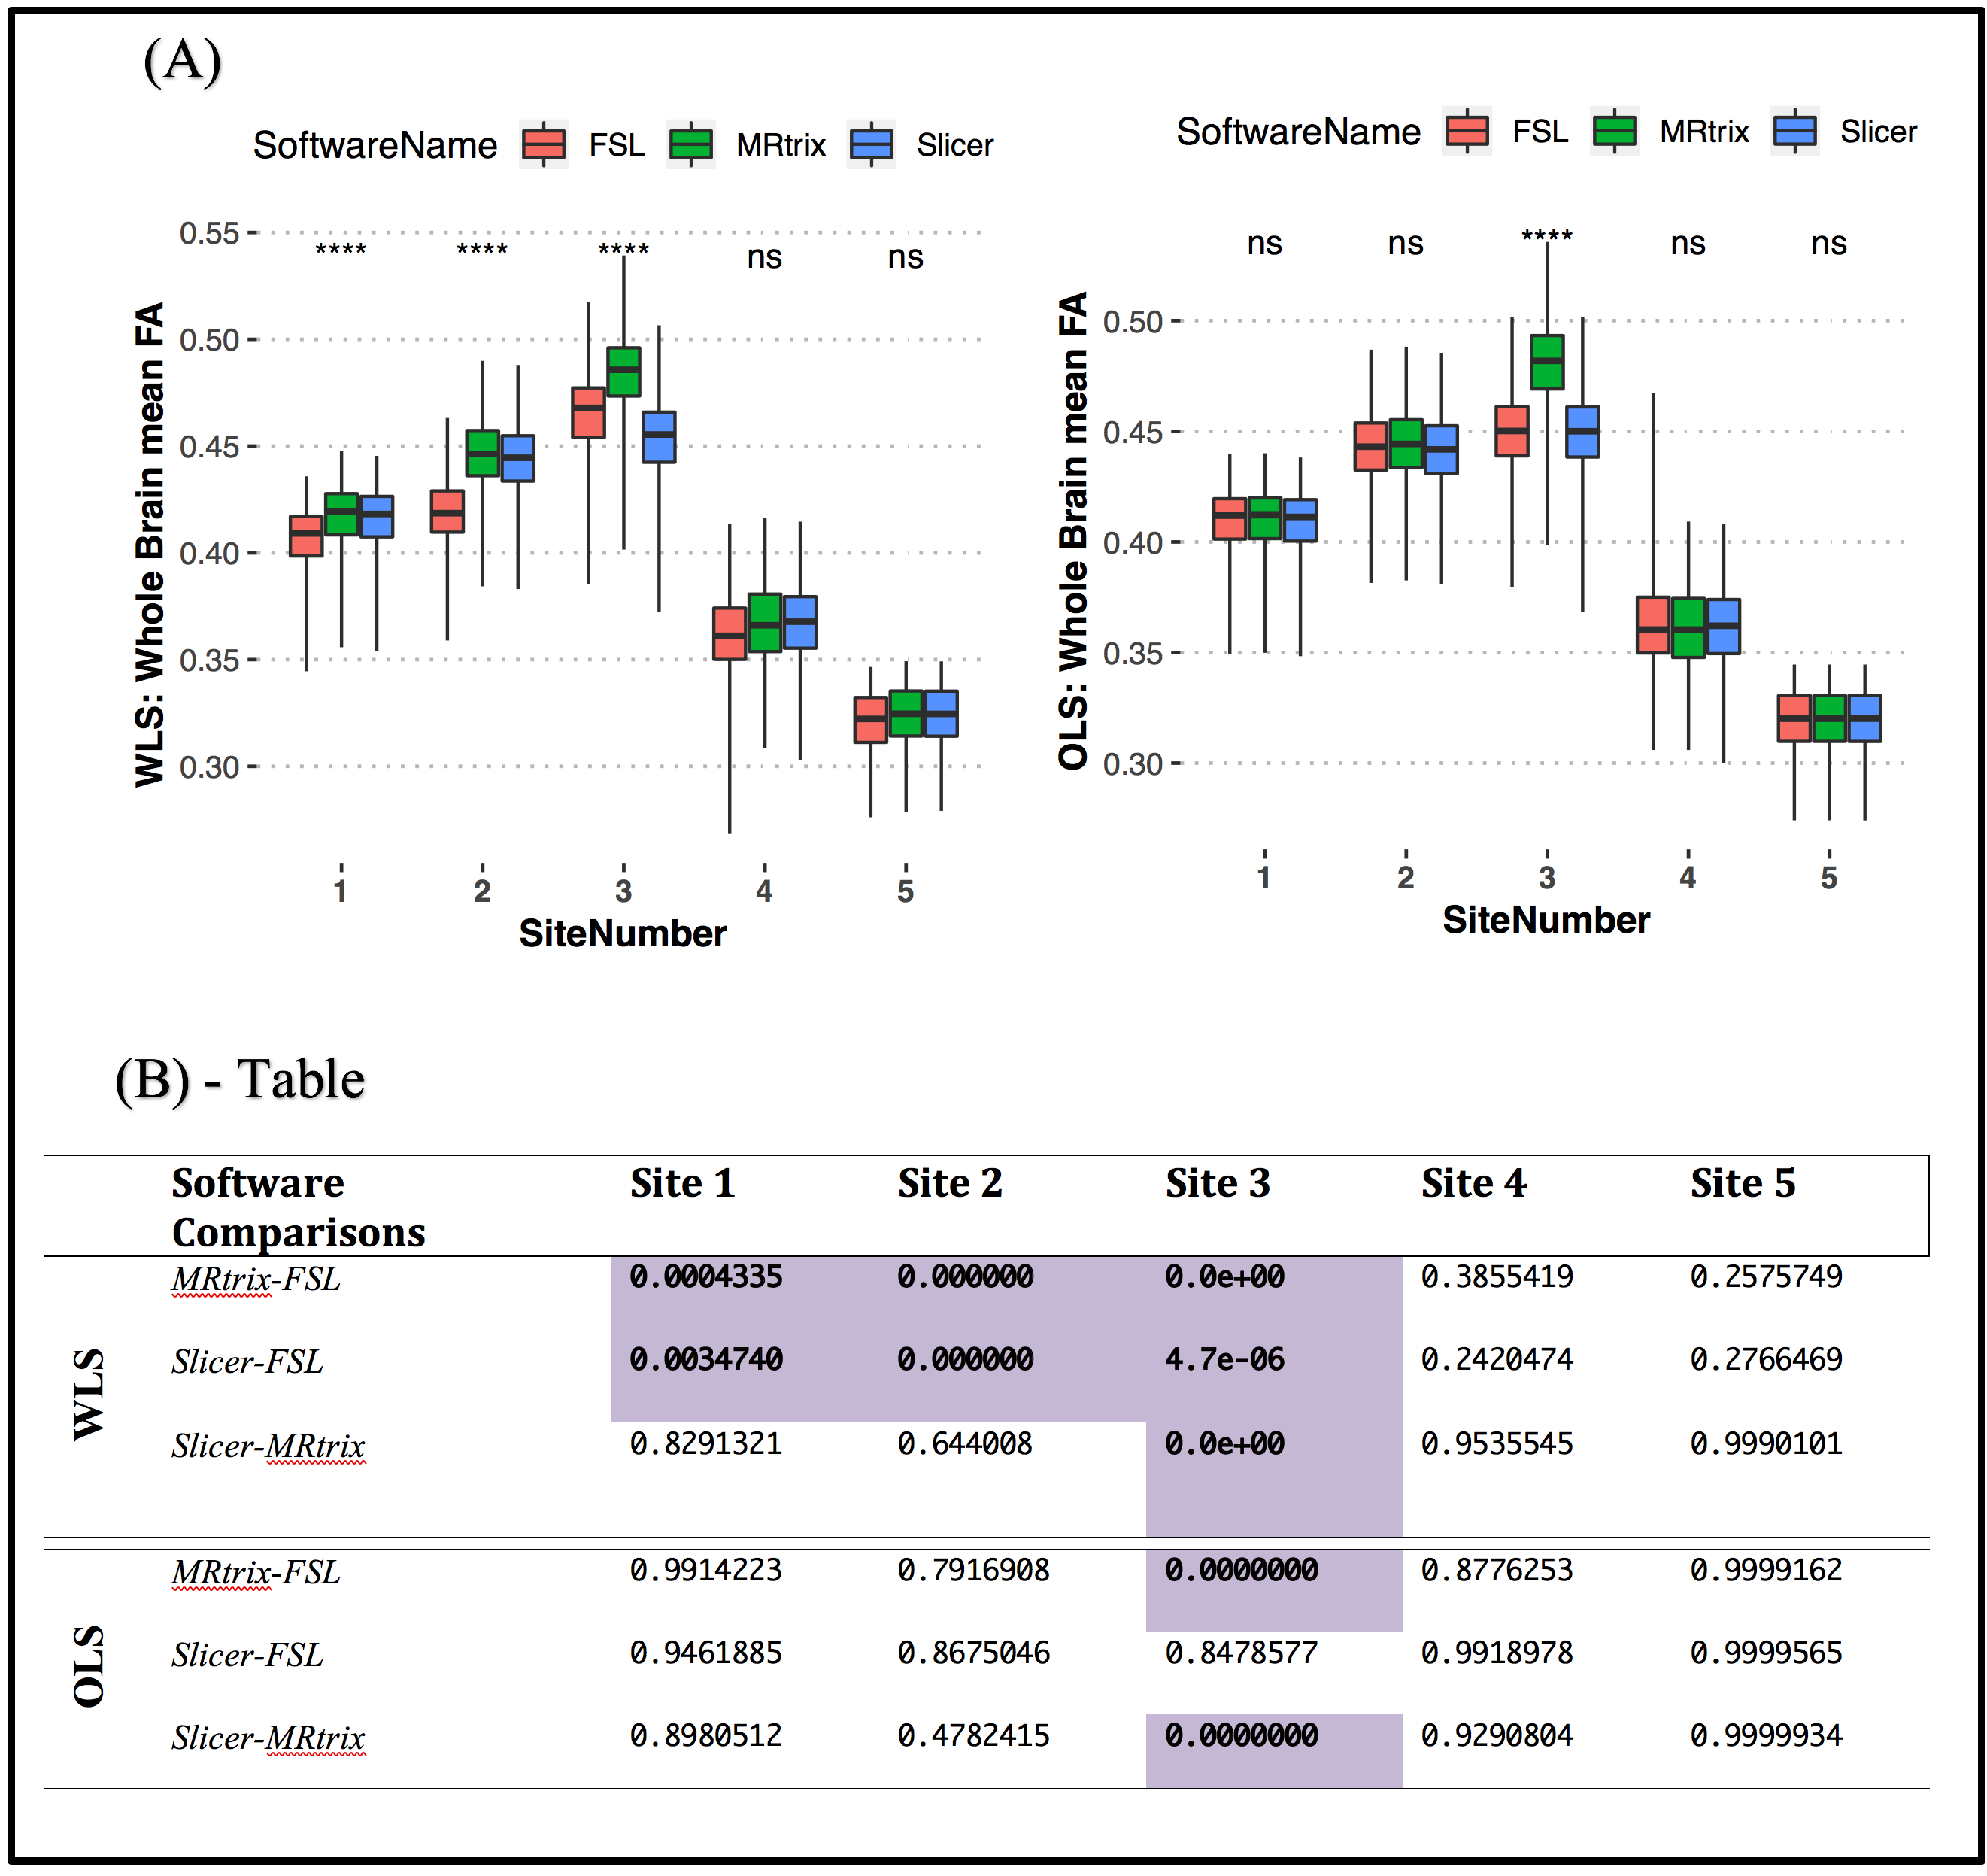
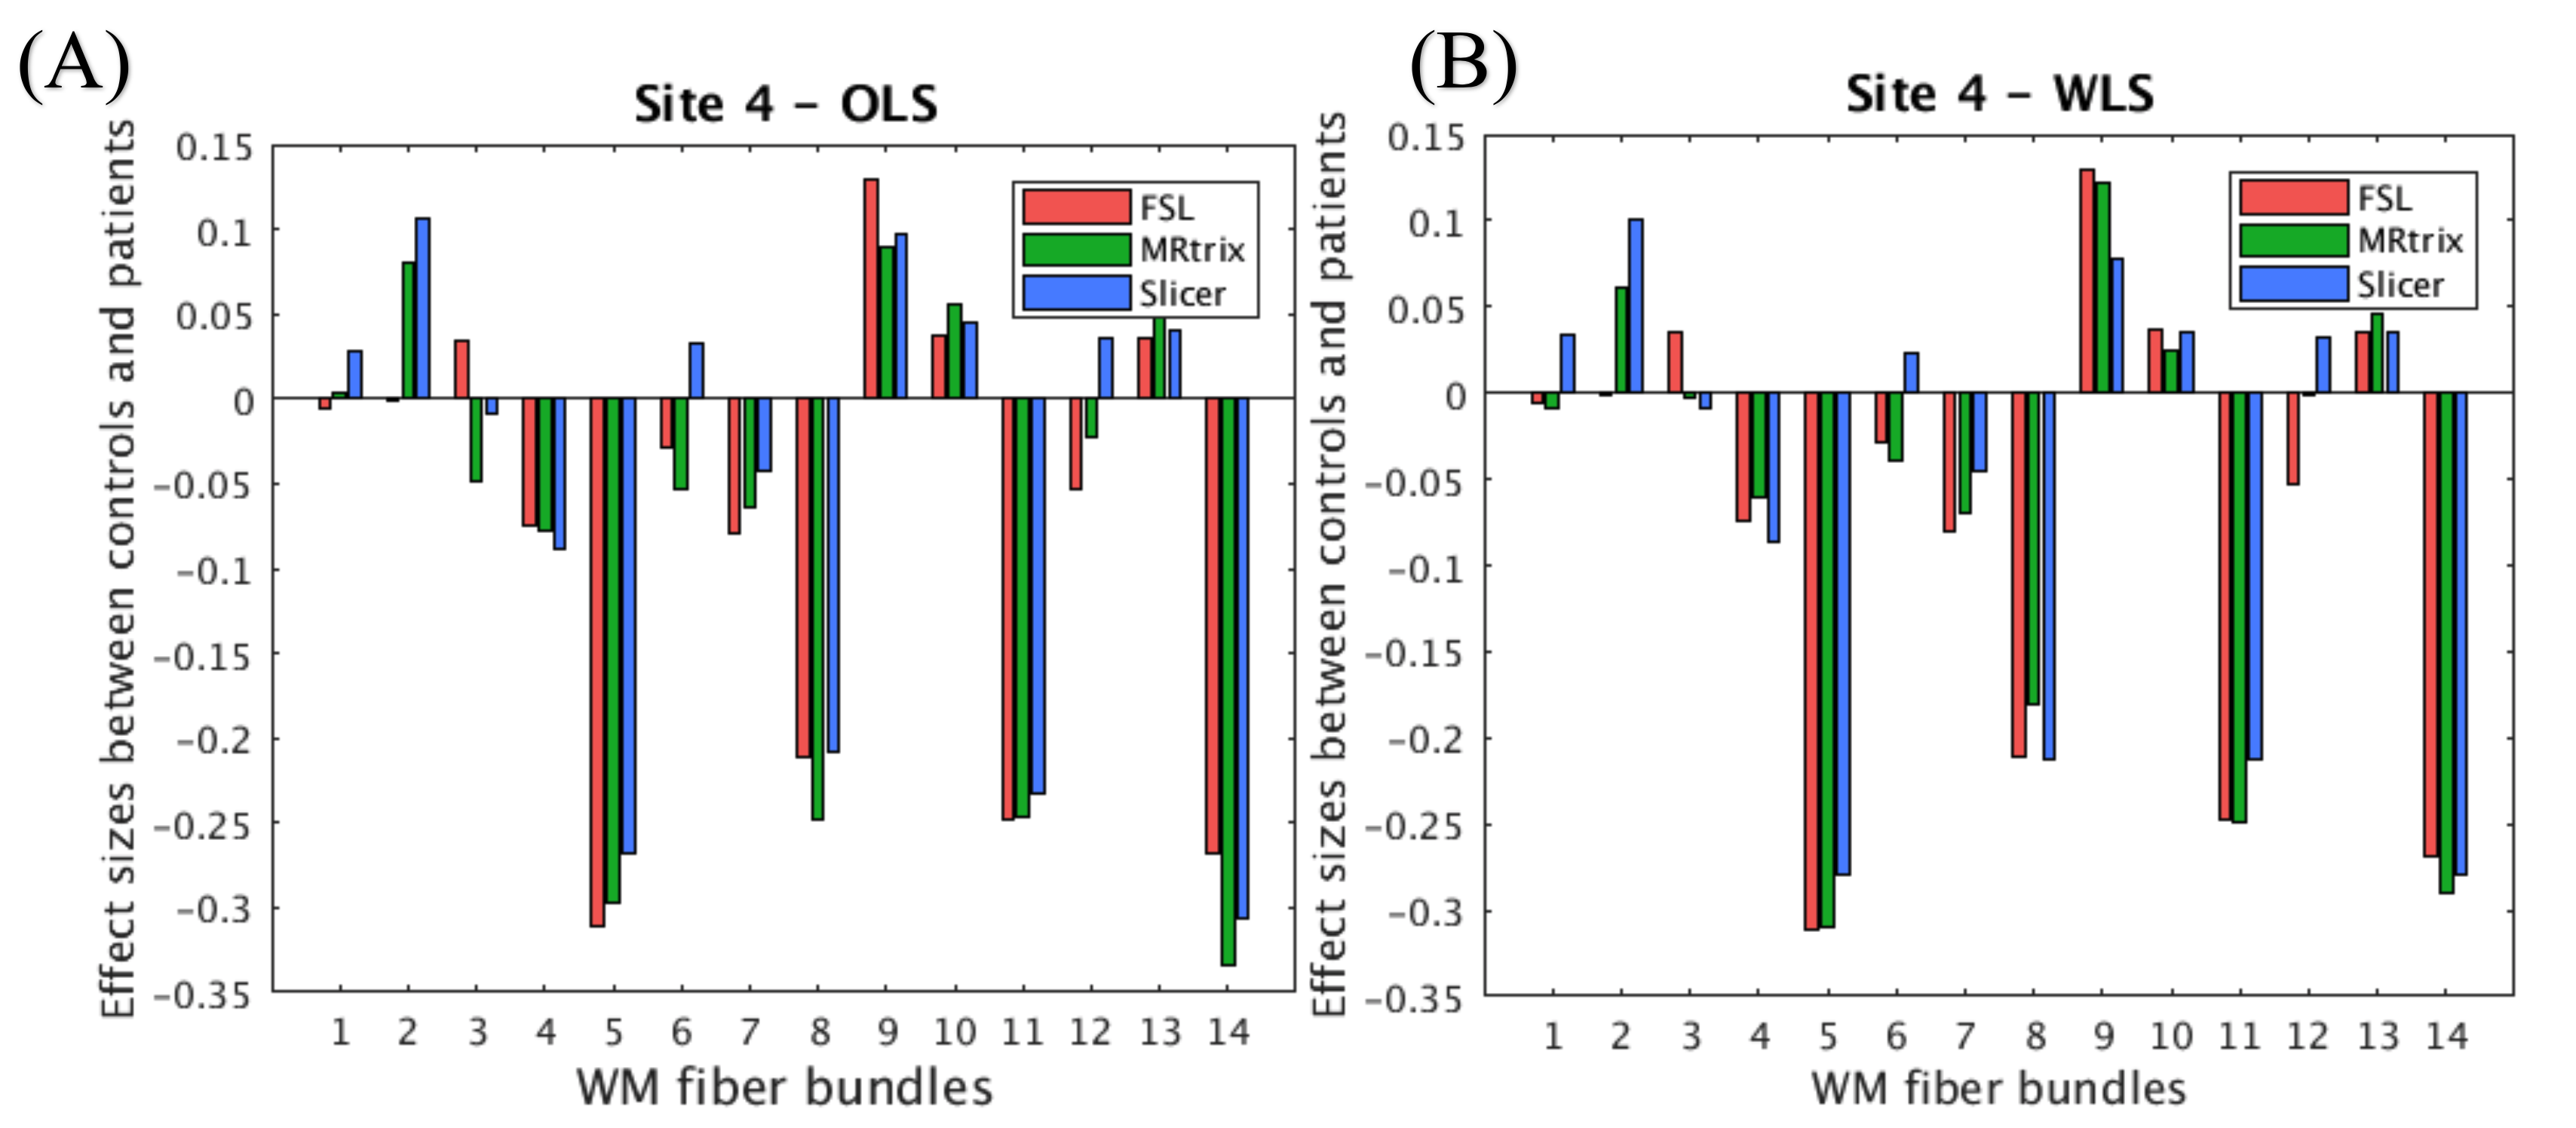
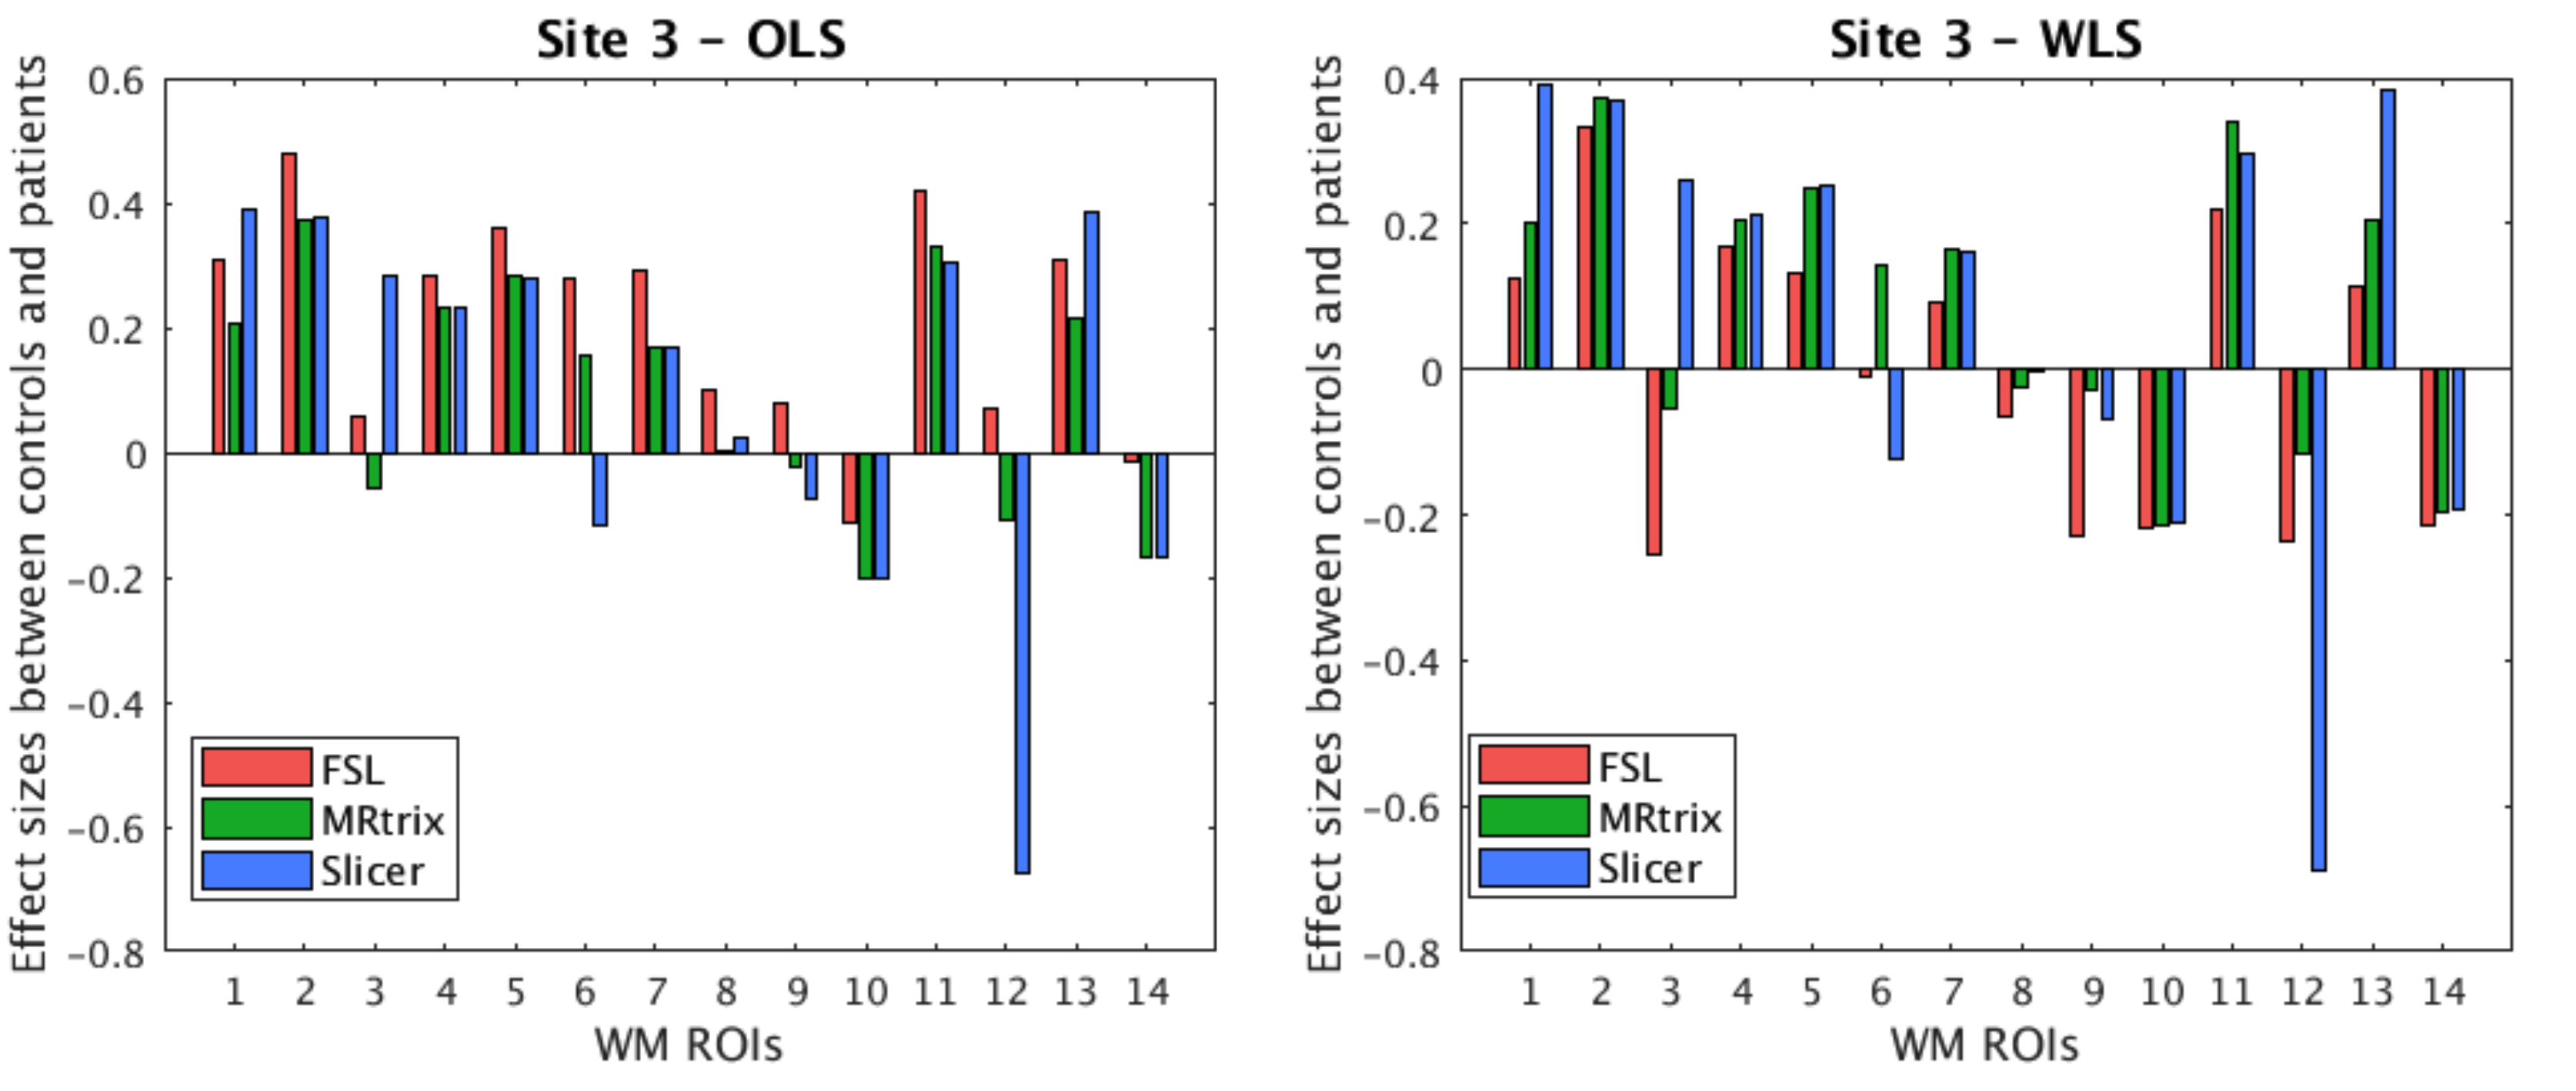
We first compared the FA computed using different software but same diffusion tensor fitting method (OLS or WLS). For WLS, the differences across any two software were observed to be significant at three sites. On the other hand, for OLS, only site 3 showed significant difference in FA between MRtrix and the other two software (refer to Figure 3 for WLS and OLS software comparison plots and statistics). Additionally, to assess whether the inter-group variability and effect-sizes were preserved across software, we computed effect-sizes of the FA differences between controls and patients at each site. Figure 4 depicts the effect-sizes of 14 WM ROIs for each software, as well as WLS and OLS at site 4. Software effects and changes in the direction can be still observed on the effect-sizes, although the absolute differences between effect-sizes of each software were not strong at site 4 for both WLS and OLS. We observe that particularly at site 3 (Figure 5), effect-sizes across software were dramatically different for both OLS and WLS. In addition, we point out the ROIs where the effect-sizes changed direction. These results demonstrate that statistical group differences were not necessarily preserved across software whether you use OLS or WLS.Discussion and Conclusion
This study highlighted and quantified the differences between diffusion tensor fits estimated by three different software packages at 5 sites. Group differences in FA were calculated at each site (between controls and patients with schizophrenia) and using each of the three software (FSL, MRtrix, Slicer). We would like to note that all dMRI data were preprocessed using the same preprocessing pipeline (axis aligned, motion and eddy current corrected), and only estimation of the diffusion tensor and computation of FA differed in later stages of the processing. We observed significant software effects in estimation of FA leading to wide variation in effect-sizes between groups for both OLS and WLS methods. This might be due to differences in implementations, which induces biases in group effects. We note that this work is preliminary and extensive analyses will be done to understand the sources of the discrepancies (i.e., signal noise, negative values, etc). This work highlights one of the sources for the lack of reproducibility seen in dMRI studies. Finally, we also caution against using different software packages in any multi-site neuroimaging study especially those that use statistical data pooling methods (e.g. meta/mega analysis approaches) to increase the statistical power of neuroimaging studies.Acknowledgements
The authors would like to acknowledge these grants: NIH R01 MH119222 (Rathi), NIH R01 MH102377 (Kubicki)References
1. Brun, L., Pron, A., Sein, J., Deruelle, C. & Coulon, O. Diffusion MRI: Assessment of the Impact of Acquisition and Preprocessing Methods Using the BrainVISA-Diffuse Toolbox. Front. Neurosci. 13, 536 (2019).
2. Lopera, A. F. L., Cardona, H. D. V., Daza-Santacoloma, G., Alvarez, M. A. & Orozco, A. A. Comparison of preprocessing methods for diffusion tensor estimation in brain imaging. 2014 XIX Symposium on Image, Signal Processing and Artificial Vision (2014). doi:10.1109/stsiva.2014.7010183
3. Irfanoglu, M. O., Okan Irfanoglu, M., Sarlls, J., Nayak, A. & Pierpaoli, C. Evaluating corrections for Eddy‐currents and other EPI distortions in diffusion MRI: methodology and a dataset for benchmarking. Magnetic Resonance in Medicine 81, 2774–2787 (2019).
4. Stoddart, C. Is there a reproducibility crisis in science? Nature (2016). doi:10.1038/d41586-019-00067-3
5. Turner, B. O., Paul, E. J., Miller, M. B. & Barbey, A. K. Small sample sizes reduce the replicability of task-based fMRI studies. Communications Biology 1, (2018).
6. Melonakos, E. D. et al. Voxel-based morphometry (VBM) studies in schizophrenia—can white matter changes be reliably detected with VBM? Psychiatry Research: Neuroimaging 193, 65–70 (2011).
7. Thompson, P. M. et al. The ENIGMA Consortium: large-scale collaborative analyses of neuroimaging and genetic data. Brain Imaging Behav. 8, 153–182 (2014).
8. Smith, S. M. Fast robust automated brain extraction. Hum. Brain Mapp. 17, 143–155 (2002).
9. Behrens, T. E. J. et al. Characterization and propagation of uncertainty in diffusion-weighted MR imaging. Magn. Reson. Med. 50, 1077–1088 (2003).
10. Veraart, J., Sijbers, J., Sunaert, S., Leemans, A. & Jeurissen, B. Weighted linear least squares estimation of diffusion MRI parameters: strengths, limitations, and pitfalls. Neuroimage 81, 335–346 (2013).
11. Norton, I. et al. SlicerDMRI: Open Source Diffusion MRI Software for Brain Cancer Research. Cancer Res. 77, e101–e103 (2017).
12. Varentsova, A., Zhang, S. & Arfanakis, K. Development of a high angular resolution diffusion imaging human brain template. Neuroimage 91, 177–186 (2014). 13. Avants, B. B. et al. A reproducible evaluation of ANTs similarity metric performance in brain image registration. Neuroimage 54, 2033–2044 (2011).
Figures