4379
Exploring the reliability of ComBat for multi-site diffusion MRI harmonization1Harvard Medical School, Boston, MA, United States, 2Brigham and Women's Hospital, Boston, MA, United States
Synopsis
This study thoroughly explores the reliability of a statistical multi-site diffusion-MRI harmonization method, ComBat, using a large diffusion-MRI dataset involving 5 sites. Additionally, we demonstrate the effects of using different software packages to estimate the diffusion tensor on the harmonization performance of ComBat. Even when the processing steps (and software) were identical for all sites, ComBat altered the inter-group variability at each site and in some regions flipped the direction of effect-sizes. Finally, when different software packages were used to estimate the diffusion tensor at different sites, ComBat introduced much drastic effects, thereby reducing the reliability of the results.
Introduction
Large collaborative efforts have led to Big-Data initiatives1,2, aimed at improving the poor reproducibility of small neuroimaging studies and gaining statistical power to detect subtle changes in neurological disorders. However, scanner induced bias especially in diffusion-MRI (dMRI) signal, limits direct pooling of the multi-site dMRI data. “Harmonization” of multi-site dMRI datasets can dramatically increase the statistical power of neuroimaging studies and enable comparative studies pertaining to several brain disorders3–7. Harmonization methods can be grouped into two: (1) pre-harmonization methods4–6,8: apply the harmonization at the signal level early in the preprocessing pipeline to avoid additional bias downstream in data processing and model fitting9,10; (2) post-harmonization methods1,7: use statistical approaches to pool the diffusion measures (e.g. fractional anisotropy (FA)) after model fitting and data processing. In this study, we look at two important aspects of using ComBat7,11 (a post-harmonization statistical pooling method) for harmonization, which have not been thoroughly explored before: 1) How reliably does ComBat preserve effect-sizes when used for harmonization, and 2) What are the effects of using different software packages to estimate the diffusion tensor on the harmonization performance of ComBat. A successful harmonization algorithm should preserve the inter-subject variability from each site while removing only the scanner-specific effects and be minimally sensitive to changes in the preprocessing steps. This study aims to answer these questions (#1 and #2 above) by harmonizing FA across 5 sites using ComBat.Methods
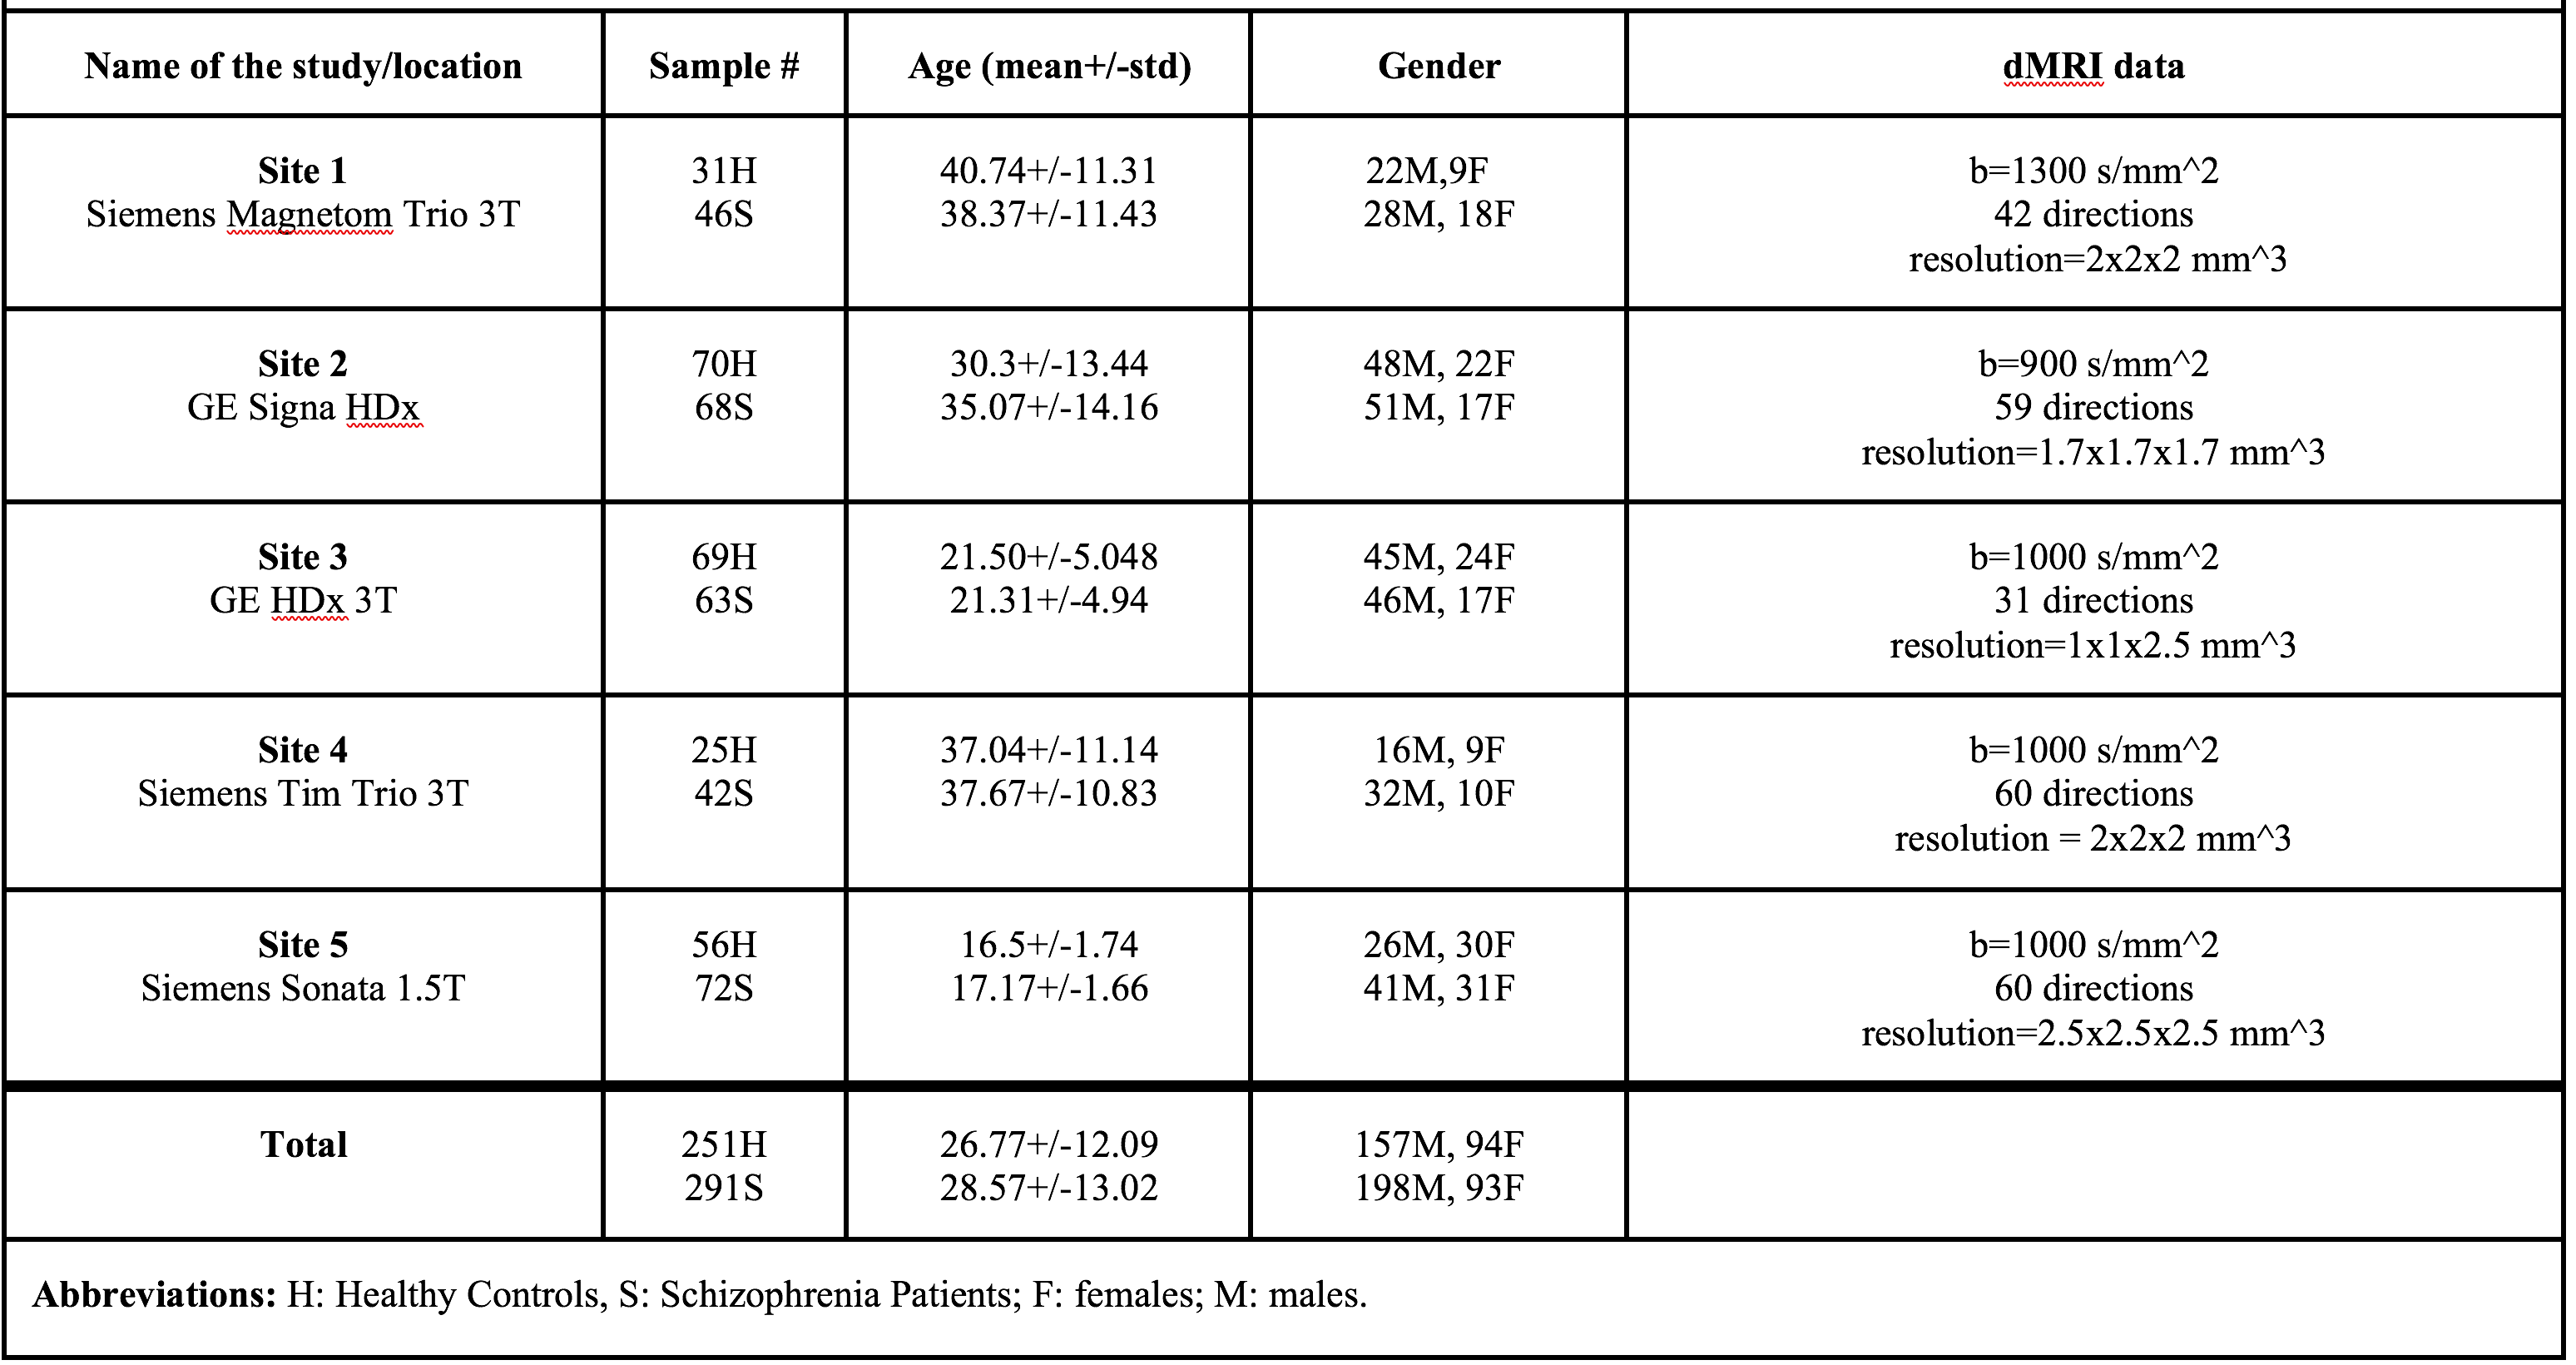
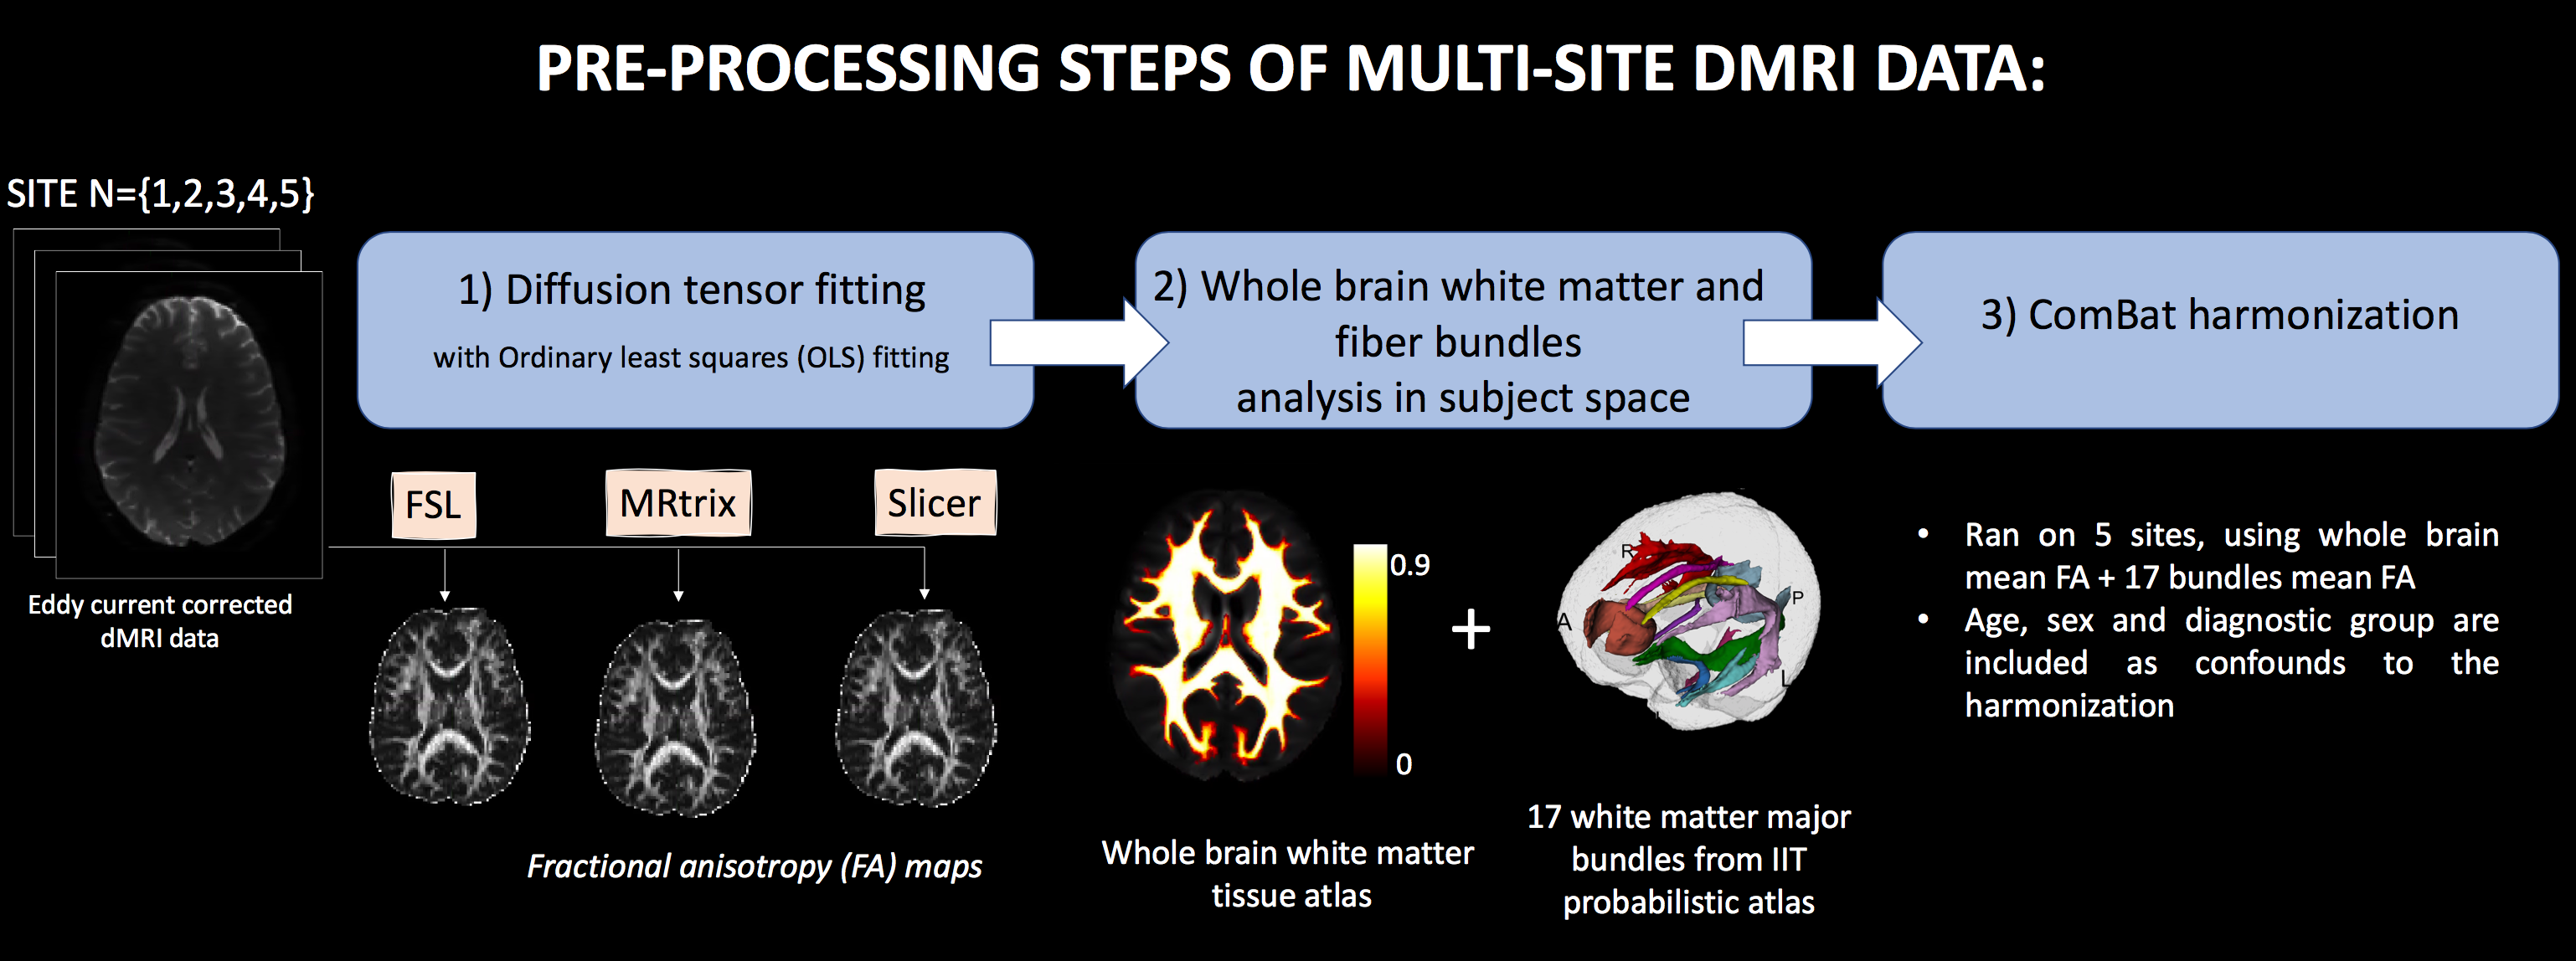
We used dMRI data from 542 subjects including 291 schizophrenia patients and 251 healthy controls, recruited from 5 sites. Refer to Figure 1 for demographics and acquisition parameters. A standardized processing procedure (eddy current and motion correction) was applied to all subjects. Next, we computed FA using three software packages (FSL12, MRtrix13 and Slicer14) with ordinary least squares fitting. To compare the whole brain white matter and major bundles across sites, FA atlas in MNI space13,15 was registered to the FA maps in subject space16. Later, we warped the white matter probabilistic atlas (IIT atlas16) consisting of 17 bundles to the subject space. Mean FA was computed in bundles and whole brain maps, and used as input to ComBat harmonization method (refer to Figure 2 for an overview of the preprocessing steps). Finally, effect-sizes for FA differences, Cohen’s d, was computed between all patients and controls, as well as separately between healthy females and males to assess group differences. The effect-sizes were computed before and after ComBat harmonization at each site for comparative analysis.Results
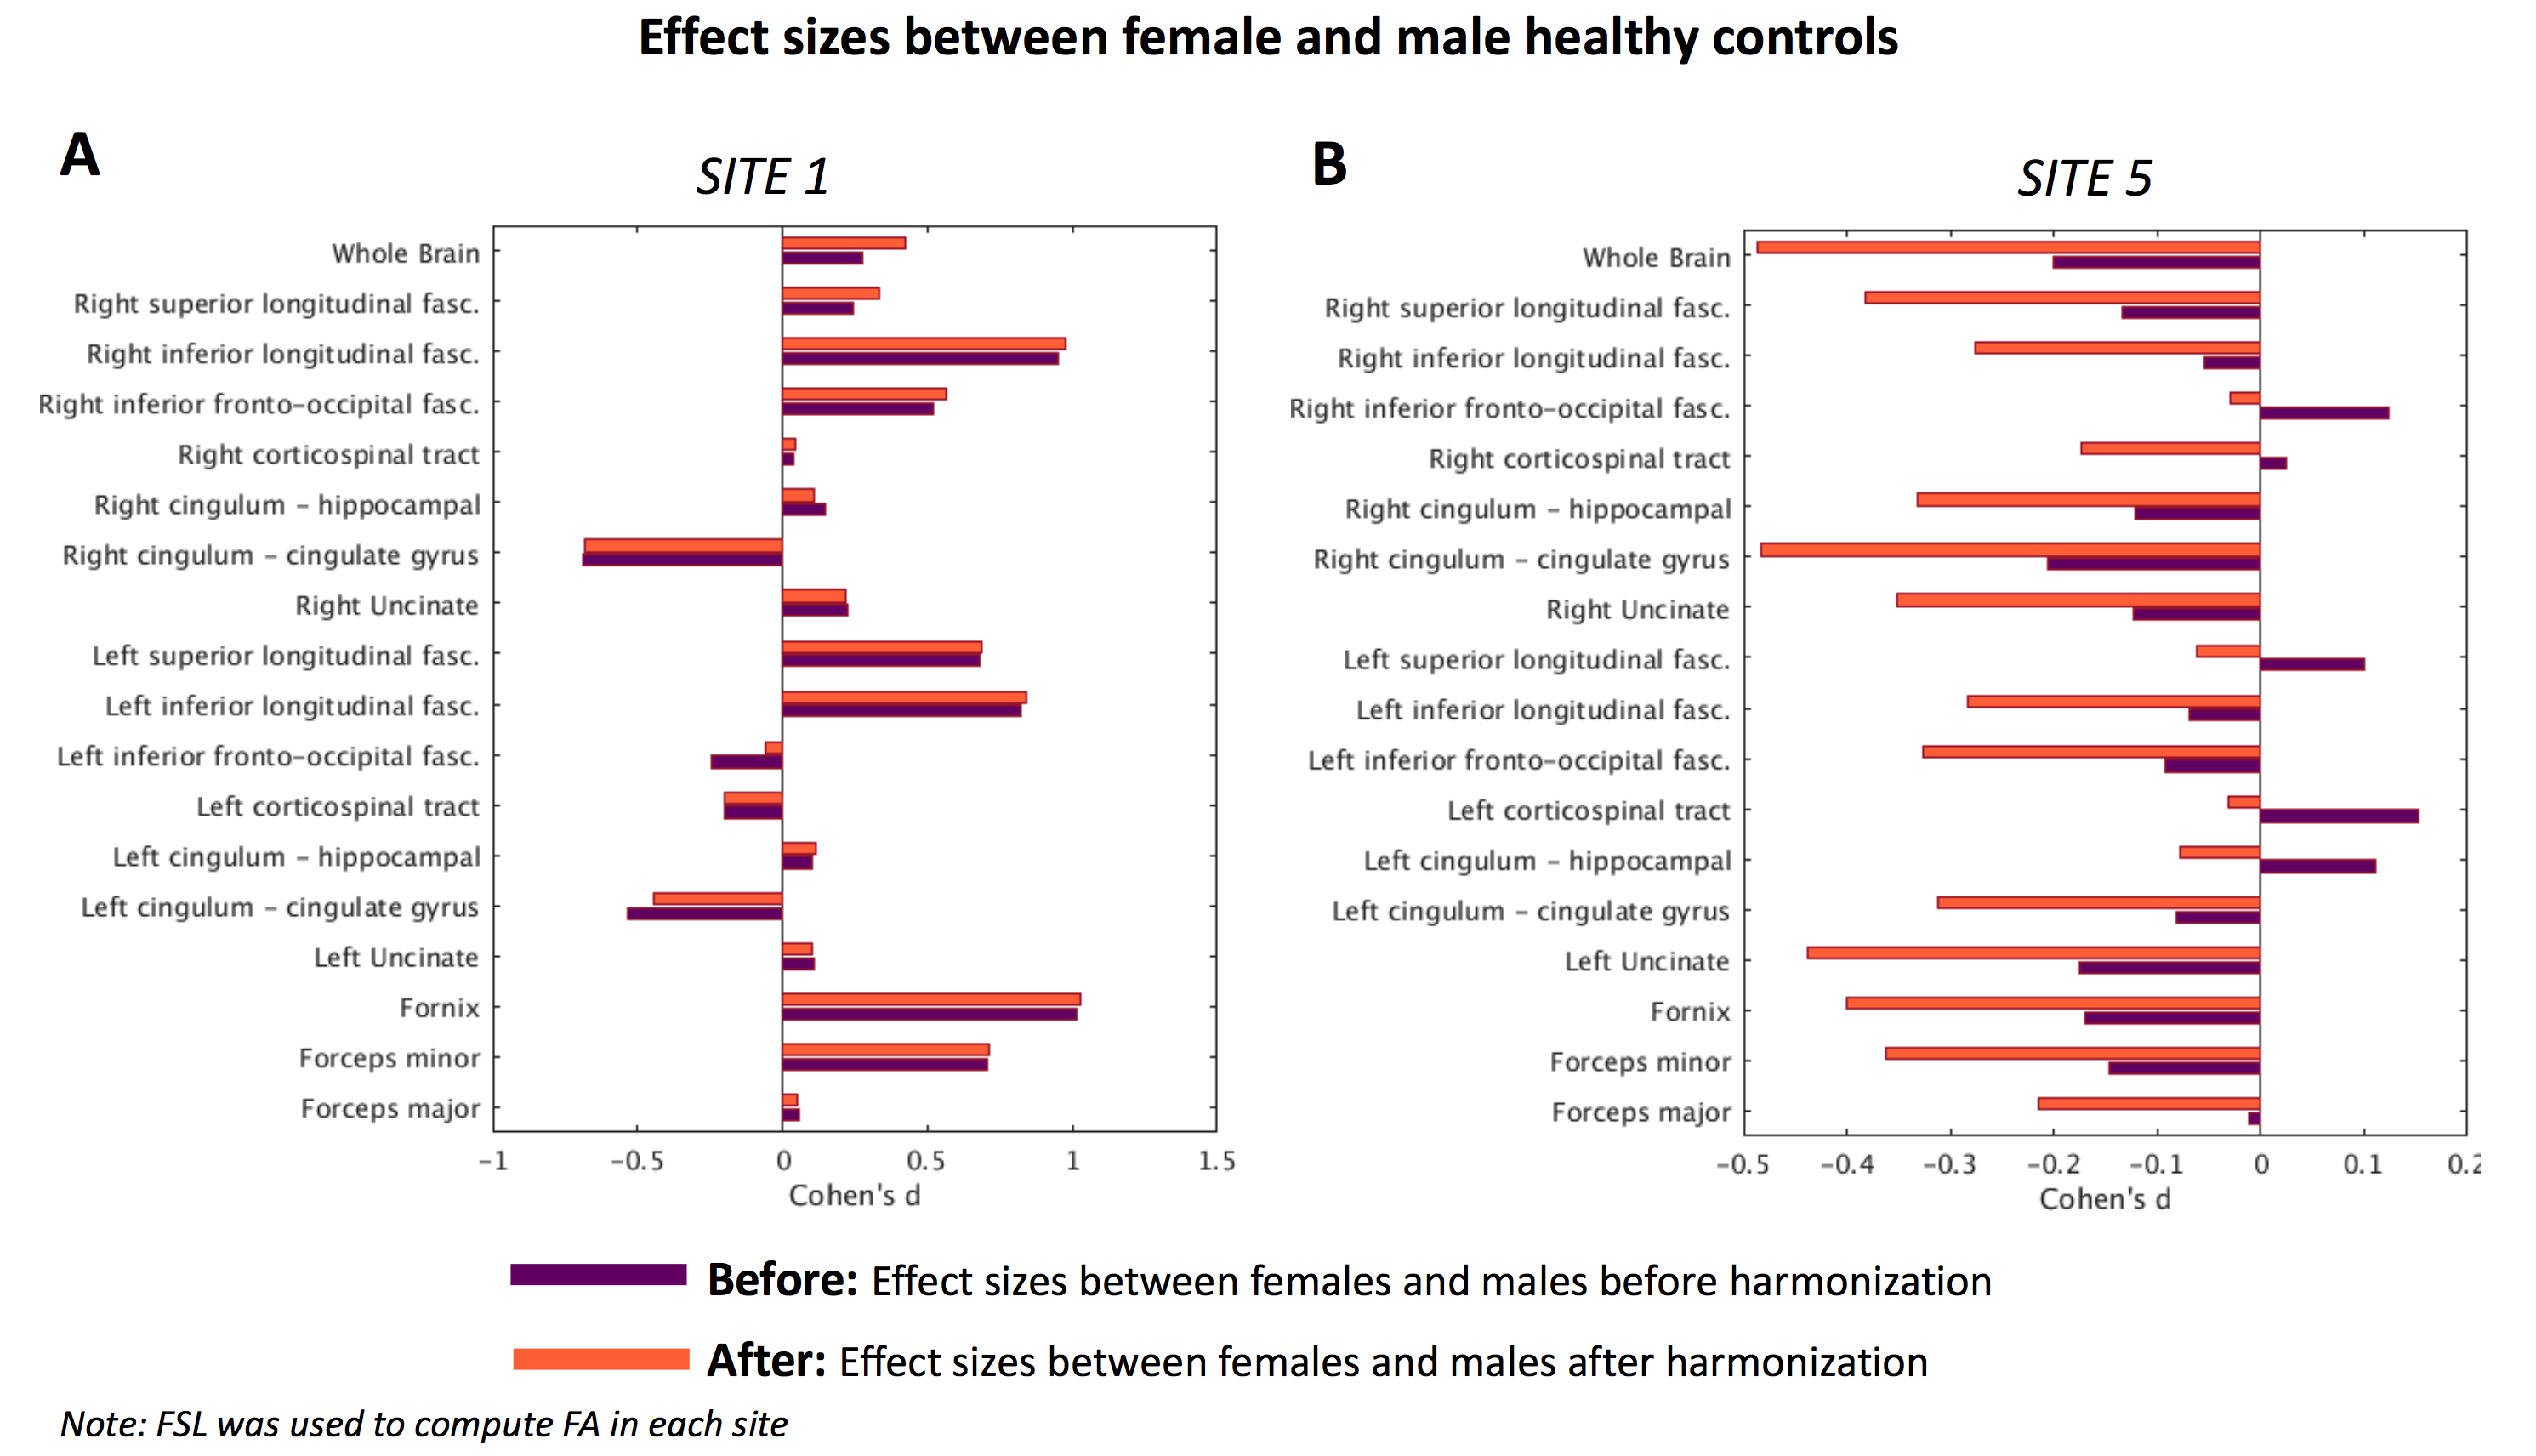
We conducted two experiments to assess whether the inter-group variability (biological differences measured by FA, between (i) female and male healthy controls, and (ii) controls and schizophrenia patients) were preserved after harmonization. Of note, effect-sizes before and after harmonization is referred to as “before” and “after” respectively in experiments and figures.(Experiment-1) First, we assessed the effect-sizes after harmonization, where FA was computed using FSL for all sites and given as input to ComBat harmonization algorithm. Figure 3 depicts effect-sizes between healthy females and males at site 1 and site 5, both before and after harmonization with ComBat. In this experiment, data pre-processing was done in a consistent manner with the same software. At site 1, the effect-sizes were almost preserved before and after harmonization (barring a reduction in effect-size for left-inferior-fronto-occipital-fasciculus). However, for site 5, after harmonization, the effect-sizes for almost all fiber bundles are altered. Notably, ComBat seems to have increased the effect-sizes across many fiber bundles. Most importantly, in a few fiber bundles, the sign of the effect-size is flipped, indicating that after harmonization the direction of the differences were reversed, which can dramatically reduce reliability of the results.
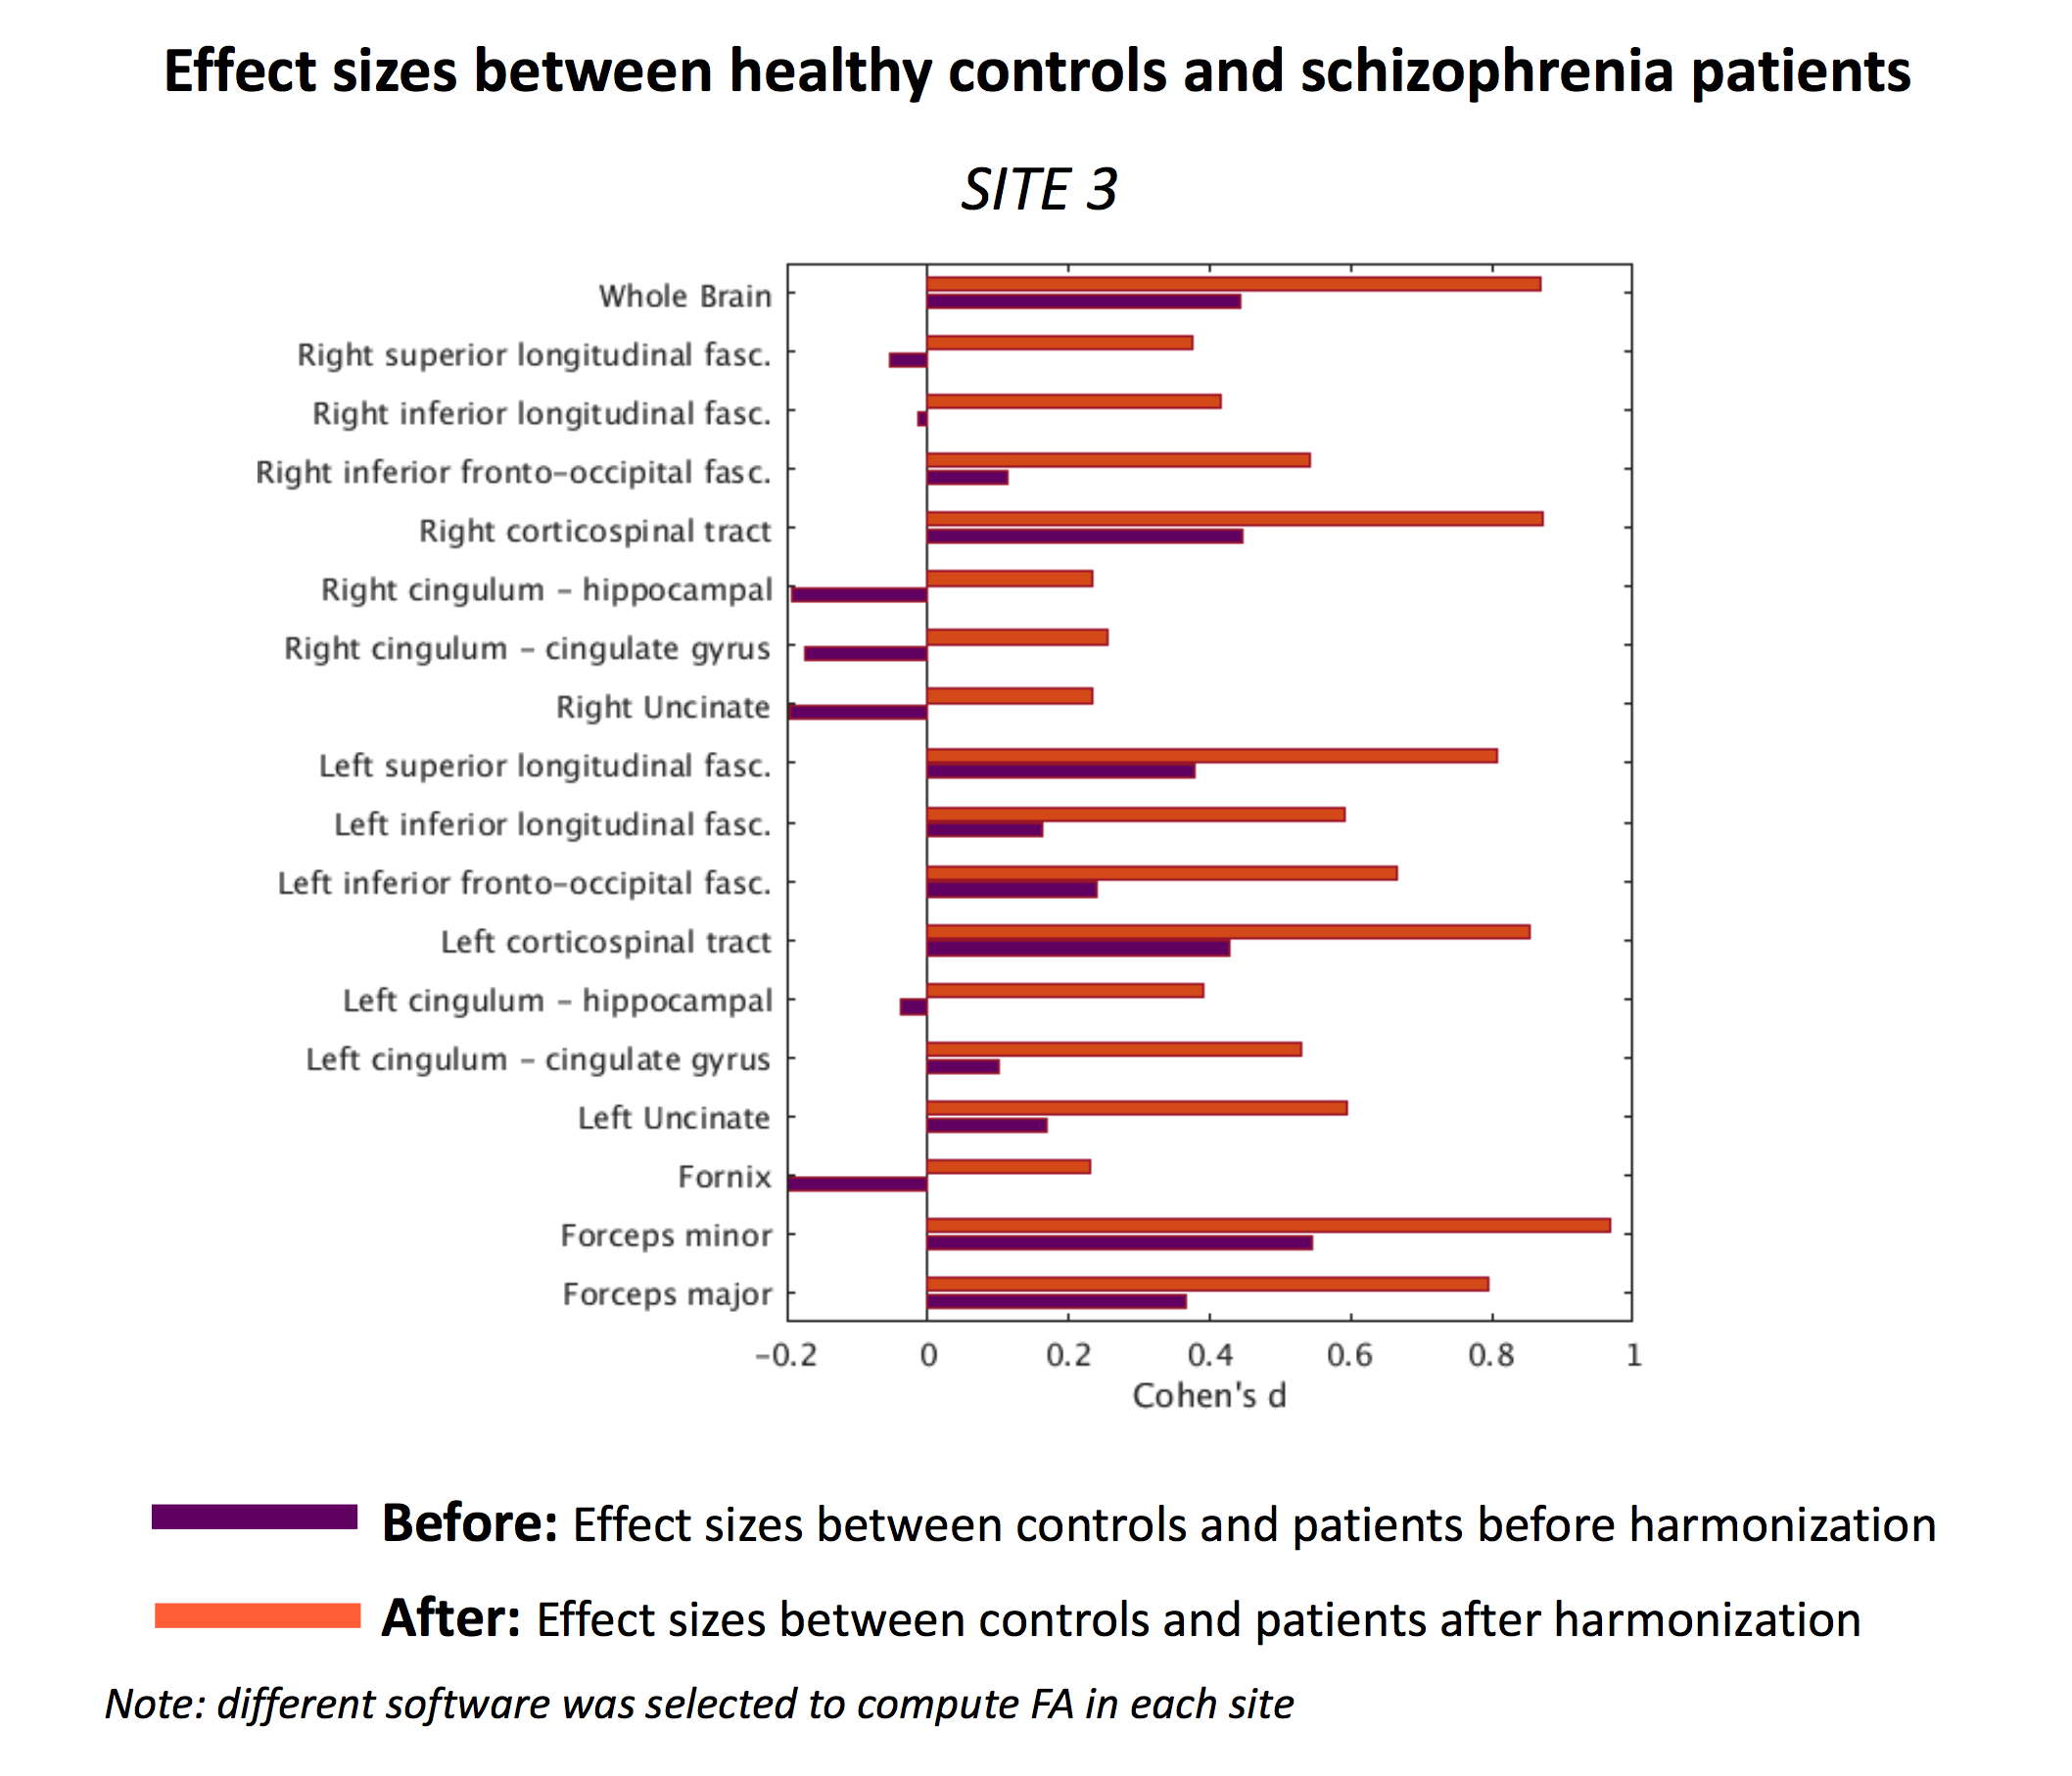
(Experiment-2) Second, to explore how subtle changes in the processing pipeline affects harmonization, each site used different software to compute FA which were given as input to ComBat harmonization algorithm. Figure 4 depicts effect-sizes between controls and patients at site 3, both before and after harmonization with ComBat. When different software was used for each site to compute FA, which were given as input to harmonization, effect-sizes were not preserved after harmonization and the absolute differences between “before” and “after” were up to 0.7. According to Cohen’s d criteria, this difference is considered large. In addition, we point out to the bundles where the effect-sizes changed direction (e.g. right-cingulum-hippocampal). These results demonstrate that inter-group variability was not preserved after harmonization and changes in the preprocessing pipeline induced much larger biases, which were not properly accounted for by ComBat.
Discussion and Conclusion
In this study, using a large dataset of 542 subjects from 5 sites, we evaluated the reliability and sensitivity of ComBat in harmonizing multi-site dMRI data. Even when the processing steps (and software) were identical for all sites, ComBat harmonization seems to alter the inter-group differences and in some cases flip the direction of effect-sizes. Additionally, when different software packages were used to estimate the diffusion tensor at different sites, the harmonization algorithm introduced much drastic effects in the data, thereby reducing the reliability of the results. We thus suggest caution while using post-harmonization methods like ComBat. Most importantly, we recommend not to combine dMRI measures processed with different software packages.Acknowledgements
The authors would like to thank to these grants: NIH R01 MH119222 (Rathi), NIH R01 MH102377 (Kubicki)References
1. Thompson, P. M. et al. The ENIGMA Consortium: large-scale collaborative analyses of neuroimaging and genetic data. Brain Imaging Behav. 8, 153–182 (2014).
2. Cetin-Karayumak, S. et al. White matter abnormalities across the lifespan of schizophrenia: a harmonized multi-site diffusion MRI study. Mol. Psychiatry (2019). doi:10.1038/s41380-019-0509-y
3. Tax, C. M. W. et al. Cross-scanner and cross-protocol diffusion MRI data harmonisation: A benchmark database and evaluation of algorithms. NeuroImage 195, 285–299 (2019).
4. Karayumak, S. C. et al. Retrospective harmonization of multi-site diffusion MRI data acquired with different acquisition parameters. NeuroImage 184, 180–200 (2019).
5. Karayumak, S. C., Kubicki, M. & Rathi, Y. Harmonizing Diffusion MRI Data Across Magnetic Field Strengths. Medical Image Computing and Computer Assisted Intervention – MICCAI 2018 116–124 (2018). doi:10.1007/978-3-030-00931-1_14
6. Mirzaalian, H. et al. Harmonizing Diffusion MRI Data Across Multiple Sites and Scanners. Lecture Notes in Computer Science 12–19 (2015). doi:10.1007/978-3-319-24553-9_2
7. Fortin, J.-P. et al. Harmonization of multi-site diffusion tensor imaging data. Neuroimage 161, 149–170 (2017).
8. Bonet-Carne, E., Grussu, F., Ning, L., Sepehrband, F. & Tax, C. M. W. Computational Diffusion MRI: International MICCAI Workshop, Granada, Spain, September 2018. (Springer, 2019).
9. Brun, L., Pron, A., Sein, J., Deruelle, C. & Coulon, O. Diffusion MRI: Assessment of the Impact of Acquisition and Preprocessing Methods Using the BrainVISA-Diffuse Toolbox. Front. Neurosci. 13, 536 (2019).
10. Irfanoglu, M. O., Okan Irfanoglu, M., Sarlls, J., Nayak, A. & Pierpaoli, C. Evaluating corrections for Eddy‐currents and other EPI distortions in diffusion MRI: methodology and a dataset for benchmarking. Magnetic Resonance in Medicine 81, 2774–2787 (2019).
11. Johnson, W. E., Li, C. & Rabinovic, A. Adjusting batch effects in microarray expression data using empirical Bayes methods. Biostatistics 8, 118–127 (2007).
12. Behrens, T. E. J. et al. Characterization and propagation of uncertainty in diffusion-weighted MR imaging. Magn. Reson. Med. 50, 1077–1088 (2003).
13. Veraart, J., Sijbers, J., Sunaert, S., Leemans, A. & Jeurissen, B. Weighted linear least squares estimation of diffusion MRI parameters: strengths, limitations, and pitfalls. Neuroimage 81, 335–346 (2013).
14. Norton, I. et al. SlicerDMRI: Open Source Diffusion MRI Software for Brain Cancer Research. Cancer Res. 77, e101–e103 (2017).
15. Varentsova, A., Zhang, S. & Arfanakis, K. Development of a high angular resolution diffusion imaging human brain template. Neuroimage 91, 177–186 (2014).
16. Avants, B. B. et al. A reproducible evaluation of ANTs similarity metric performance in brain image registration. Neuroimage 54, 2033–2044 (2011).
Figures