4378
Characterizing intravoxel spatial distribution of diffusion based on texture analysis1Research & Development Group, Hitachi, Ltd., Tokyo, Japan, 2Graduate School of Engineering, Chiba University, Chiba, Japan, 3Healthcare Business Unit, Hitachi, Ltd., Tokyo, Japan
Synopsis
In this study, we proposed a method for characterizing intravoxel spatial distribution of diffusion by using texture analysis with GLCM (gray level cooccurrence matrix) from single-shell diffusion MRI data, which can be acquired in practical scan time. Since the method does not assume a diffusion distribution model, unstable calculation such as fitting process is not required. The method could provide novel diagnostic indices of diffusion MRI without additional acquisition.
Introduction
DWI (diffusion weighted imaging) is a promising method for characterizing microstructural changes or differences in neuropathological features. The most widely used DWI analysis approach is DTI (diffusion tensor imaging), which has proven to be extremely useful for investigating brain development and injury1. However, DTI-derived indices (MD: mean diffusivity, FA: fractional anisotropy, AD: axial diffusivity, RD: radial diffusivity) are not very specific to the tissue microstructure because the rough approximation model cannot extract enough diffusion distribution information. Several approaches that incorporate biophysical models have been proposed in order to better understand tissue microstructures2, 3. However, fitting to more complex diffusion models requires more b-values and high angular resolution diffusion MRI data. As a consequence, these approaches suffer from unstable parameter estimation and longer acquisition times.In this study, we proposed a method for characterizing intravoxel spatial distribution of diffusion by using texture analysis with GLCM (gray level cooccurrence matrix) from single-shell diffusion MRI data, which can be acquired in practical scan time. Since the method does not assume a diffusion distribution model, unstable calculation such as fitting process is not required.
Methods
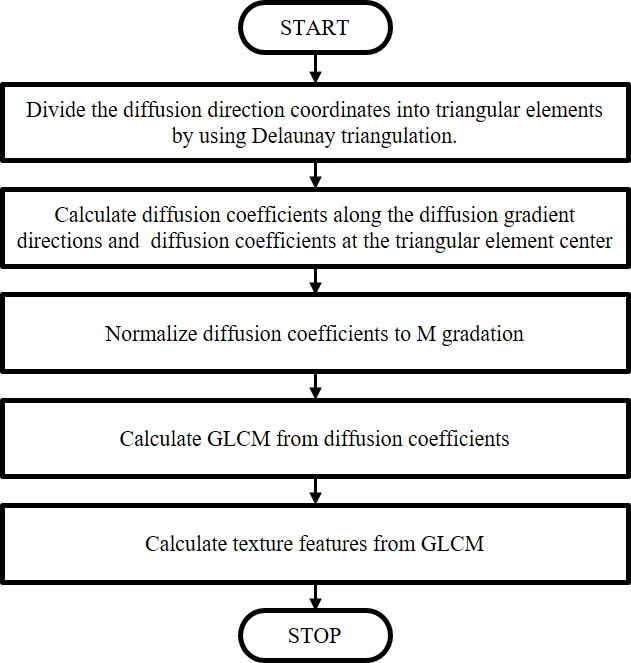
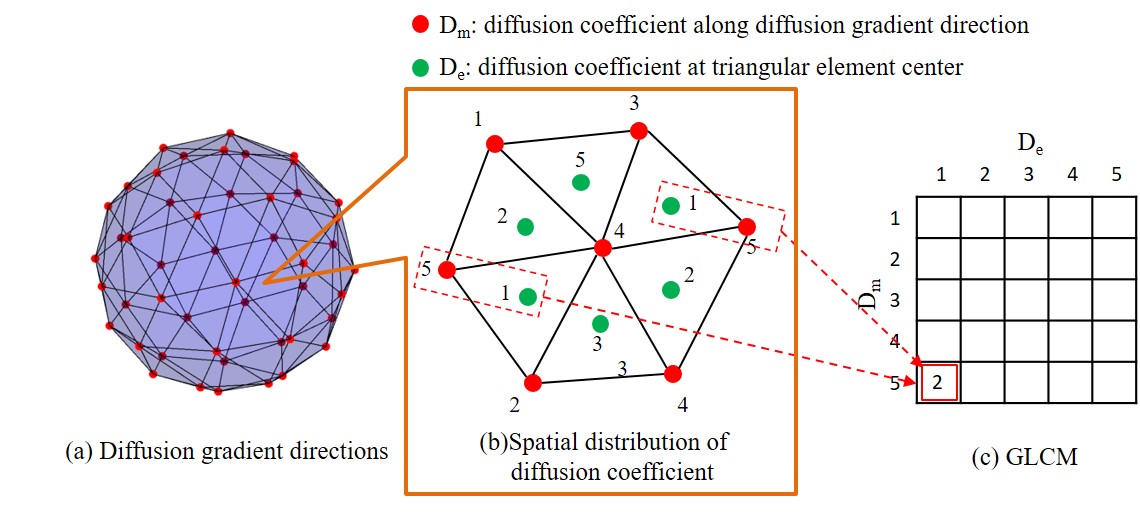
Figure 1 shows the processing flow of the proposed method. First, triangular elements are created using the Delaunay triangulation from the diffusion gradient directions used in the measurement. Here, both positive and negative directions are used. Next, the diffusion coefficients along the diffusion gradient directions are calculated, and further, the diffusion coefficients at the center of each triangular element are calculated by interpolation. Next, the calculated diffusion coefficients are normalized to M gradation. Then GLCM is created for texture analysis. Figure 2 shows the diagrammatic illustration of GLCM in the proposed method. In this study, the column of the GLCM indicates the diffusion coefficient along the diffusion gradient direction (Dm, red point in Figure 2 (b)), and the raw of the GLCM indicates the diffusion coefficient at the element center (De, green point in Figure 2 (b)). By counting the combinations of Dm and De (in the Figure 2, the number of combinations where Dm is 5 and De is 1), the numeric values in GLCM are filled. Here, each voxel has the diffusion coefficients along the diffusion gradient directions, so a single GLCM is created for each voxel. Next, texture features of spatial distribution of diffusion are calculated for each voxel using the GLCM, p (i, j). In this study, we calculated the uniformity (ASM: angular second moment), local difference (IDM: inverse difference moment), contrast (Constrast), randomness (Entropy), and local correlation (Correlation) using the following equations,$$ASM=\sum_i^M\sum_j^M(p(i,j))^{2}\quad\quad(1)\\ $$
$$IDM=\sum_i^M\sum_j^M\frac{1}{1+|i-j|}p(i,j)\quad\quad(2)\\ $$
$$Contrast=\sum_i^M\sum_j^M(i-j)^{2}p(i,j)\quad\quad(3)\\ $$
$$Entropy=\sum_i^M\sum_j^Mp(i,j)\log[p(i,j)]\quad\quad(4)\\ $$
$$Correlation=\sum_i^M\sum_j^M\frac{(i-\mu)(j-\mu)}{\sigma^{2}}p(i,j)\quad\quad(5)\\ $$
where, i and j are GLCM coordinates, M is a GLCM size, μ is an average value of i and j, and σ is a standard deviation of i and j.
For evaluation of the proposed method, two-dimensional spin-echo diffusion-weighted echo planner imaging (DW-EPI) was performed on six healthy volunteers using a 3 T MRI system (Hitachi, Ltd.). Images of 24 gradient directions and b-values (0 and 1000 s/mm2) were obtained. The study was approved by the ethics committee of Hitachi group headquarters. We compared conventional DTI-derived indices (MD and FA) with proposed indices (ASM, IDM, Contrast, Entropy, and Correlation).
Results
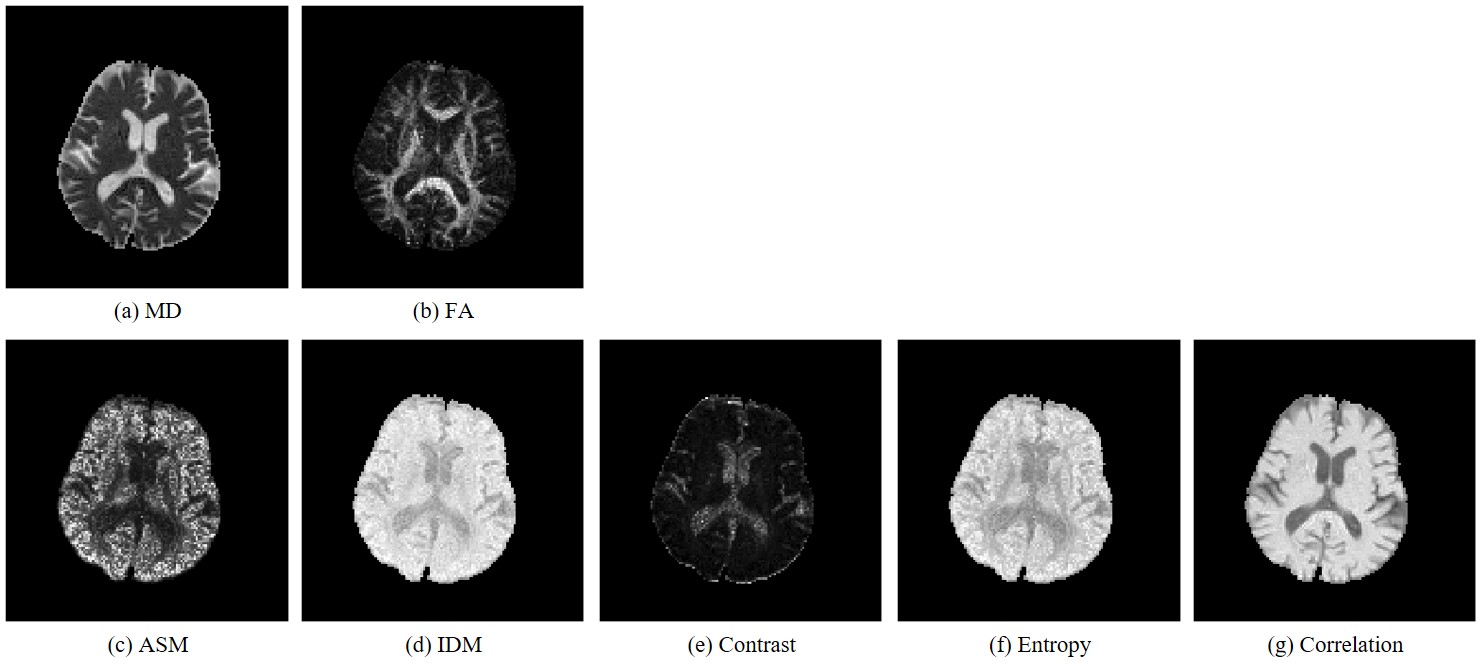
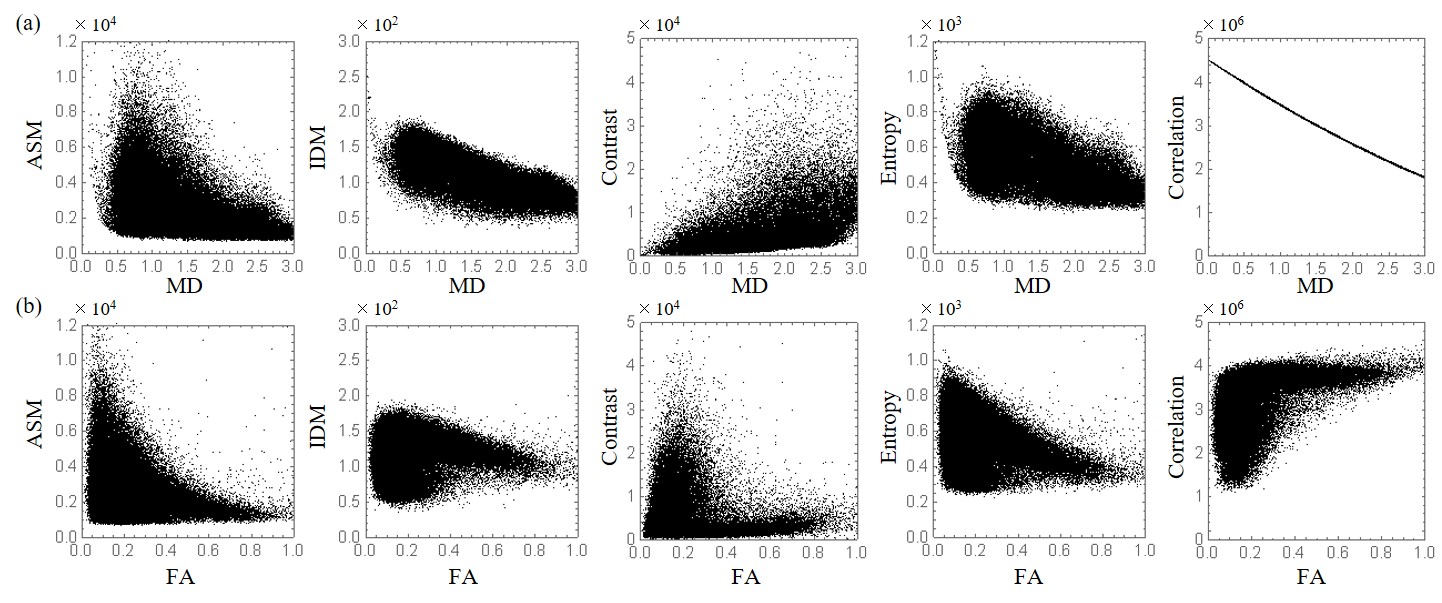
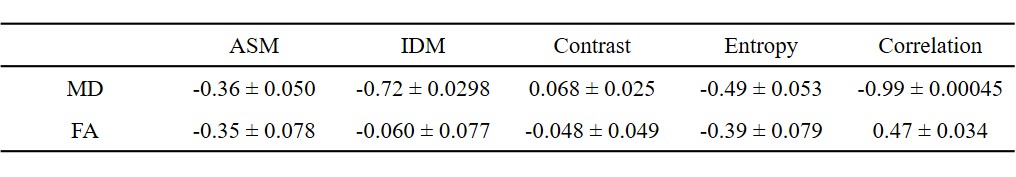
Figure 3 shows the MD and FA images (Figure 3 (a), (b)) and texture feature images ((c) ASM, (d) IDM, (e) Contrast, (f) Entropy, and (g) Correlation) of the 18th slice of a healthy volunteer. Similar images were obtained for all volunteers. Contrast of obtained texture feature images are greatly different from the conventional MD and FA images. Figure 4 shows (a) the correlation between MD values and texture features, and (b) the correlation between FA values and texture features. Table 1 shows the correlation coefficient between conventional indices (MD and FA) and texture features (ASM, IDM, Contrast, Entropy, and Correlation).Discussion
The results suggest that the obtained texture feature (ASM, Contrast, and Entropy) images have weak correlation with both MD and FA. This means that the proposed method can provide information about intravoxel spatial distribution of diffusion coefficients that is different from conventional DTI-driven indices. Although DTI assumes an elliptical diffusion distribution model and provide the degree of anisotropy and the principal diffusion directions, the proposed method derives texture features directly from diffusion MRI data without assuming a specific diffusion distribution model. The obtained texture features represent the state of the spatial distribution of the diffusion, such as randomness and uniformity. Although the texture features have no biological meaning yet, they are expected to characterize the small differences related to tissue microstructures. Unlike previous studies that assumes specific biological model, the proposed method is not restricted by tissue specific assumption. Moreover, the proposed method can be applied to other diffusion physical quantities, such as kurtosis coefficient to characterize intravoxel spatial distribution of those quantities.Conclusion
We have proposed the method for characterizing the intravoxel spatial distribution of diffusion coefficients by using texture analysis with GLCM. The method could provide novel diagnostic indices of diffusion MRI without additional acquisition.Acknowledgements
No acknowledgement found.References
1. Alexander AL1, Lee JE, Lazar M, et al. Diffusion tensor imaging of the brain, Neurotherapeutics. 2007;4(3):316-326.
2. Descoteaux M, Angelino E, Fitzgibbons S, et al. Regularized, Fast, and Robust Analytical Q-Ball Imaging, Magn Reson Med. 2007;58(3):497-510.
3. Zhang H, Schneider T, Wheeler-Kingshott CA, et al. NODDI: Practical in vivo neurite orientation dispersion and density imaging of the human brain. NeuroImage 2012;61(4):1000-1016.
Figures