4376
Free-Water Diffusion Tensor Imaging (DTI) improves the accuracy and sensitivity of white matter analysis in Alzheimer’s disease1Division of Neuroimaging Research, Barrow Neurological Institute, Phoenix, AZ, United States, 2The Muhammad Ali Parkinson Center, Barrow Neurological Institute, Phoenix, AZ, United States
Synopsis
The objective of this study is to investigate differences in white matter (WM) integrity between Alzheimer’s disease (AD) and healthy subjects (HC) using diffusion tensor imaging (DTI) metrics from standard DTI and free-water (FW)-DTI. Regional changes in DTI metrics were found with both standard and FW-DTI, while FW-DTI improves the reliability and inter-parameter consistency of DTI metrics in the presence of atrophy. We hypothesize that the implementation of FW correction algorithm for DTI may provide more sensitive and specific insight into AD-related pathological changes in WM.
INTRODUCTION
Alzheimer’s disease (AD) is a neurodegenerative disorder and the most common cause of dementia in older adults1. Current biomarkers for AD target the dominant pathological paradigm, characterized by beta-amyloid and tau pathologies, as well as neurodegenerative changes. DTI can be used in AD to assess WM integrity with metrics such as fractional anisotropy (FA), axial/radial diffusivities (AxD and RD), and mode of anisotropy (MA). Although standard DTI is susceptible to the effects of extracellular free water (FW)2, which reduce the accuracy of derived metrics, these effects can be removed using an advanced FW-DTI model3. In this study, we investigated differences in WM integrity between AD and healthy controls (HC) using standard and FW-DTI. We hypothesize that FW-DTI will improve the sensitivity and specificity for detection of WM tract abnormalities in AD.METHODS
All data were downloaded from the OASIS-3 brain project database (http://oasis-brains.org/). We included 30 HCs (17 females; age (standard deviation) = 73(6) years; Mini-Mental State Exam (MMSE) = 29.10(1.24)) and 28 AD subjects (primarily mild AD; 15 females; age = 75(7) years; MMSE = 24.18(5.02)). DTI data was acquired (Siemens 3T) using 65 diffusion-encoding directions (b-value: 1000 s/mm2; TR/TE: 11000/87.0 ms; flip-angle = 90°; matrix: 96×96; field of view: 24.0×24.0 cm; slice thickness: 2.5 mm; 64 axial slices) and one non-diffusion-weighted image (b0). DTI data were preprocessed using FSL4, including eddy current and motion correction5 and brain extraction6. All DTI and FW-DTI metrics were calculated using an in-house MATLAB script. FW-DTI was performed by fitting the model developed by Pasternak et al.3. WM integrity was compared between groups using the FSL-Randomise tool with ANCOVA, with age and gender as covariates. All results are reported at a significance threshold of p-value < 0.01, corrected for family‐wise error (FWE).RESULTS
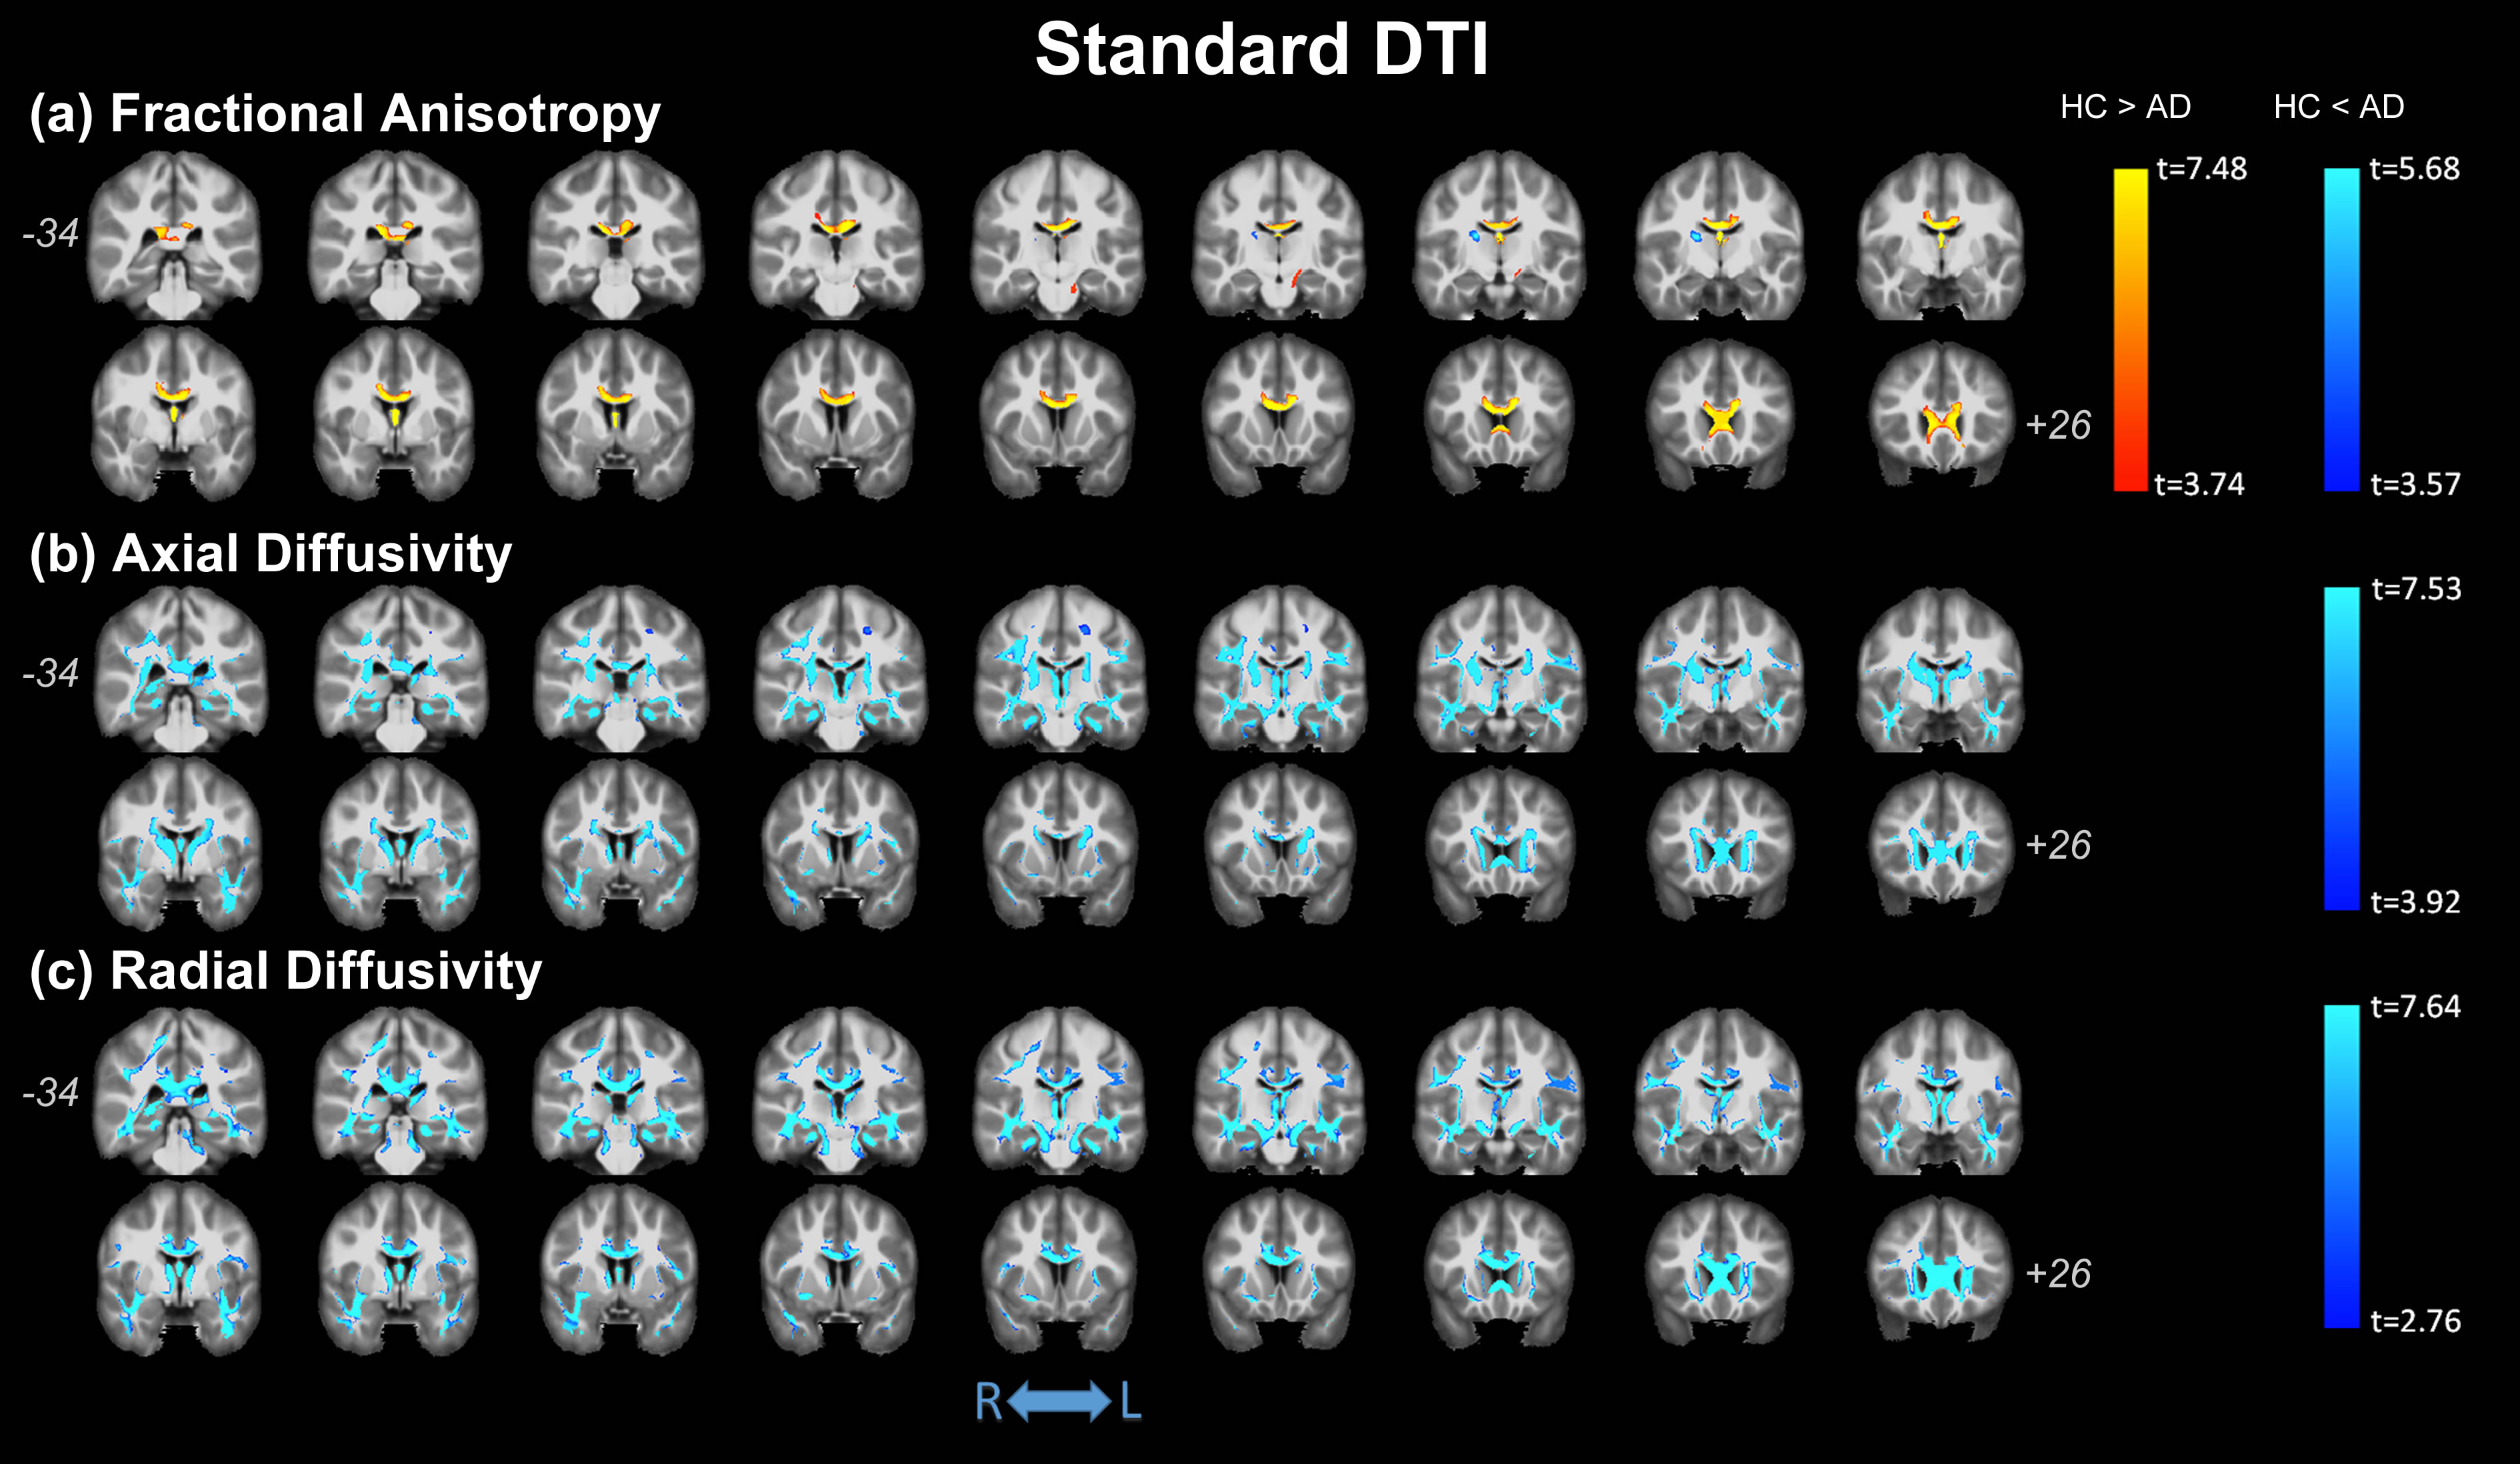
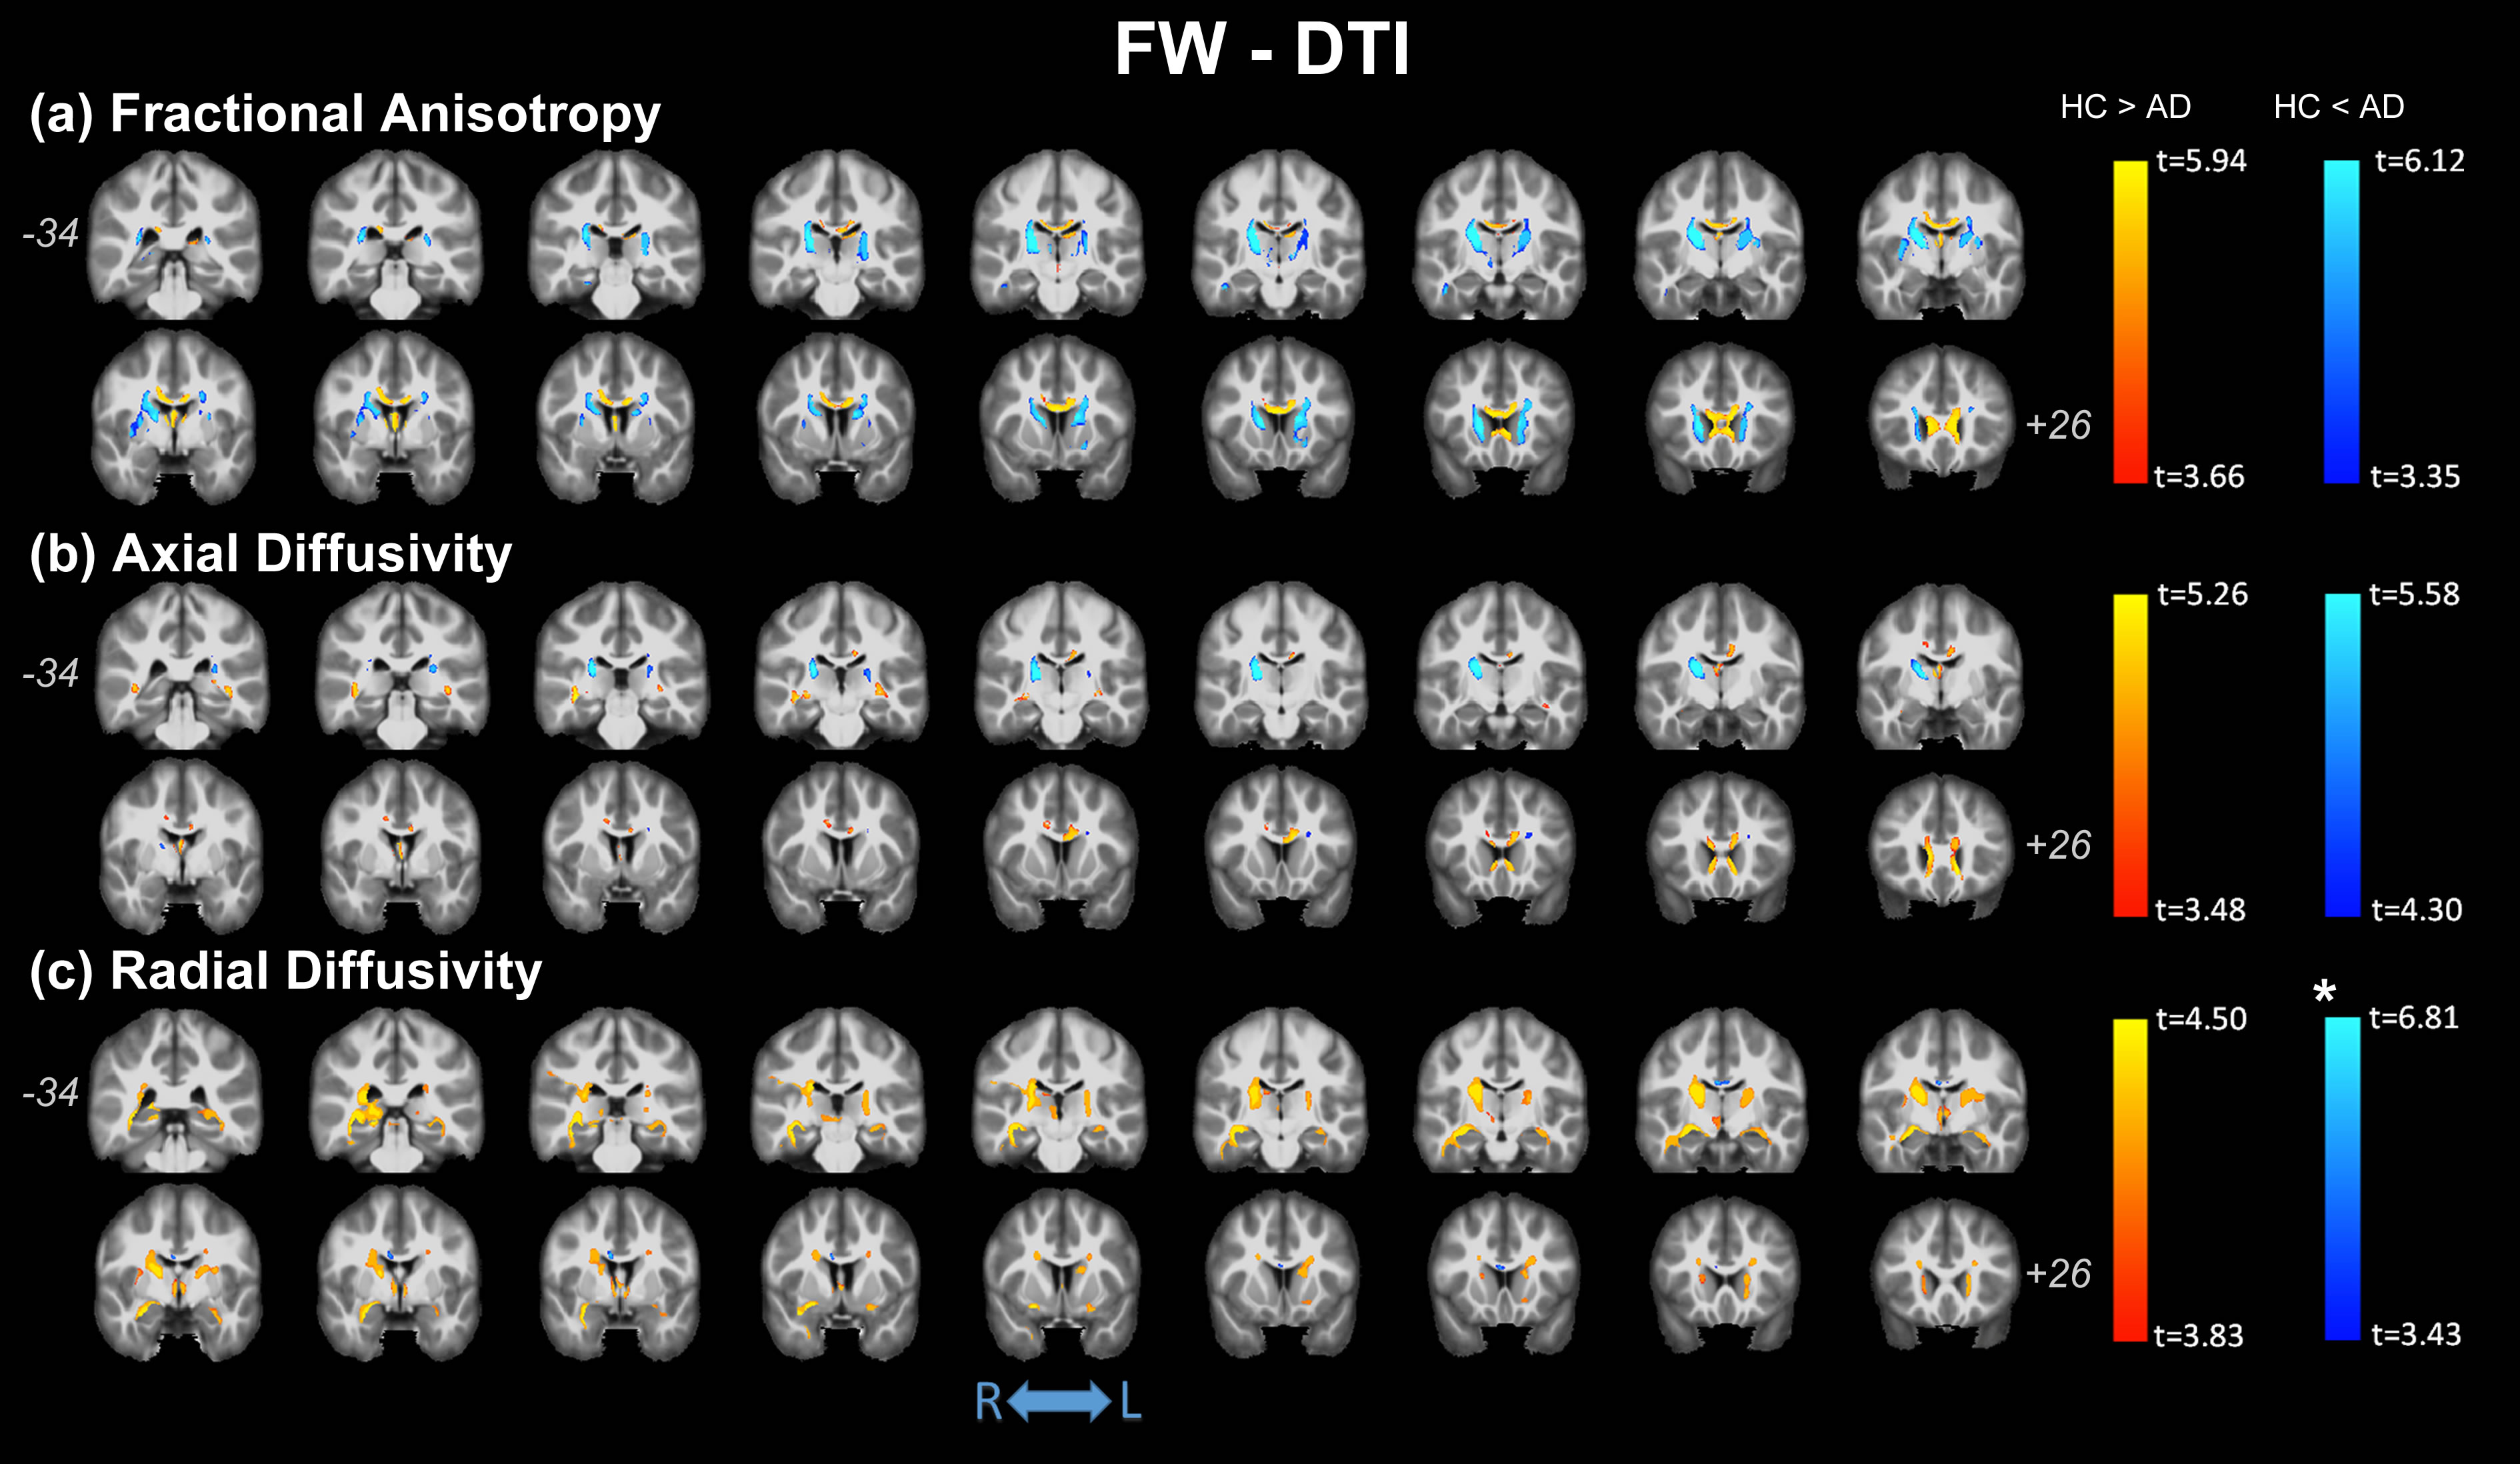
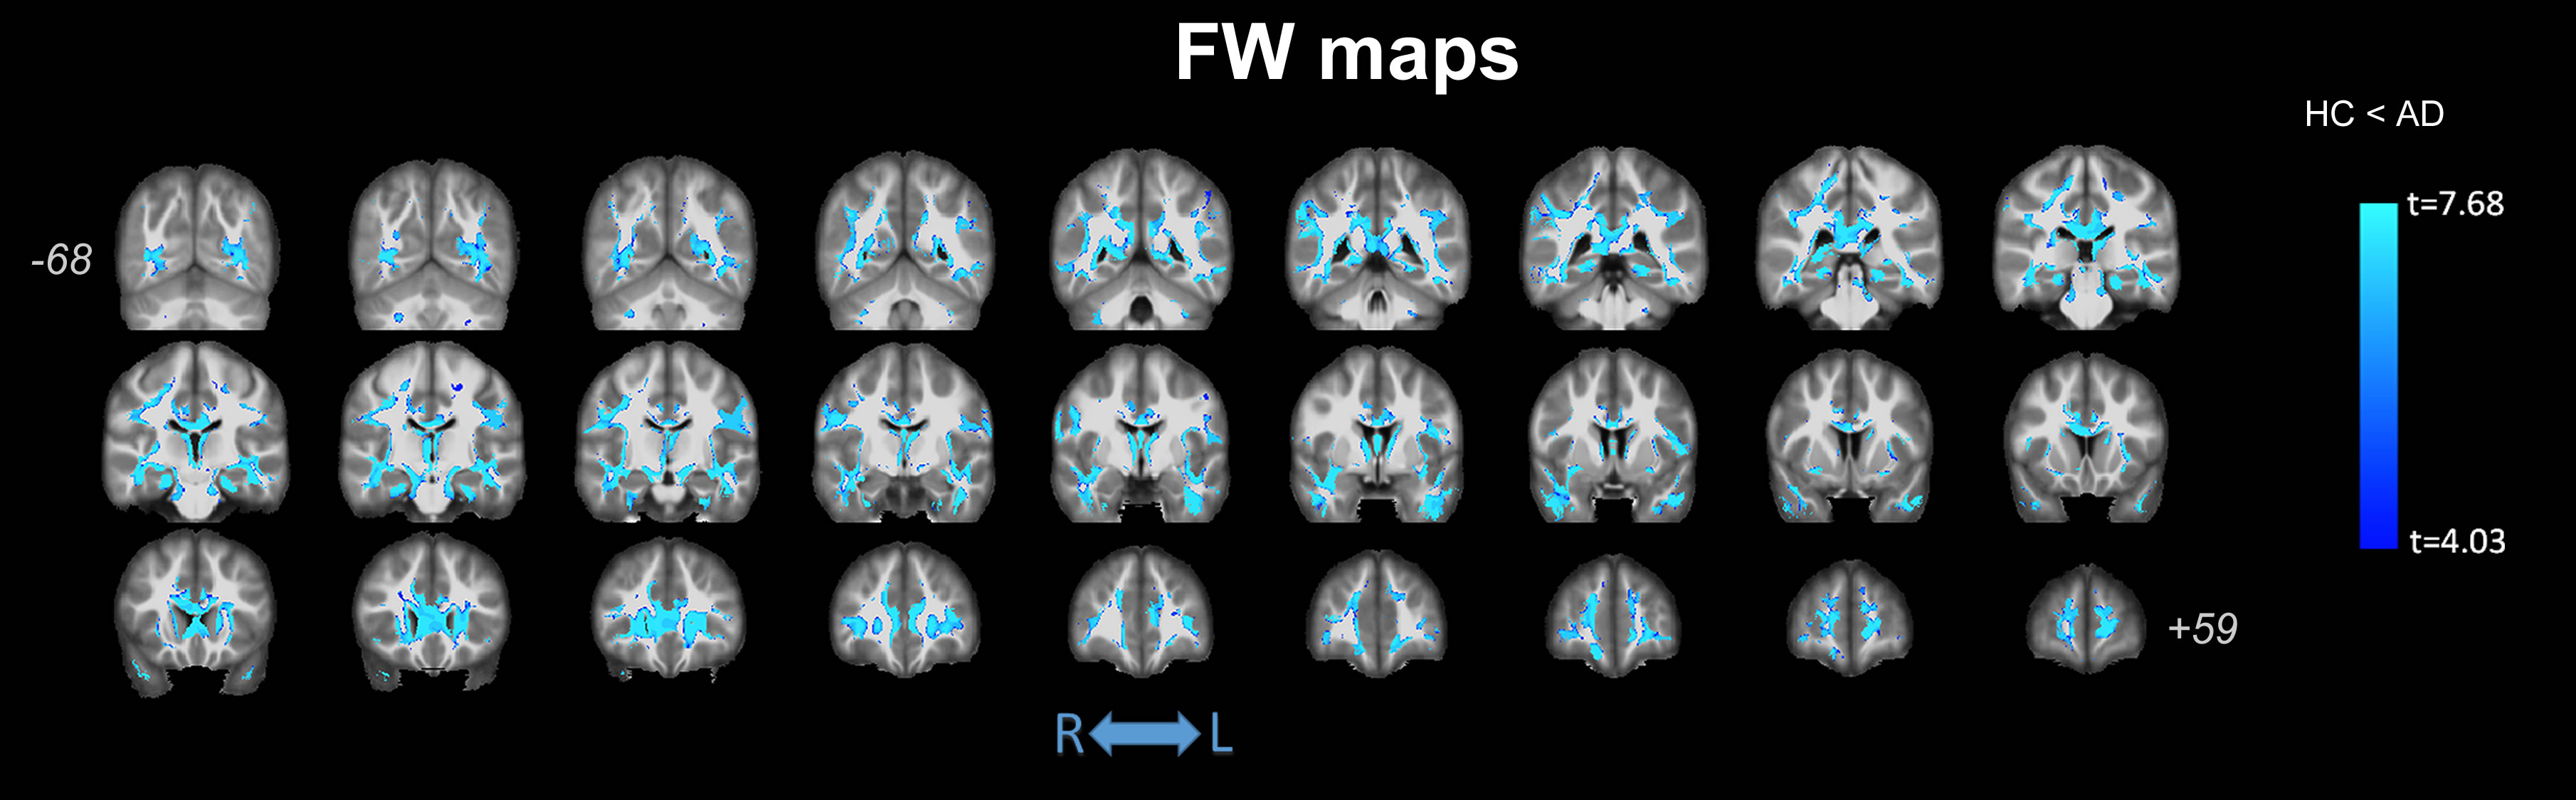
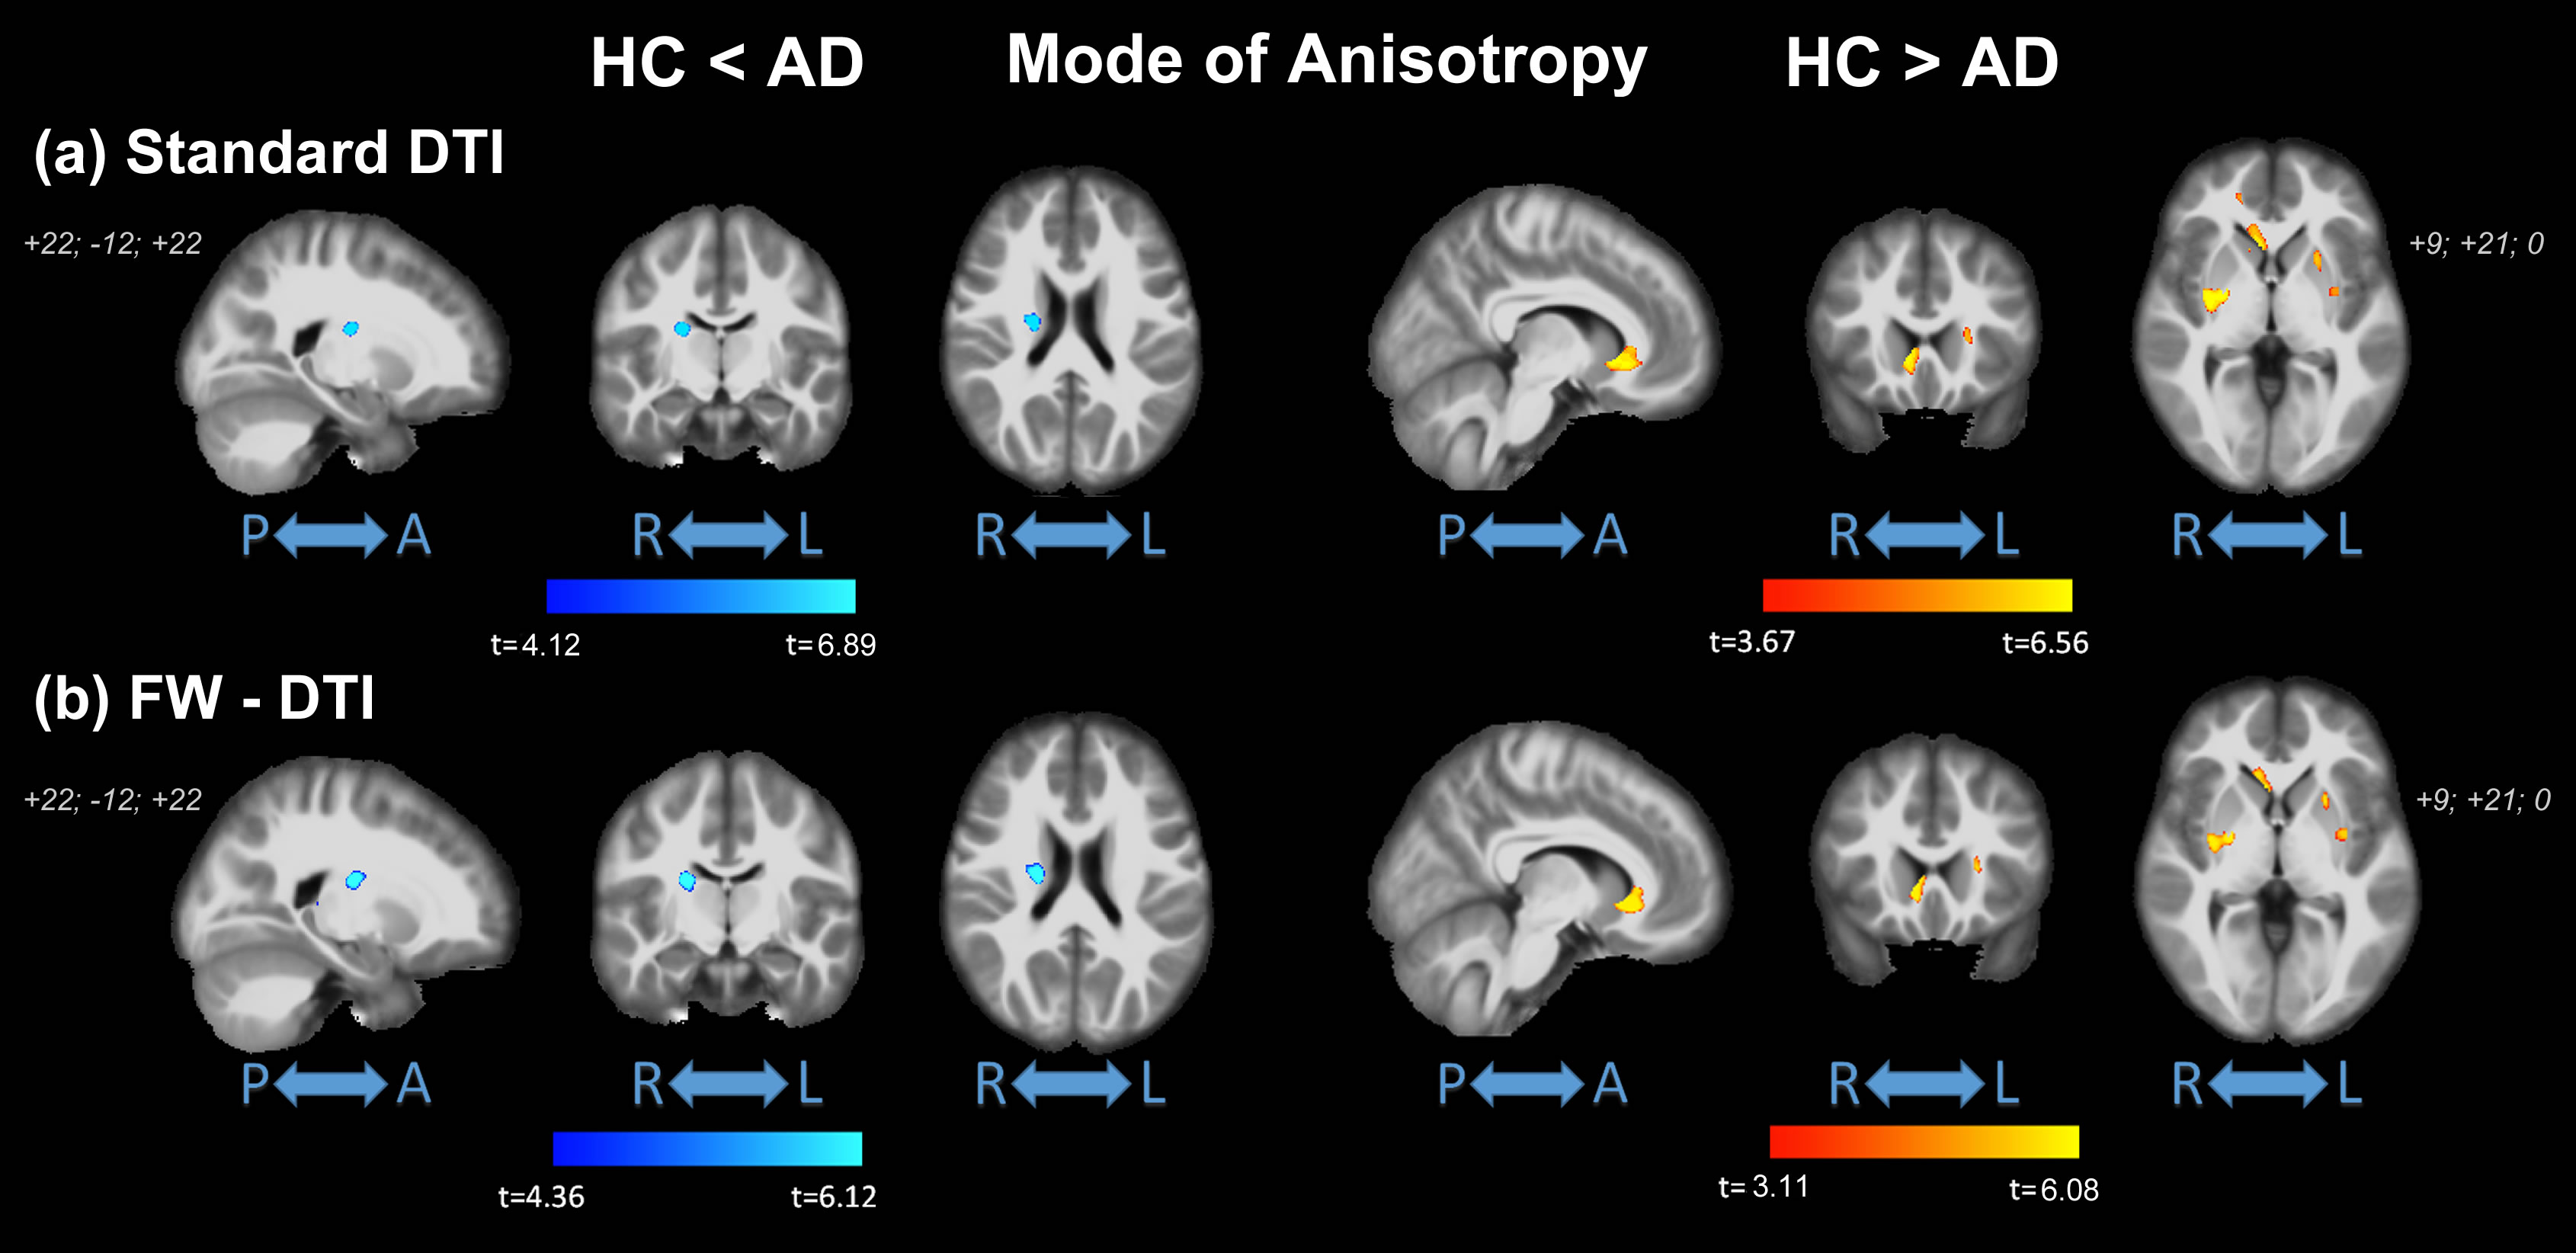
No significant differences were observed in age (t-test; p=0.137) or gender (p=0.817) between HC and AD; significant differences were found for MMSE (p<0.0001). Figure 1 shows the clusters of significant differences between the two groups obtained with standard DTI metrics. Lower FA (panel (a)) was observed in AD compared with HC mainly in the fornix and corpus callosum (CC). Clusters where AD had higher FA values than HC were found in the right anterior thalamic radiation (ATR), cortical spinal tract (CST), and posterior limb of internal capsule (PLIC). Panels (b) and (c) show widespread, non-specific WM regions where increased AxD and RD were found in AD, while no reduced AxD or RD was observed. Figure 2 shows the clusters of significant differences between groups for FW-DTI metrics. The clusters where AD had lower FW-FA than HC correspond to the same WM locations, though smaller, as those observed using standard FA, while increased FW-FA was observed bilaterally. For FW-AxD and FW-RD, significant clusters were observed with both higher and lower values with AD pathology in multiple regions. More specifically, AxD was reduced with AD pathology in CC and fornix and predominantly increased in the ATR, CST, and retrolenticular part of internal capsule. Reduced FW-RD was observed with AD mainly in the ATR, CST, PLIC, and superior fronto-occipital fasciculus (SFOF). Figure 3 shows the significant differences between groups using the FW index. Only clusters with higher FW values in AD compared with HC were found, located mainly in the fornix, cingulum, and CC. The results for MA, which is a complementary measure to FA that discriminates between linear and planar anisotropy7, are reported in Figure 4. For both DTI and FW-DTI, significantly higher values of MA in AD compared with HC were observed in the right CST, right PLIC, and right SFOF, corresponding to more linear anisotropy.DISCUSSION
For both standard and FW-DTI techniques, significant WM differences were observed between HC and AD subjects in several WM regions, including both increased and decreased FA. Reductions in FA, indicative of more isotropic motion, are consistent with neurodegenerative changes and were observed in AD in multiple regions, including most prominently the fornix and CC. Of particular interest, the fornix is the major output tract of the hippocampus and plays a major role in episodic memory8. Decreased FA and increased MD in the fornix has been a robust and consistent finding in AD8 and may correlate with cognitive decline8,9. Using standard DTI, non-specific increases in AxD and RD were observed across WM, while FW-AxD and FW-RD had better agreement with regional FA changes. Additionally, the increment of MA in AD subjects, together with increased FA, suggests a more linear shape of the diffusion tensor, indicative of the loss of crossing fiber populations. Higher FW volume was observed in AD, which may be related to microstructural WM changes in pathology.CONCLUSION
Overall, the implementation of a FW correction algorithm for DTI improves the sensitivity and specificity of derived DTI metrics by removing partial volume effects (PVEs) and better captures underlying AD-related pathologic changes than standard DTI approaches. FW-DTI metrics were more consistent with known AD pathology, both in terms of magnitude and direction of DTI changes. In addition, the FW index may improve sensitivity to sub-voxel neurodegeneration.Acknowledgements
This work was supported by the Barrow Neurological Foundation. Data was provided by the OASIS project, supported by the following NIH grants: P50 AG05681, P01 AG03991, R01 AG021910, P50 MH071616, U24 RR021382, R01 MH56584.References
1. Ferri CP, Prince M, Brayne C, et al. Global prevalence of dementia: a Delphi consensus study. Lancet 2005;366(9503):2112-2117.
2. Pierpaoli C, Jezzard P, Basser PJ, et al. Diffusion tensor MR imaging of the human brain. Radiology 1996;20 (3):637-648.
3. Pasternak O, Sochen N, Gur Y, et al. Free water elimination and mapping from diffusion MRI. Magn Reson Med 2009;62(3):717-730.
4. Smith SM, Jenkinson M, Woolrich MW, et al. Advances in functional and structural MR image analysis and implementation as FSL. Neuroimage 2004;23 Suppl 1:S208-219.
5. Andersson JLR, Sotiropoulos SN. An integrated approach to correction for off-resonance effects and subject movement in diffusion MR imaging. Neuroimage 2016;125:1063-1078.
6. Smith SM. (2002) Fast robust automated brain extraction. Hum Brain Mapp 2002;17(3):143-155.
7. Ennis DB, Kindlmann G. Orthogonal tensor invariants and the analysis of diffusion tensor magnetic resonance images. Magn Reson Med. 2006;55(1):136-46.
8. Oishi K, Lyketsos CG. Alzheimer's disease and the fornix. Front Aging Neurosci 2014;6:241. 9. Mielke MM, Kozauer NA, Chan KC, et al. Regionally-specific diffusion tensor imaging in mild cognitive impairment and Alzheimer's disease. Neuroimage 2009;46(1):47-55.
Figures