4375
Automatic Segmentation in Ischemic Stroke Rodent Brain with Pattern-recognition of Directional Intravoxel Incoherent Motion MRI1Biomedical Engineering, Ulsan national institute of science and technology, Ulsan, Republic of Korea, 2Center for Neuroscience Imaging Research, Institute of Basic Science, Suwon, Republic of Korea
Synopsis
The purpose of this study is to demonstrate automatic segmentation for reduced diffusion and perfusion areas in ischemic stroke brains with pattern-recognition (constrained non-negative matrix factorization (cNMF)) to directional intravoxel incoherent motion MRI (IVIM-MRI). The robustness of region segmentation with pattern-recognition was observed in both simulations and in vivo experiments. Using pattern-recognition analysis of IVIM signal, white matter in which flow may have been aligned, and lesion regions are automatically segmented in ischemic stroke brain. In this study, we successfully implemented pattern-recognition to directional IVIM signals.
Introduction
Changes in diffusion and perfusion are important in ischemic stroke for accurate diagnosis and therapy1-4. However, the conventional double-exponential fitting method is controversial due to overfit problems5 and ambiguous standard for defining double-exponentiality. In addition, flow direction may be an important factor in ischemic stroke to study blood flow compensating function6. Directionality studies using arterial spin labeling-MRI (ASL-MRI) have been proposed7,8, however, ASL-MRI is limited to arterial information only. To avoid these problems, we used constrained nonnegative matrix factorization (cNMF)-based pattern-recognition on directional intravoxel incoherent motion (IVIM) signals for automatic segmentation of lesion and white matter regions in stroke brain.Methods
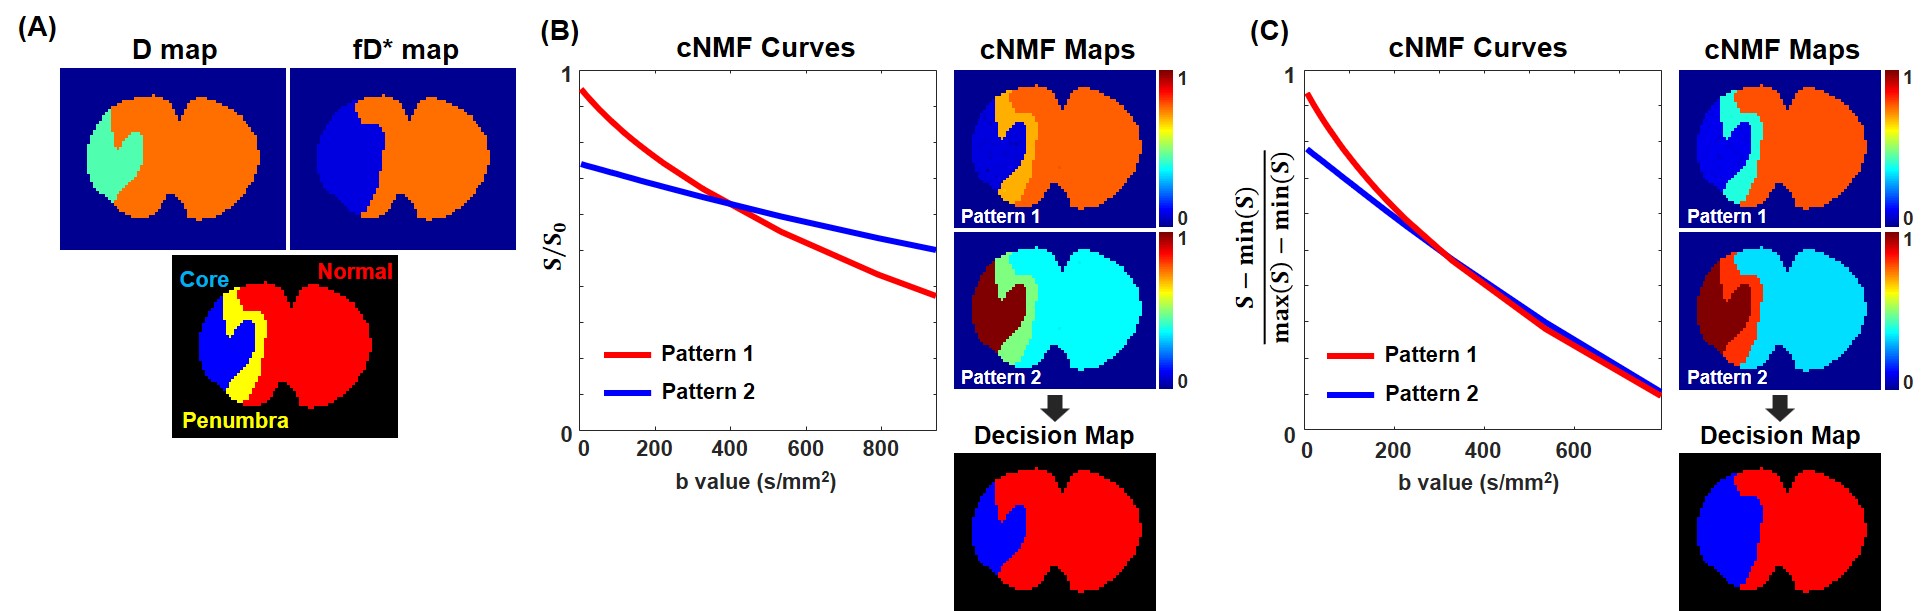
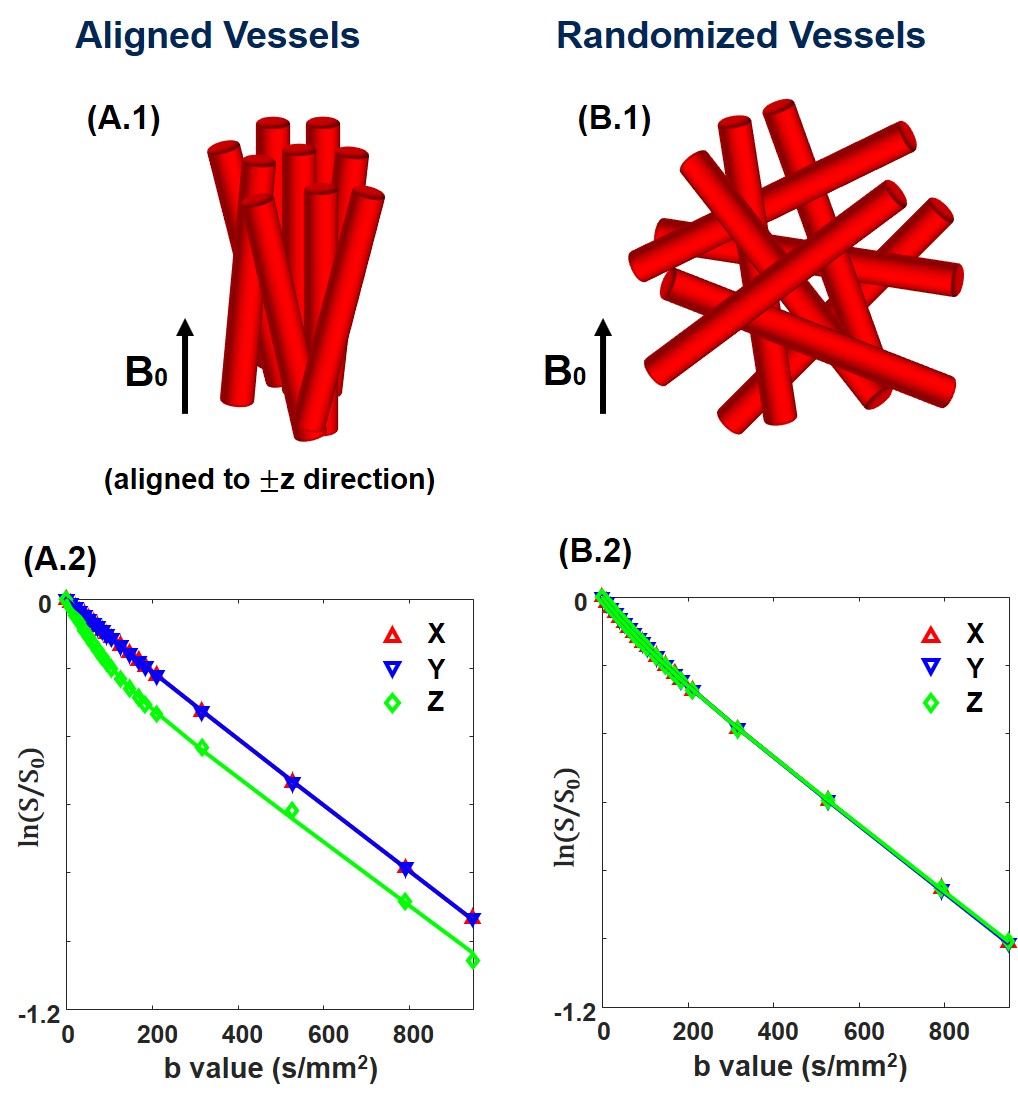
SimulationTo mimic acute ischemic stroke rat brain, the synthetic brain was separated into three regions9; core (low D and fD*), penumbra (normal D, low fD*), and normal (normal D and fD*). Before implementing cNMF-based pattern recognition10,11, two normalization methods were used; (i) S0-normalized signal and (ii) scaled signal divided by difference between the maximum and minimum of the signal. The accuracies of segmentation for reduced perfusion region between double-exponential fitting and cNMF results were compared. In addition, the robustness of segmentation from cNMF results according to signal-to-noise (SNR) was verified. Monte-Carlo simulation was performed to identify the IVIM signal pattern based on the vascular orientation (randomized and aligned vessel)12. IVIM signals from two vascular models were compared along diffusion gradient-direction.
MR experiment
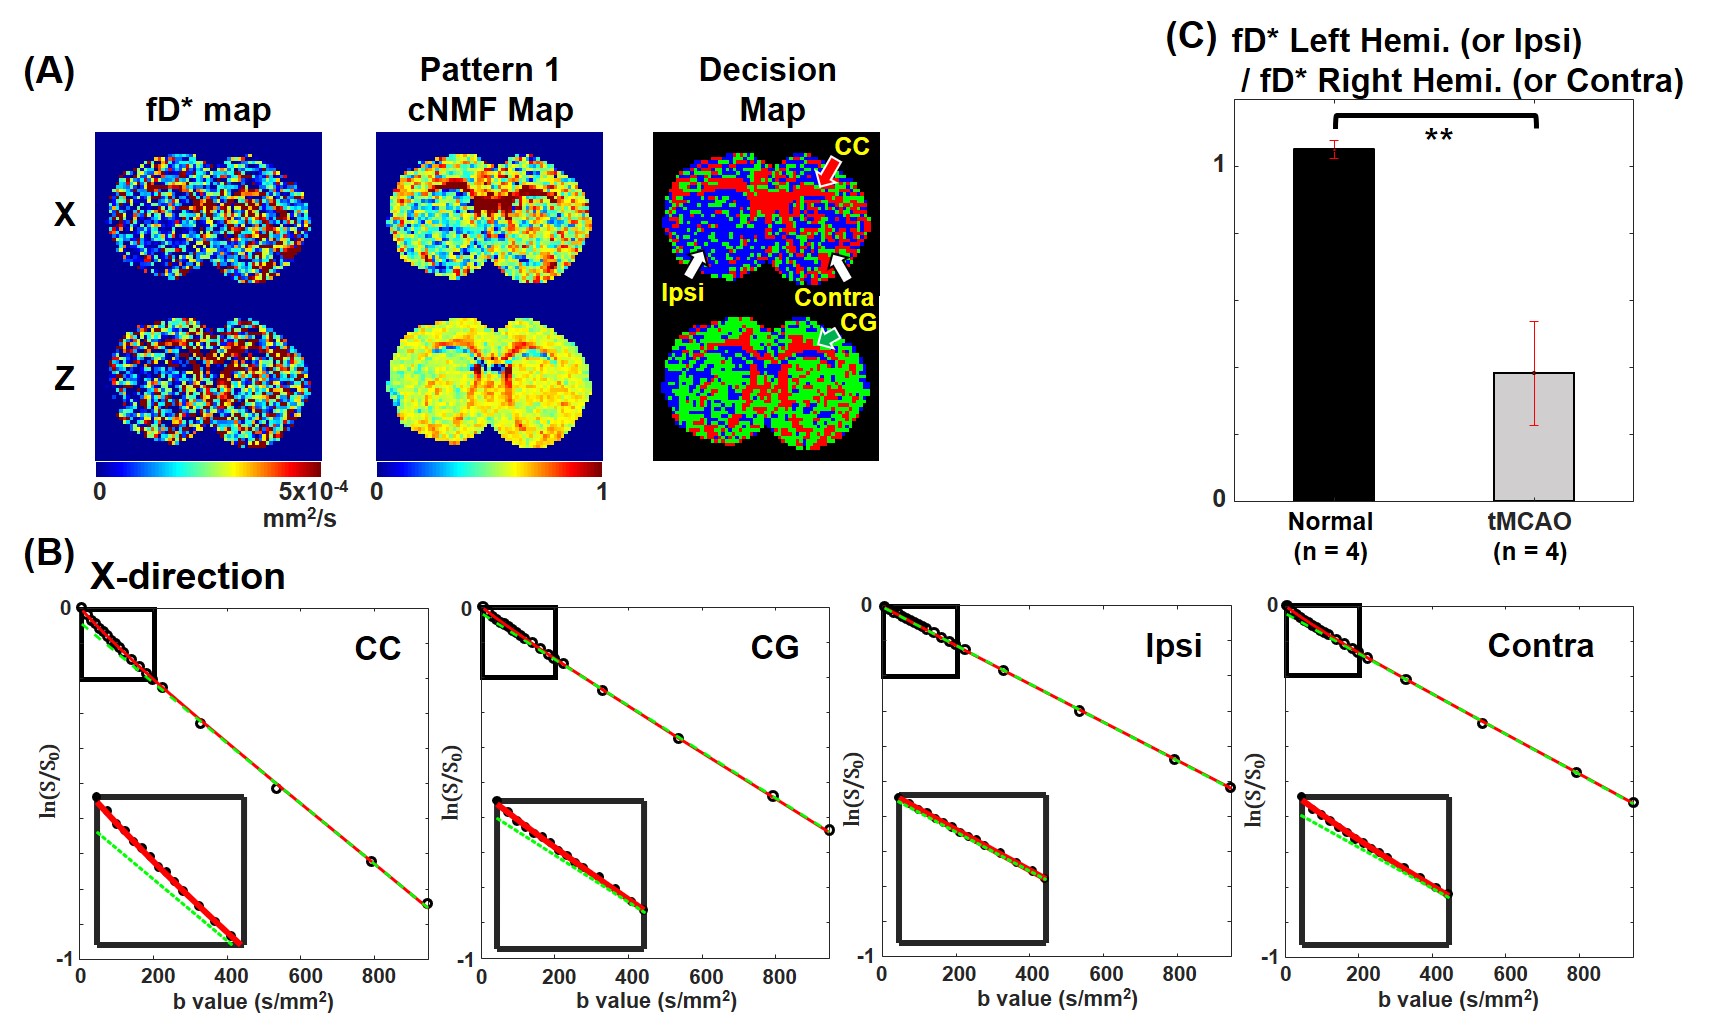
The transient middle cerebral artery occlusion (tMCAO) model was used for in-vivo experiments. IVIM signals were acquired from a spin-echo echo planar imaging (SE-EPI) sequence with twenty b-values for three orthogonal directions. Dynamic susceptibility contrast-MRI (DSC-MRI) data was obtained by gradient-echo EPI (GE-EPI) sequence with super-paramagnetic iron oxide nano-particle (SPION) to compare with cNMF results. As the input signal of cNMF-based pattern recognition, two types of signals were used (S0-normalized and scaled signal). Regions of interest (ROI) of both white matter region (corpus callosum (CC) and cingulum (CG)) and ipsilateral (left hemisphere) and contralateral (right hemisphere) region were selected from the cNMF result. The averaged signal of each ROI was fitted (double-exponential fitting and single-exponential fitting with b value > 200 s/mm2) and compared to each region in x diffusion-gradient direction. Statistical analysis was performed with normal (n=4) and tMCAO rat (n=4) for fD* ratio (ipsilateral (left hemisphere)/contralateral (right hemisphere)) of auto-segmented regions in cNMF results.
Results
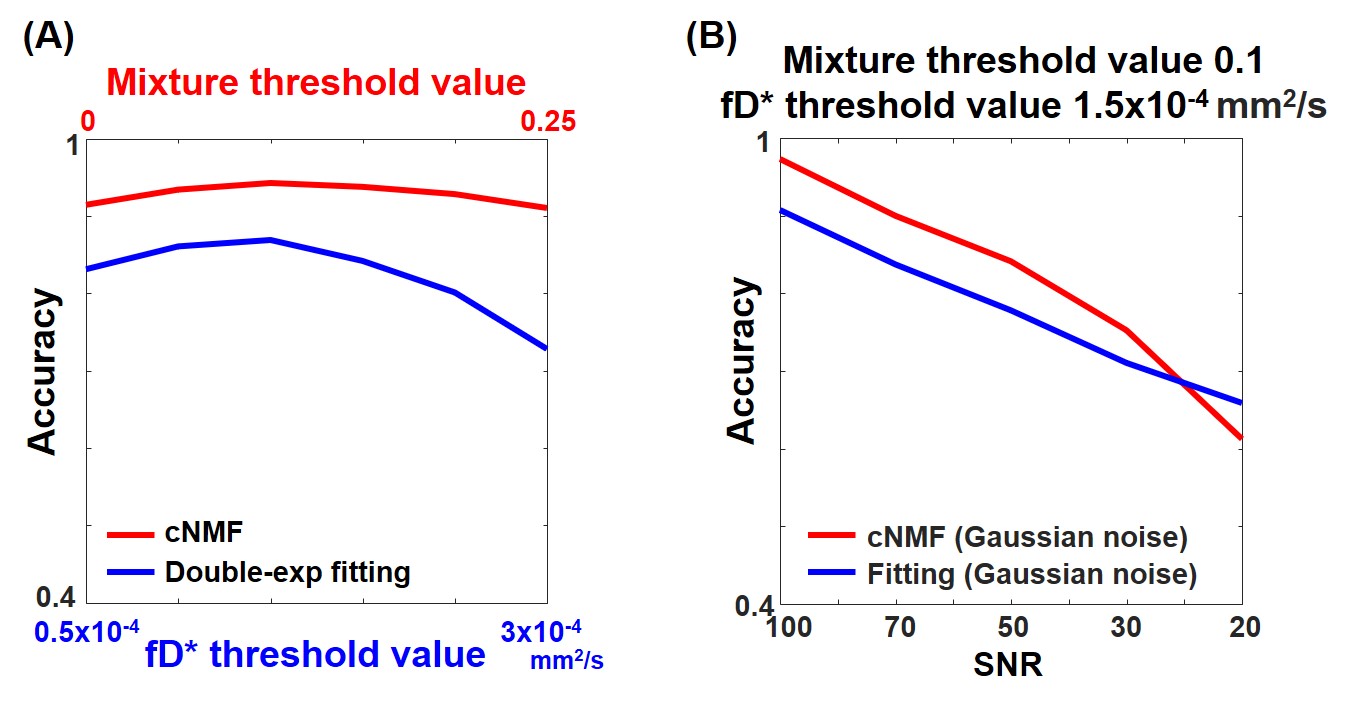
SimulationThe input IVIM parameter map (first row) and the input segmented brain region (second row) were shown in Fig 1A. Fig 1B and 1C illustrate cNMF curves, cNMF maps for each pattern, and decision map from S0-normalized and scaled IVIM input signals were shown, respectively. The pattern 1 attenuated faster than pattern 2 in Fig 1B. In the cNMF map of pattern 1, the weight of penumbra is much closer to the normal region than the core region. Therefore, the decision map corresponds well with the input D map. For the cNMF curves with scaled signal (Fig 1C), there is a noticeable difference at low b values. The weight of penumbra is much closer to core region than the normal region. By changing the mixture threshold value (the designated value for determining the pattern mixed state) and the fD* threshold value, the accuracy of cNMF and double-exponential fitting for lesion segmentation was shown in Fig 2A. The accuracy of cNMF method was higher than the double-exponential fitting. In addition, the accuracy of cNMF method was higher than the double-exponential fitting when the SNR was greater than ~30 (Fig 2B).
For the aligned vascular model (Fig 4A.1), the IVIM signal with z diffusion-gradient direction has higher double-exponentiality than that with the other diffusion gradient-direction (Fig 4A.2). However, the IVIM signals (Fig 4B.2) are identical in three diffusion-gradient directions when the vessel orientation is randomized (Fig 4B.1).
MR experiment
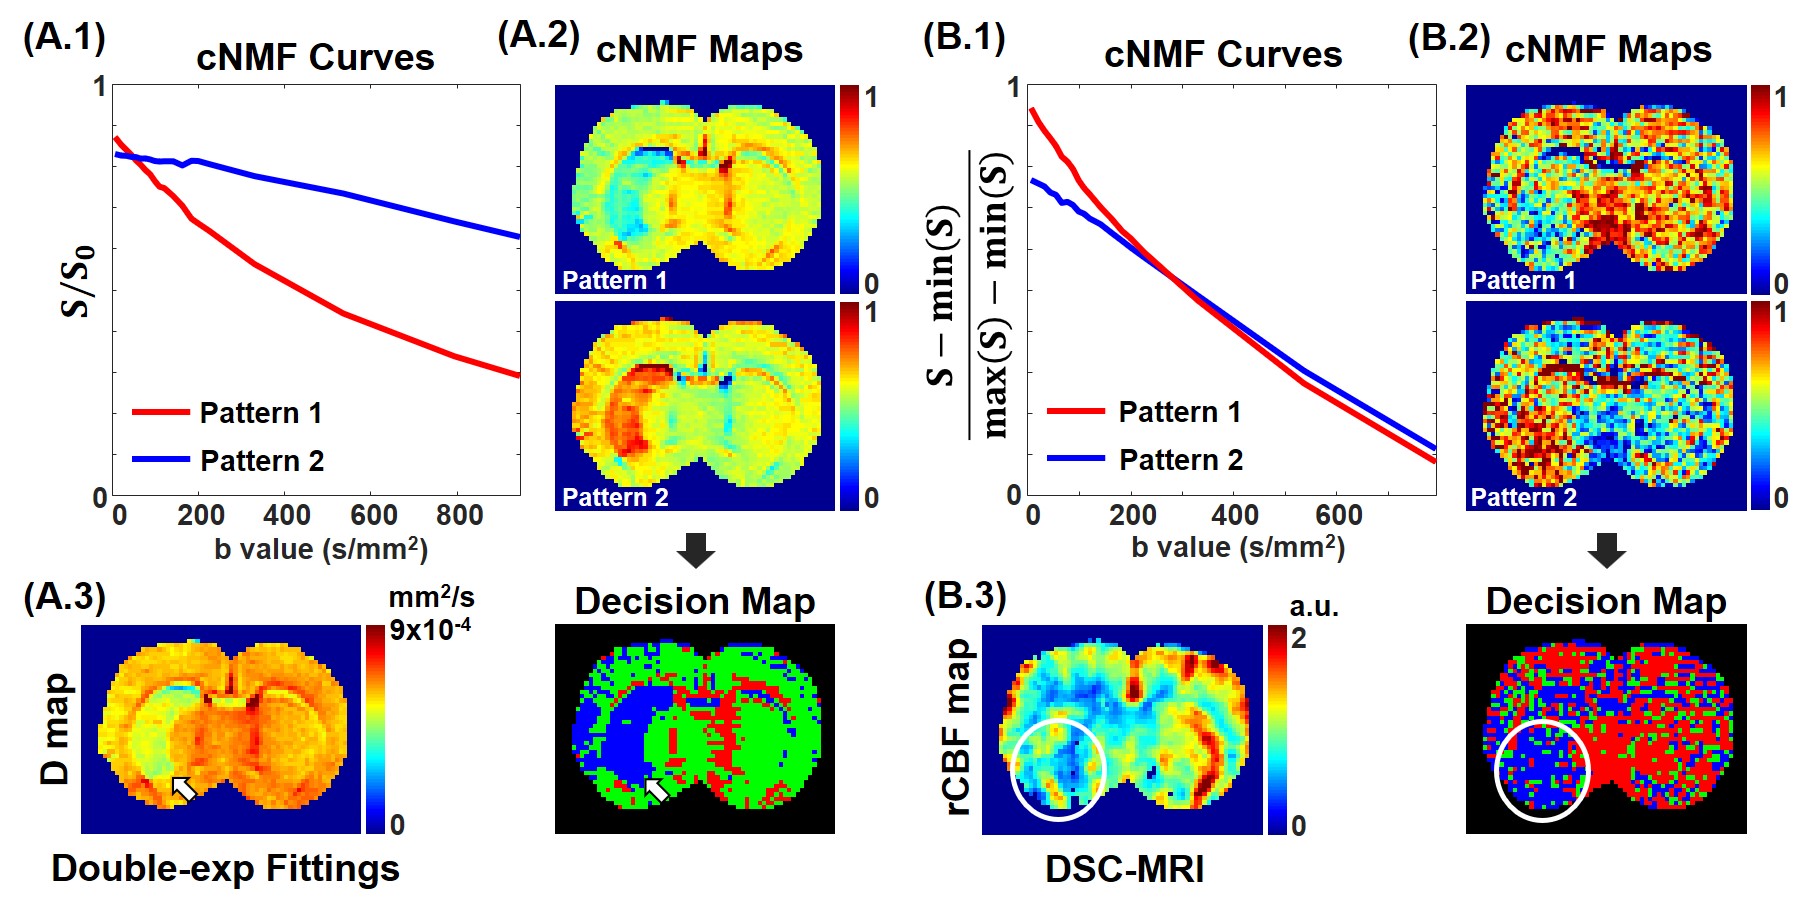
In the decision map with S0-normalized IVIM signal (Fig 3A.2), the blue-colored region with white arrows matched the lesions with white arrows in the D map (Fig 3A.3). The blue-colored region with a white circle in decision map with scaled IVIM signal (Fig 3B.2) matched the reduced flow region with a white circle in rCBF map (Fig 3B.3). In Fig 5B, the average IVIM signal of CC aligned to the x-direction has high double-exponentiality, however, the double-exponentiality of CG aligned to z-direction is low in the x diffusion-gradient direction. The double-exponentiality of ipsilateral region (lesion) was lower than that of contralateral region (normal). In normal rat, fD* values were similar between the left and right hemispheres. On the other hand, the fD* value of the ipsilateral region was significantly reduced than the fD* value of the contralateral region in the tMCAO rat (Fig 5C).
Discussion & Conclusions
In this study, we have successfully performed automatic segmentation of lesion and white matter region via cNMF-based pattern-recognition with two types of input IVIM signals along the diffusion gradient-direction. In addition, we observed the robustness of segmentation with cNMF analysis by comparing double-exponential fitting results in simulation. The pattern-recognition analysis will be beneficial for disease in which vessel structure and flow direction can change. In future studies, robust pattern-recognition method of IVIM signals should be investigated for multi-directionality, the number of b values, and multi-compartment models.Acknowledgements
This research was supported by Basic Science Research Program through the National Research Foundation of Korea (NRF) funded by the Ministry of Education (2018R1A6A1A03025810)References
1. Markus HS. Cerebral perfusion and stroke. Journal of Neurology, Neurosurgery & Psychiatry. 2004;75(3):353-361.
2. Brant-Zawadzki M, Weinstein P, Bartkowski H, Moseley M. MR imaging and spectroscopy in clinical and experimental cerebral ischemia: a review. American Journal of Roentgenology. 1987;148(3):579-588.
3. Grandin CB, Duprez TP, Smith AM, et al. Usefulness of magnetic resonance–derived quantitative measurements of cerebral blood flow and volume in prediction of infarct growth in hyperacute stroke. Stroke. 2001;32(5):1147-1153.
4. Rose SE, Chalk JB, Griffin MP, et al. MRI based diffusion and perfusion predictive model to estimate stroke evolution. Magnetic resonance imaging. 2001;19(8):1043-1053.
5. Chow AM, Gao DS, Fan SJ, et al. Liver fibrosis: an intravoxel incoherent motion (IVIM) study. Journal of Magnetic Resonance Imaging. 2012;36(1):159-167.
6. Liu L, Ding J, Leng X, et al. Guidelines for evaluation and management of cerebral collateral circulation in ischaemic stroke 2017. Stroke and vascular neurology. 2018;3(3), 117-130.
7. Park SH, Do WJ, Choi SH, Zhao T, Bae KT. Mapping blood flow directionality in the human brain. Magnetic resonance imaging. 2016;34(6):754-764.
8. Wells JA, Thomas DL, Saga T, Kershaw J, Aoki I. MRI of cerebral micro-vascular flow patterns: A multi-direction diffusion-weighted ASL approach. Journal of Cerebral Blood Flow & Metabolism. 2017;37(6):2076-2083.
9. Jang MJ, Han SH, Cho H. Automated Pattern Recognition Analysis of Intravoxel Incoherent Motion (IVIM)-diffusion to Segment Hypo-perfused Stroke Region. Proceedings of the 26th Annual Meeting ISMRM, Paris, France, 2018.
10. Stoyanova R, Huang K, Sandler K, et al. Mapping tumor hypoxia in vivo using pattern recognition of dynamic contrast-enhanced MRI data. Translational oncology. 2012;5(6):437-IN2.
11. Han S, Stoyanova R, Lee H, et al. Automation of pattern recognition analysis of dynamic contrast‐enhanced MRI data to characterize intratumoral vascular heterogeneity. Magnetic resonance in medicine. 2018;79(3):1736-44.
12. Jang MJ, Jin SH, Kang MS, et al. Directional Intravoxel Incoherent Motion (IVIM) MR in Rodent Brain. Proceedings of the 26th Annual Meeting ISMRM, Montreal, QC, Canada, 2019.
Figures