4374
Introduction of matrix analysis for hybrid multidimensional prostate diffusion-weighted and T2-weighted imaging1Radiology, The University of Chicago, Chicago, IL, United States
Synopsis
We present a new concept based on matrix analysis for analyzing hybrid multi-dimensional T2-weighted and diffusion-weighted MRI of the prostate. This study evaluates whether matrix analysis is useful in diagnosis of prostate cancer. The hybrid data were linearized first by taking natural logarithms. Then the hybrid symmetric matrix was formed by multiplying by its own transpose matrix for each pixel. The eigenvalues and eigenvectors are calculated for this symmetric matrix to generate color maps. The preliminary results suggest that the combined color eigenvalue map provides new information that could help to identify and stage prostate cancer.
INTRODUCTION
Multi-parametric magnetic resonance imaging (mpMRI) is used clinically for detecting and grading prostate cancer (PCa). T2-weighted (T2W) imaging and diffusion-weighted imaging (DWI) are two main components of mpMRI. In conventional mpMRI, T2W imaging and DWI are acquired and analyzed independently to produce T2 maps and apparent diffusion coefficient (ADC) maps. We introduced the use of hybrid multi-dimensional MRI (HM-MRI; combined T2W imaging and DWI) to improve diagnosis of PCa [1]. HM-MRI data are acquired for all combinations of three to four echo times (TEs) and b-values, to produce a 3×3 or larger matrix associated with each image voxel. HM-MRI data had been analyzed based on changes in ADC and T2 as a function of TE and b-value, respectively [2], or using compartmental analysis to determine tissue volume fractions of stroma, epithelium, and lumen [3].In this study, we treated HM-MRI data as a matrix, and solved for the eigenvalues and eigenvectors for each voxel. We investigated whether matrix analysis of HM-MRI data is feasible and has potential to improve diagnosis of PCa.
THEORY and METHODS
HM-MRI data are acquired with M different b-values and N different TEs. Then for each pixel there is an M×N real matrix –‘A’. We define $$${\bf{H}}=\ln{\bf{A}}\times(\ln{\bf{A}})^T$$$ or $$${\bf{H}}=(\ln{\bf{A}})^T\times\ln{\bf{A}}$$$ with each element containing the natural logarithm of the corresponding element of A. We take the logarithm to linearize the data because the signal is exponentially dependent on both TEs and b-values. For this real symmetric non-negative definite matrix H, we calculate eigenvalues (λ1>λ2>λ3>…) and eigenvectors (e1, e2, e3,…) using MATLAB. For each slice, eigenvalues and component eigenvectors are used to generate maps for detection and evaluation of prostate cancers.As an example of this matrix analysis method, let’s assume HM-MRI data acquired with only two b-values for each of two TEs. Then for each pixel, there is a matrix (A2×2) data associated with different b-values and different TEs, i.e.,
$${\bf{A_{2\times2}}}=\begin{bmatrix}a_{11}&a_{12}\\a_{21}&a_{22}\end{bmatrix}=\begin{bmatrix}A_1e^{-TE_1/T_2}\cdot e^{-b_1D}&A_1e^{-TE_1/T_2}\cdot e^{-b_2D}\\A_2e^{-TE_2/T_2}\cdot e^{-b_1D}&A_2e^{-TE_2/T_2}\cdot e^{-b_2D}\end{bmatrix},------(1)$$
where Ai(i=1, 2) is a proportionality constant, T2 is the transverse relaxation time, and D is the ADC. The following symmetric hybrid matrix can be obtained:
$${\bf{H_{2\times2}}}=\ln{\bf{A}}\times(\ln{\bf{A}})^T=\begin{bmatrix}(\ln{a_{11})}^2+(\ln{a_{12})}^2&\ln{a_{11}}\ln{a_{21}}+\ln{a_{12}}\ln{a_{22}}\\ \ln{a_{11}}\ln{a_{21}}+\ln{a_{12}}\ln{a_{22}}&(\ln{a_{21})}^2+(\ln{a_{22})}^2\end{bmatrix},------(2)$$
The eigenvalues and eigenvectors of matrix H2×2 can be easily calculated numerically, which avoids the need for curve-fitting.
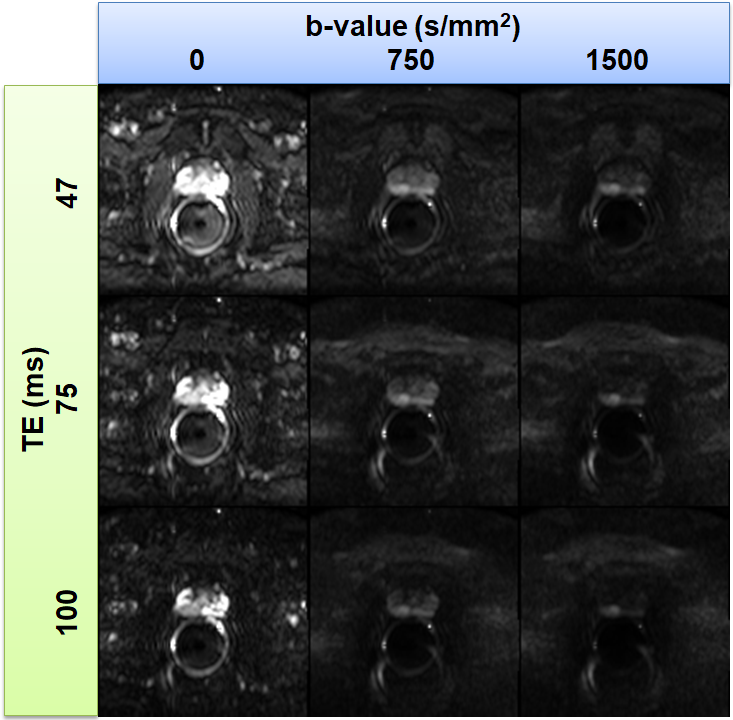
Six patients with previous histologically confirmed prostate cancer underwent IRB approved preoperative HM-MRI on a Philips Achieva 3T-TX scanner. The hybrid protocol was composed of a single spin echo module with diffusion sensitizing gradients placed symmetrically around the 180 degree pulse, followed by single-shot EPI read-out. HM-MRI data were acquired with three or four TEs between 47 - 200 ms. For each TE, we acquired images with three or four b-values between 0 - 1500 s/mm2 (TR=3500 ms, field of view=180×180 mm2, matrix size=72×72, reconstruction matrix=128×128, slice thickness=3 mm). The acquisition time was 12-15 minutes.
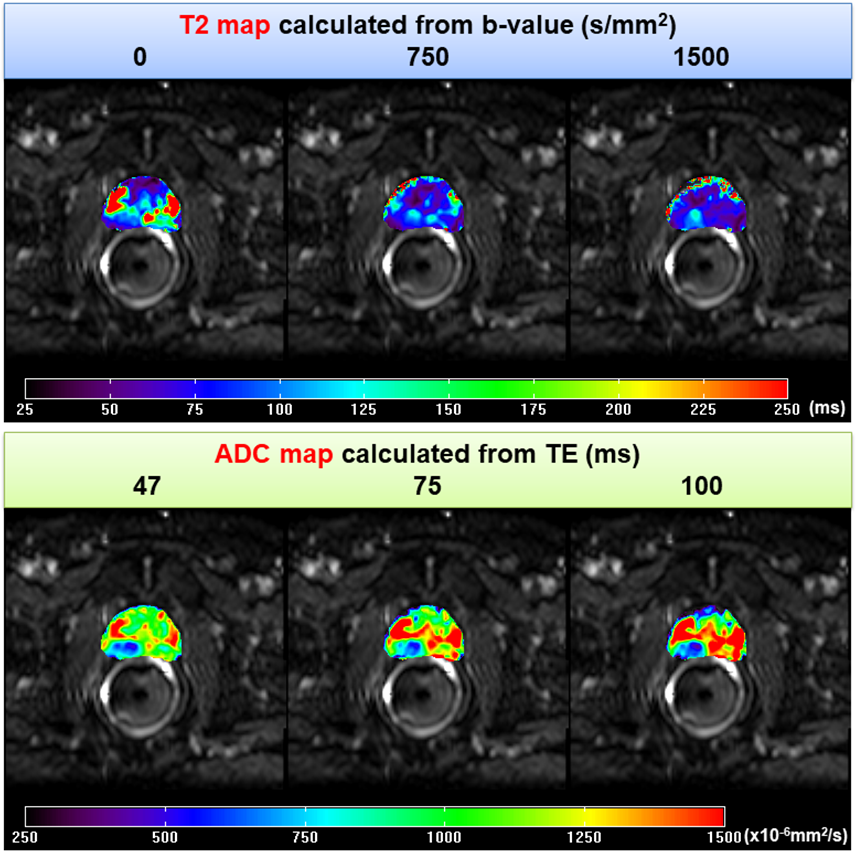
The matrix analysis results were qualitatively compared with T2 maps (for each TE) and ADC maps (for each b-value) calculated from HM-MRI data.
RESULTS
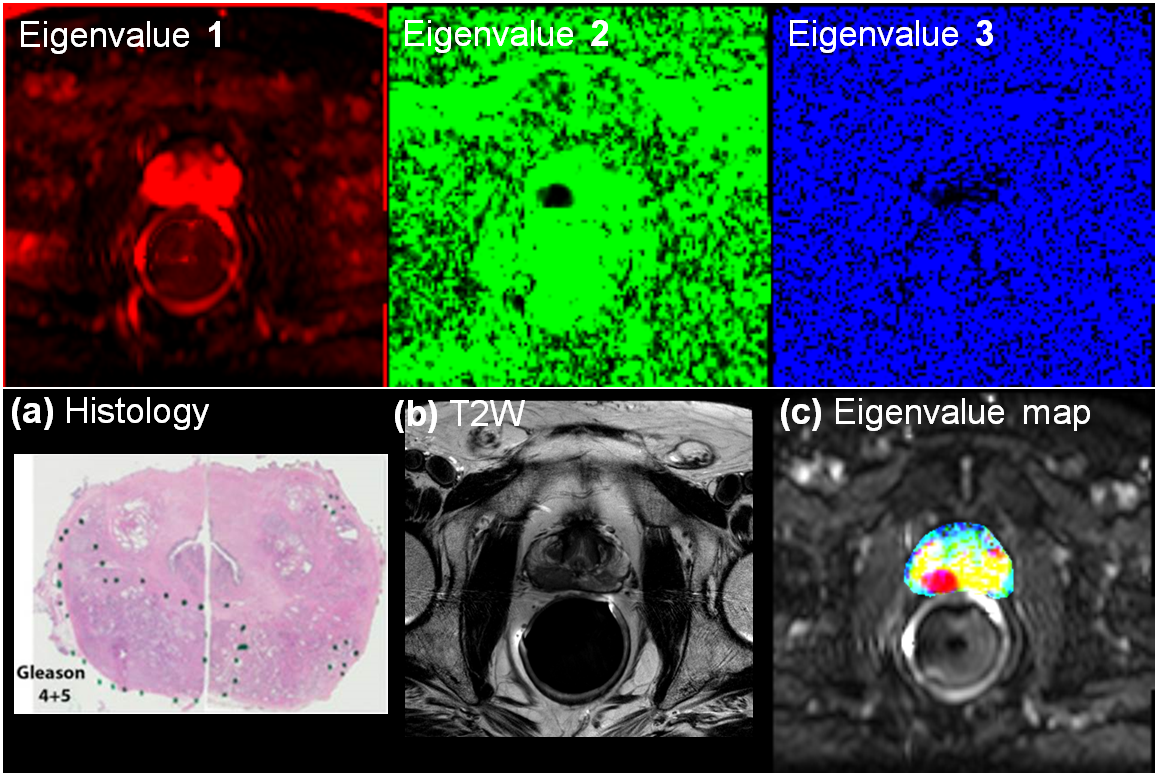
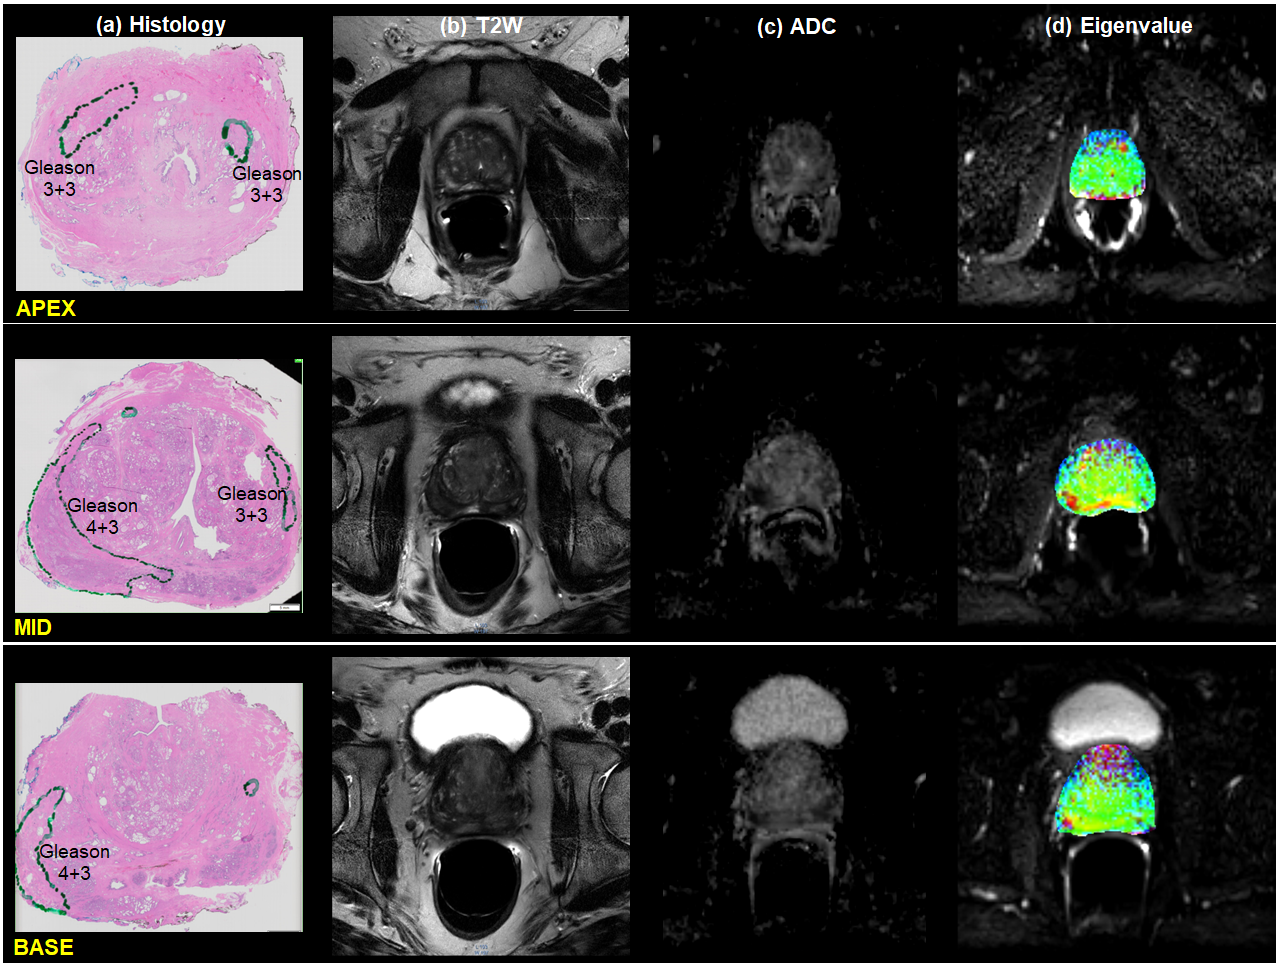
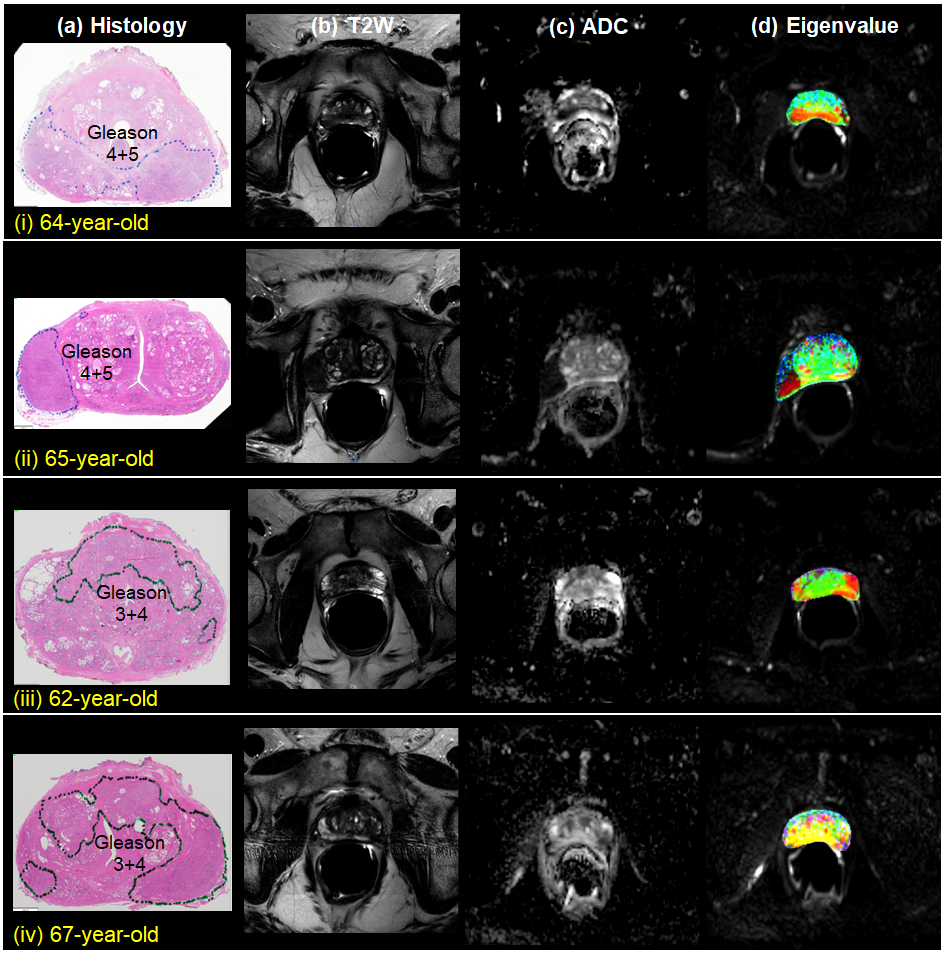
For a selected MRI slice from 60-year-old patient, Figure 1 shows an example of HM-MR images with three b-values for each of three TEs used for matrix analysis. Figure 2 shows corresponding ADC and T2 maps calculated from the hybrid data superimposed on the HM-MR image with shortest TE and 0 b-value. Changes in ADC as a function of ‘TE’, and in T2 as a function of ‘b-value’ are evident. Figure 3 top row shows corresponding three eigenvalues maps calculated by our matrix analysis technique: eigenvalue 1 (red), eigenvalue 2 (green), and eigenvalue 3 (blue). Figure 3 bottom row shows: (a) whole-mount histology, (b) high resolution T2W image, and (c) combination of all three eigenvalues maps with red regions indicating cancers. The combination eigenvalue map (Figure 3c) shows the cancers clearly, and is very different from the ADC and T2 maps (Fig. 2) - suggesting that the matrix analysis is providing new and useful information.Figure 4 shows another example of matrix analysis for 62-year-old patient with three slices near: apex, mid and base of prostate, which demonstrated that combination eigenvalue maps shows cancer in multi-slice. Finally, Figure 5 shows matrix analysis results for four more patients. All these results demonstrated that matrix analysis could aid in diagnosis of PCa.
DISCUSSION
The matrix analysis technique for HM-MRI data is easy to apply and use clinically. Preliminary results discussed here suggest that prostate cancer can be seen clearly on eigenvalues maps and the eigenvalue maps are clearly different from ADC maps and T2 maps calculated from hybrid data. Potential advantages of matrix analysis for hybrid data include: (i) a symmetric hybrid matrix (H) can be generated even if the acquired HM-MRI matrix is not square; (ii) eigenvalues and eigenvectors can be quickly calculated; (iii) maps generated with eigenvalues reflect the tissue properties associated with T2 and ADC, but efficiently combine all HM-MRI data – potentially leading to improvements in diagnostic efficacy. Evaluation of more hybrid data is needed to determine whether matrix analysis compliments, or is more effective than other techniques for analyzing HM-MRI data.CONCLUSION
Matrix analysis provides a new and promising way to analyze HM-MRI data. Eigenvalues maps can assist in diagnosis of cancer.Acknowledgements
This research is supported by National Institutes of Health (R01CA218700, U01CA142565, R01CA172801 and S10OD018448.).References
[1] Wang S, Peng Y, Medved M, Yousuf AN, Ivancevic MK, Karademir I, Jiang Y, Antic T, Sammet S, Oto A, Karczmar GS. Hybrid multidimensional T(2) and diffusion-weighted MRI for prostate cancer detection. J Magn Reson Imaging. 2014; 39(4):781-8.
[2] Sadinski M, Karczmar G, Peng Y, Wang S, Jiang Y, Medved M, Yousuf A, Antic T, Oto A. Pilot Study of the Use of Hybrid Multidimensional T2-Weighted Imaging-DWI for the Diagnosis of Prostate Cancer and Evaluation of Gleason Score. AJR Am J Roentgenol. 2016; 207(3):592-8.
[3] Chatterjee A, Bourne RM, Wang S, Devaraj A, Gallan AJ, Antic T, Karczmar GS, Oto A. Diagnosis of Prostate Cancer with Noninvasive Estimation of Prostate Tissue Composition by Using Hybrid Multidimensional MR Imaging: A Feasibility Study. Radiology. 2018; 287(3):864-873.
Figures