4358
Towards individual direction-based deep learning of diffusion weighted images for standard diffusion model analysis.1Department of Radiology, New York University School of Medicine, New York, NY, United States
Synopsis
In diffusion MRI, a higher number of gradient directions benefit to SNR and robustness of fiber rotational invariant estimation for tensor computation, however, it makes the acquisition time to lengthy to be clinically viable. This study was to apply a deep learning approach to generate new individual direction diffusion weighted (DW) source images (e.g., 60 more directions) from original 30 direction DW images based on high-angular-resolution (90 directions) dataset. Such an approach not only significantly reduce the scan time using one-third original DW images, but also be able to compute dMRI-derived parametric maps using a standard tensor model.
Introduction
Diffusion MRI (dMRI) is a powerful tool for producing multiple specific quantitative micro-scale metrics for evaluation of white matter integrity and pathways1. It often requires a large number of gradient directions to produce better estimates of microstructural differences with better SNR, while it also requires lengthy acquisition time too long to be clinically viable. Recently, deep learning-based algorithms have been proposed to overcome this limitation. Studies have shown that the fractional anisotropy (FA) maps can be directly predicted from raw diffusion weight (DW) images using convolutional neural networks by omitting the standard tensor computation model2,3. In this study, we proposed to generate individual direction-based deep learning method to generate new direction (e.g, n=60) DW source images using the existing partial-direction (e.g. n=30) DW images from full high-angular-resolution (ie. n=90) Human Connectome dataset. The purpose was to not only significantly reduce the scan time using one-third original DW images, but also be able to compute any dMRI-derived parametric maps using standard tensor model.Methods
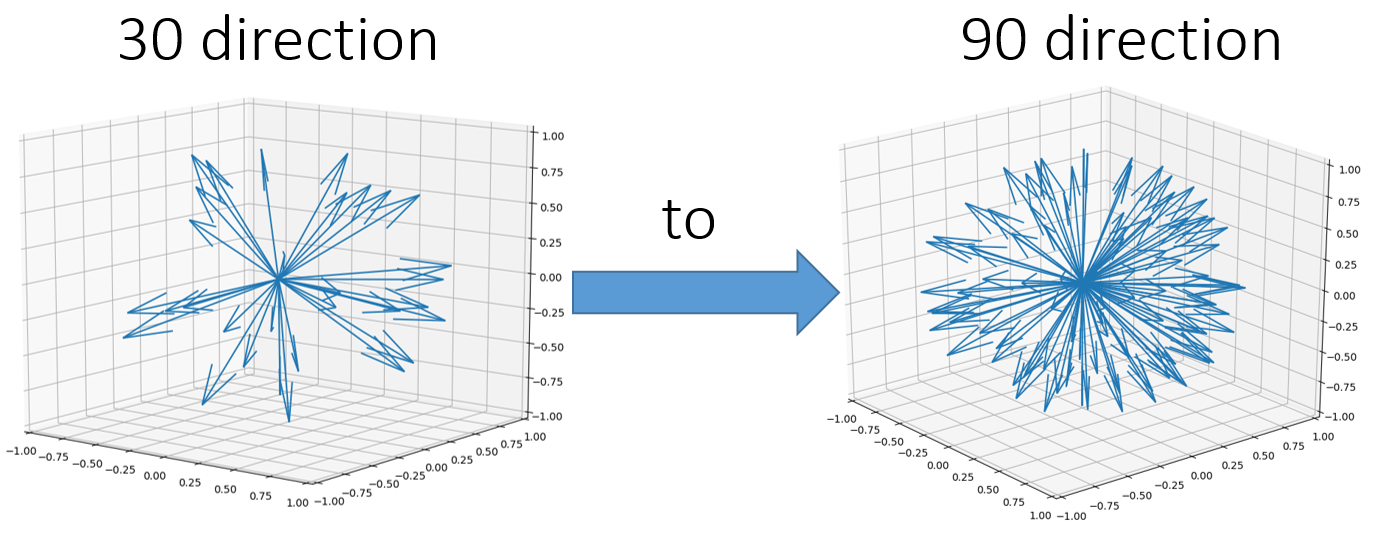
Proof of concept: The neural network algorithms in this study used a large number of DW images with different encoding directions at each pixel as input. Typically the encoding sets with angular sampling are uniquely and uniformly distributed and are known, which allows us to use partial number of direction data to predict the rest full direction data, as a form of linear combination with appropriate weights. As shown in Figure 1, we used 30 out of 90-direction data to individually learn each of the additional 60-direction DW data.Data: Data was extracted from the Human Connectome Project (WU-Minn HCP)4. The protocol parameters were TR/TE=5520/89.5ms; 1.25mm isotropic voxels. 149 subjects’ diffusion data with b value of 1000 were extracted for this study. Slice each subject image volume to 2D slices with the resolution of 144x144x90 (X,Y,directions). It resulted in 1710 training images, 793 testing images, and 854 images for validation.
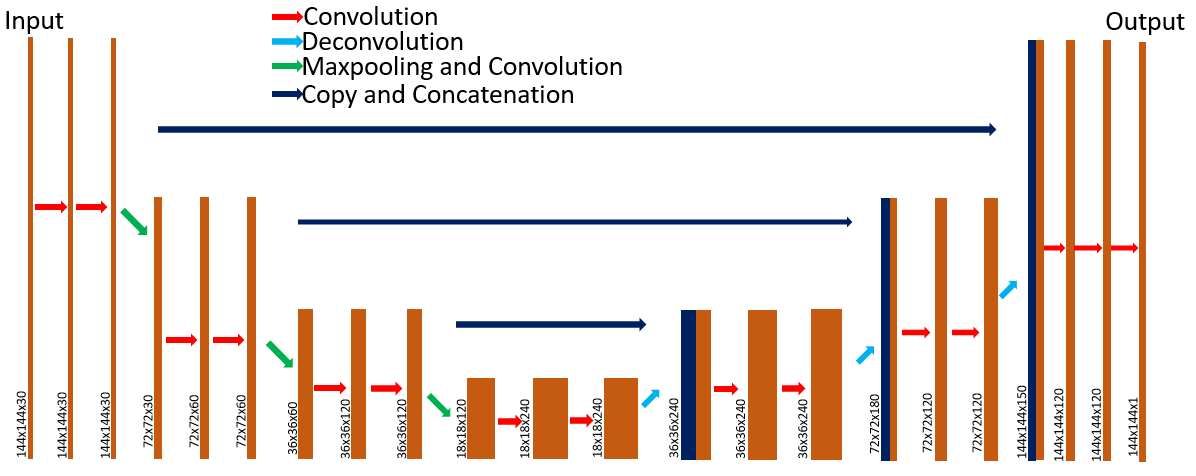
Model: As shown in Figure 2, a modified version of U-net5 was applied to generate a specific direction of DW images with the first 30 directions DW images as input data. 60 models were trained individually for each additional direction in parallel, in the high performance computing cluster (Skynet from NYULMC), with the same architecture, same input, but different direction ground truth. The training was run with SGD optimizer, batch size of 256, loss of 0.001, decay of 0.001, epoch number of 400.
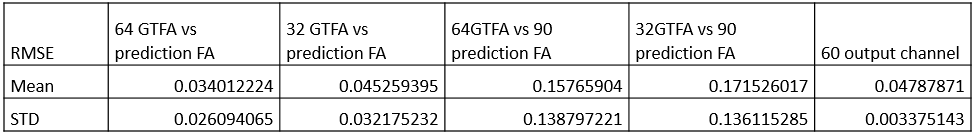
For FA comparison, the last 32 directions are selected from 60 model outputs; combine with 30 input and 2 extra channels that contain b value of 5 to generate prediction FA. While the 64 channels ground truth FA used 62 directions of DWI with 2 extra direction with b value of 5; 32 channels ground truth FA used 30 directions of DWI with 2 low b value directions. The RMSE value is compared with 11 subject results among 64 directions GTFA with prediction FA, 32 directions GTFA with prediction FA, Results are shown in Table 1. MRtrix3 toolbox6 was used to generate all the mappings.
Results
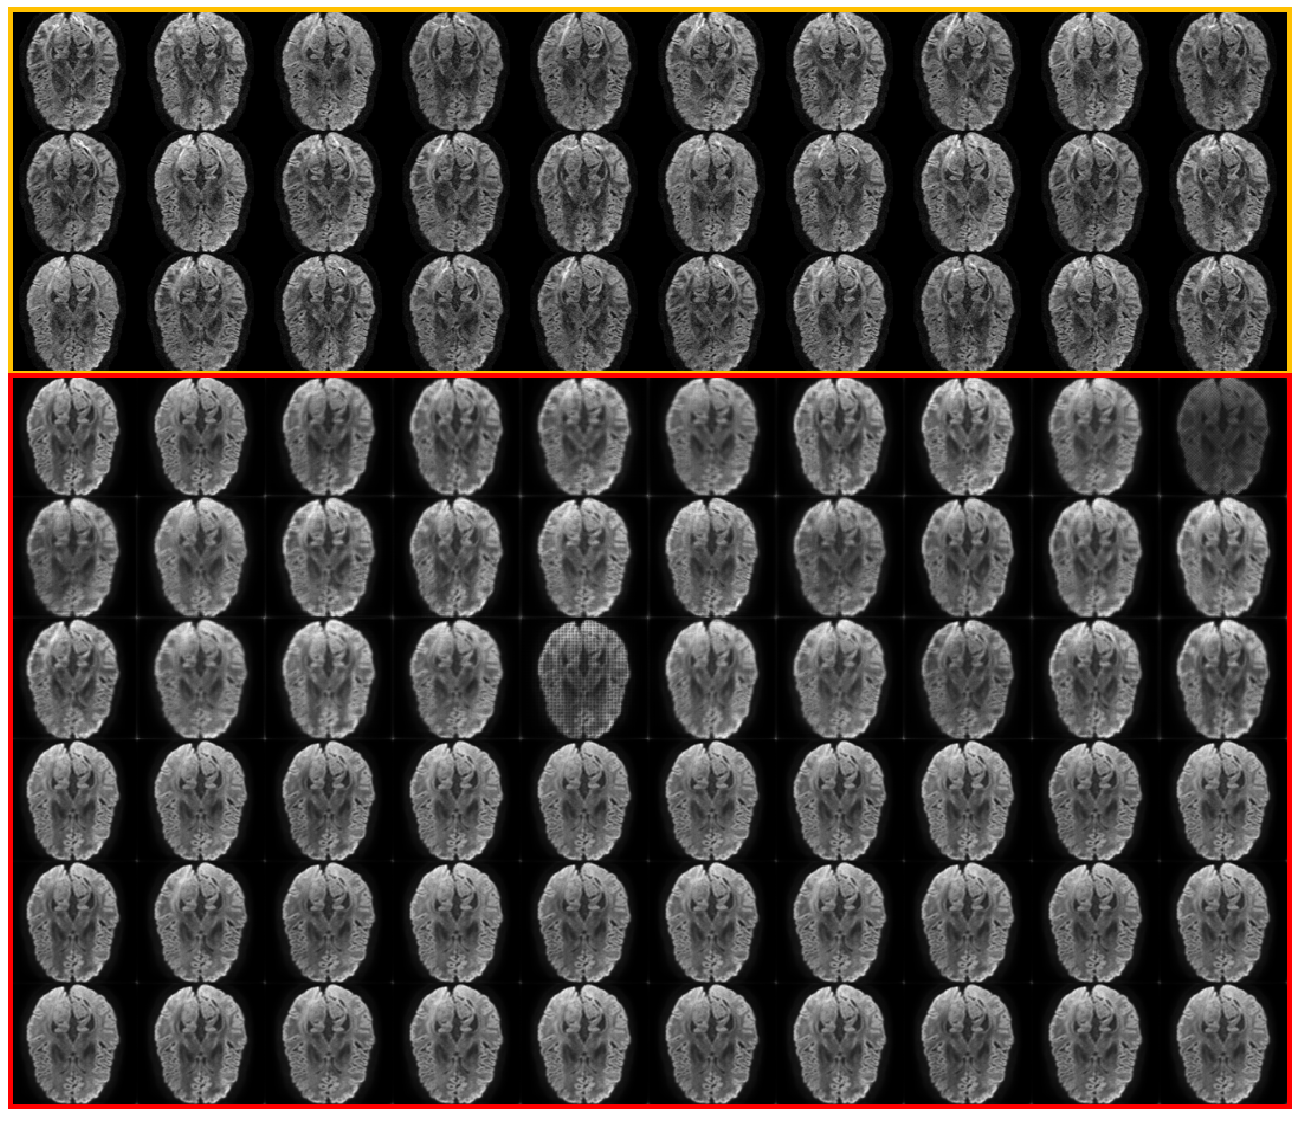
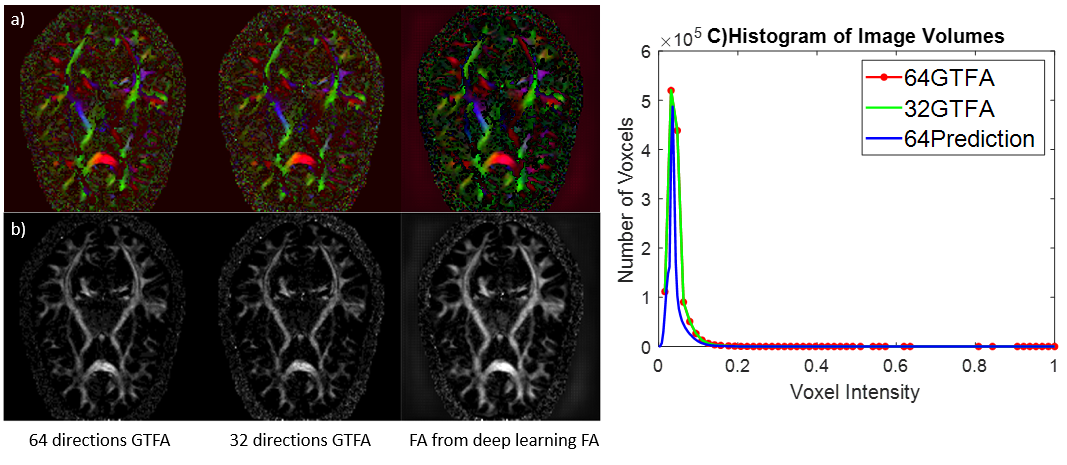
Sample input DW images and model outputs are shown in figure 3.We tested the test set ground truth vs the model output, as well as the Fractional Anisotropy map generated from ground truth data vs FA map generated from the model output. By directly compare 600 testing output slices versus corresponding ground truth for all directions, the difference yield mean RMSE of 0.048 with a standard deviation of 0.00338 (Table 1). FA maps are also generated with the help of our model. With mean RMSE of 0.03 compare against 64 GTFA, mean RMSE of 0.04 compare against 32 GTFA(Table 1). The colored FA maps indicate that our deep learning model can help the conventional tool generate better quality FA maps than using only 32 directions(Figure 4a) that contains higher signal. Figure 4 c) shows the histogram of the image volume which contains 61 slices of FA maps. It shows an overlap between ground truth results and model-assisted results.Discussion
From information theory7, it might be true that the limited number of the direction of DWI contains certain information for more directions. We demonstrated how that information could be extracted by using 60 individual models. Unlike previously described method2, which has a drawback that each parametric map has to be trained separately with potential uncertainty and unclear mechanism of neural network for tensor computation from this direct endpoint learning, our deep learning approach was to generate raw DW images without skipping the conventional tensor model. However, compared to our individual-direction models, using one much larger model to produce 60 directions altogether is also possible but needs high performance computing setup. Further future work will also be explored to use more known directions (e.g., from 30 to 60 direction) to predict less unknown directions, which should provide more robust results due to more input information.Conclusion
The resultant learning based models can be applied to generate more directions of DWI to produce a comparable FA map with using ground truth data. It can potentially reduce the acquisition time of the DWI process, by 3 folds in our case.Acknowledgements
This study was funded by National Institute of Health (NIH) grant R01 EN025133 02S1 and R01 EB025133 02References
1. Neumann-Haefelin, Tobias, et al. "Diffusion-and perfusion-weighted MRI: the DWI/PWI mismatch region in acute stroke." Stroke 30.8 (1999): 1591-1597.
2. Koppers S, Merhof D. Direct estimation of Fiber orientations using deep learning in diffusion imaging. Cham: Springer; 2016. p. 53–60.
3. Golkov, Vladimir, et al. "Q-space deep learning: twelve-fold shorter and model-free diffusion MRI scans." IEEE transactions on medical imaging 35.5 (2016): 1344-1351.
4. Yeh, Fang-Cheng, et al. "Population-averaged atlas of the macroscale human structural connectome and its network topology." NeuroImage 178 (2018): 57-68.Yeh, Fang-Cheng, et al. "Population-averaged atlas of the macroscale human structural connectome and its network topology." NeuroImage 178 (2018): 57-68.
5. Ronneberger, Olaf, Philipp Fischer, and Thomas Brox. "U-net: Convolutional networks for biomedical image segmentation." International Conference on Medical image computing and computer-assisted intervention. Springer, Cham, 2015.
6. Tournier, J‐Donald, Fernando Calamante, and Alan Connelly. "MRtrix: diffusion tractography in crossing fiber regions." International journal of imaging systems and technology 22.1 (2012): 53-66.
7. Tishby, Naftali, and Noga Zaslavsky. "Deep learning and the information bottleneck principle." 2015 IEEE Information Theory Workshop (ITW). IEEE, 2015.
Figures