4355
Use of 2D image registration parameters for correction of eddy-current magnetization-density ADC errors in presence of gradient nonlinearity1University of Michigan Hospitals, Ann Arbor, MI, United States
Synopsis
Systematic errors confound wide-spread clinical use of apparent diffusion coefficient (ADC) for diagnostic and prognostic applications. Standard clinical diffusion sequences using single-spin-echo echo-planner-imaging are susceptible to gradient channel-specific eddy-currents for b>0 inducing distortions of voxel magnetization-density (MD), as well as geometric distortion. Unlike geometric distortion that are largely correctable by image registration to b=0, persisting signal amplitude distortions lead to systematic spatially-dependent errors mimicking, but physically distinct from, non-uniform diffusion weighting induced by gradient nonlinearity (GNL). This study proposes the use of geometric distortion parameters derived from in-plane image registration for MD correction of ADC in presence of GNL.
Introduction
Longitudinal evaluation of spatially-dependent DW bias for individual gradient channels relative to vendor-provided gradient nonlinearity (GNL) models [1] have shown persisting errors due to eddy-currents (EC) evident on representative clinical scanners. These apparent distortions would produce negligible DW-weighting bias [2], but result in channel-specific spatially-dependent magnetization-density (MD) scaling errors [3]. These errors mimic DW non-uniformity bias in derived ADC maps, and are not corrected by geometric distortion unwarping [4]. This study illustrates the use of geometric transformation parameters from DWI registration to b=0 for ADC correction of EC-MD errors (ECC) in addition to GNL correction (GNC).Methods
A long-tube ice-water phantom was oriented along superior-inferior (SI) direction and scanned on a clinical 3T system using standard single-spin-echo (SSE) single-shot (SS) echo-planar-imaging (EPI) acquisition of DWI gradients along primary magnet axes (GRL, GAP, GSI) for b=0 and 1000 s/mm2. Two axial scans were performed for 4mm and 8mm thick slices to derive through-plane dephasing scale-factor, K∅, implicitly related to in-plane shift in the phase-encode direction. Gradient-channel specific in-plane co-registration of b>0 to b=0 was performed using Elastix [5] to derive slice-by-slice 2D affine transform parameters (Figure 1) and their analytical fit as a function of SI-offset (Figure 2). These parameters were used for calculation of corresponding EC correction factors, Ce (Fig. 2) [3] to mitigate MD-bias (Fig.1, Eq.[2]:ECC) K∅ = 34°/mm, was derived empirically from linear fit of intra-slice dephasing difference between 4mm and 8mm slices (Fig.2c). System GNL tensor, L, [6] was constructed by numerical differentiation of channel-specific gradient fields modeled using vendor-provided spherical harmonics (SPH) design information. Direction-specific GNL corrector maps, Cb(r) = Tr(LukLukT) [7] were then constructed for acquired DWI gradients, uk, to mitigate b-value bias (Fig.1 Eq[2]: GNC). ADC was fit using mono-exponential model (Fig.1, Eq[1]). Direction-specific ADC correction was performed using Eq.3 (Fig.1). The effect of correction was quantified from ADC mean and SD values for 1cm ROIs (Fig.1b) placed along the phantom tube. All data analysis was performed in Matlab R2015b (Mathworks, Natick, MA).Results and Discussion
Substantial EC-induced distortions (Fig.1a) were corrected by 2D image registration (Fig.1c). The highest degree of offset dependent variation was observed for vertical scaling 2D affine parameter, “D”, on GAP (Fig.2a), shear, “C”, on GRL(not shown), and vertical shift, “F”, on GSI. Other co-registration parameter variations were 10-fold lower (not shown). The F parameter dependence on Z (Fig.2a,b) was the same for 4mm and 8mm slices. Co-registration did not mitigate EC-induced ADC bias: (in addition to GNL, Fig.1a, solid lines) negative for GAP and positive for GSI (Figure 3a), consistent with MD nature (Fig.1b, Eq.[2]). EC-induced D and F resulted in additional MDs on the corresponding gradient channels (Fig.2a,b) consistent with ECC models (Fig.3a, dashed). Shear, C, produced no apparent MD for GRL (Fig.3a) and did not require correction beyond GNC (Fig.3b). The proposed GNC+ECC correction fully mitigates observed gradient-channel specific ADC bias (Fig.3c), restoring Z-independent ice-water ADC values within the measurement confidence intervals.In contrast to GNC spatially-varying across the slices, ECC model is presumed constant for each slice, determined by single co-registration parameter (Fig.2a,b). Positive EC GSI through-slice dephasing bias partially compensated negative GAP MD scaling bias at 4mm (Fig.3b), and completely supersedes GNL bias at 8mm slice thickness (not shown). This property can be used to empirically mitigate for EC bias in average (trace) ADC across channels by varying acquired slice thickness. In practice, the GSI through-slice dephasing factor, K∅, can be determined empirically, as described here. Once calibrated and fit for a phantom, the coupled product, K∅ dF/dz (Fig.2b,c) should be preserved for similar b-values and TE, and Ce(GSI) will only change with slice thickness. Only D parameter remains scan-dependent, and needs to be obtained from scan-specific image registration.
Summary
EC contribution to ADC bias distinct from GNL was quantified using an ice-water phantom. Consistent model was proposed to correct for EC-induced errors in MD using slice-by-slice image registration parameters. Combined ECC (MD correction) and GNC (DW correction) fully mitigated phantom ADC errors for individual DWI gradient channels. The proposed semi-empiric correction provides practical solution for application on clinical scanners.Acknowledgements
Support: National Institutes of Health Grants: R01CA190299, U01-CA166104, U24-CA237683.References
1. Malyarenko, D., et al. Quantifying deviations from gradient design in multi-platform longitudinal DWI QC for on-scanner correction of diffusion weighting bias. in ISMRM'26 Proceedings; TP1645. 2018. Paris FR.
2. Malyarenko, D.I., et al., Demonstration of nonlinearity bias in the measurement of the apparent diffusion coefficient in multicenter trials. Magn Reson Med, 2016. 75(3): p. 1312-23.
3. Rohde, G.K., et al., Comprehensive approach for correction of motion and distortion in diffusion-weighted MRI. Magn Reson Med, 2004. 51(1): p. 103-14.
4. Haselgrove, J.C. and J.R. Moore, Correction for distortion of echo-planar images used to calculate the apparent diffusion coefficient. Magn Reson Med, 1996. 36(6): p. 960-4.
5. Klein, S., et al., elastix: a toolbox for intensity-based medical image registration. IEEE Trans Med Imaging, 2010. 29(1): p. 196-205.
6. Bammer, R., et al., Analysis and generalized correction of the effect of spatial gradient field distortions in diffusion-weighted imaging. Magn Reson Med, 2003. 50(3): p. 560-9.
7. Malyarenko, D.I., B.D. Ross, and T.L. Chenevert, Analysis and correction of gradient nonlinearity bias in apparent diffusion coefficient measurements. Magn Reson Med, 2014. 71(3): p. 1312-23.
Figures
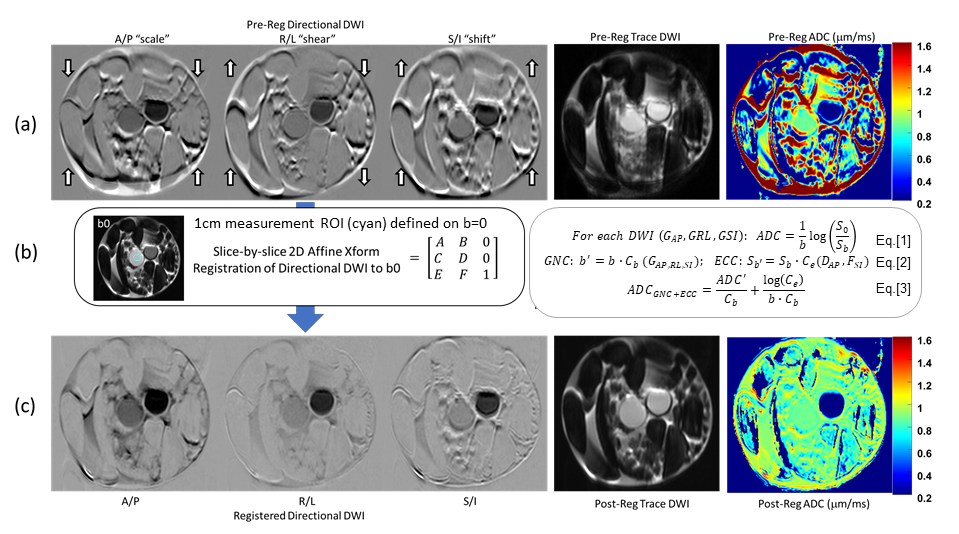
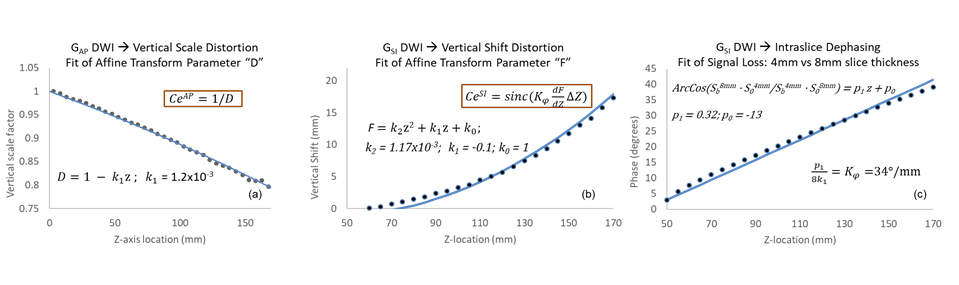
Figure 2: Affine registration parameter dependence on slice location for ice-water phantom is shown in (a) and (b) for AP and SI DWI gradients, respectively, with dominant intensity-scaling effects. (c) shows additional fit for though-plane SI dephasing difference between 4mm and 8mm thick-slices to derive Kf proportionality factor for EC-induced F-shift. The corresponding fit functions and coefficients are listed in the legends. Boxed formulas show parameter relation to eddy current correction factors (Fig.1,Eq.[2]).
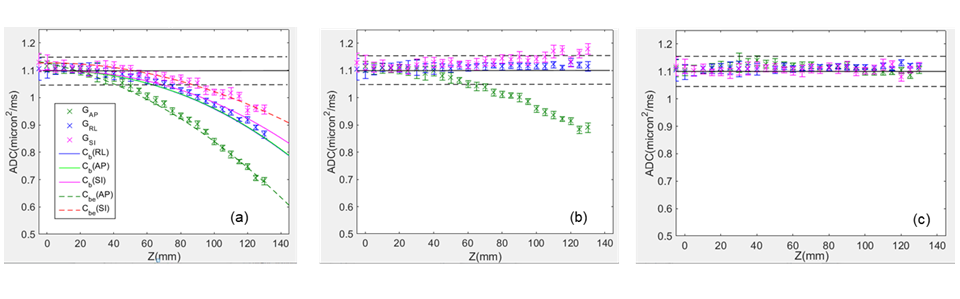
Figure 3: (a) ADC dependence on slice-location is plotted for individual DWI gradient directions (color-coded in the legend) for measured (symbols), GNL models (solid lines) and EC+GNL models (dashed lines). Note GNL model overlap for GRL and GAP and ECRL. (b) and (c) show results of GNC and combined GNC+ECC corrections, respectively, using corresponding models in (a). Error bars indicate one standard deviation within 1cm measurement ROI defined on b=0 image (Fig.1b). Dashed horizontal lines mark ±5% deviation from true ice-water ADC=1.1mm2/ms (solid horizontal line).