4353
Practical correction of gradient nonlinearity bias for mean diffusion kurtosis model parameters1University of Michigan, Ann Arbor, MI, United States
Synopsis
Quantitative tissue diffusion parameters derived from diffusion weighted imaging (DWI) models hold promise for diagnostic and prognostic clinical oncology applications. System-dependent spatial DW bias due to gradient nonlinearity (GNL) is known confounding factor for quantitative DWI metrics. Improved accuracy and multiplatform reproducibility was previously demonstrated for mono-exponential apparent diffusion coefficient with correction for platform-dependent GNL bias (GNC). Complex tumor microenvironment often exhibits multi-exponential diffusion described by isotropic kurtosis model. This study proposes analytical extension and demonstrates empirical confirmation for GNC of parametric maps derived from diffusion kurtosis model.
INTRODUCTION
Non-uniform diffusion weighting (DW) due to system-specific gradient nonlinearity (GNL)1,2 for off-center anatomy3,4 has been a major confounding factor for accuracy and reproducibility of mono-exponential (MEM) apparent diffusion coefficient (ADC) metrics in multi-platform cancer imaging trials3,5. Effective ADC correction of GNL-induced multiplicative DW bias has been demonstrated for tissue of arbitrary anisotropy using orthogonal three-direction DWI acquisition2-4. Comprehensive description of complex tumor microenvironment from DWI6,7 involves non-Gaussian diffusion models8. This study proposes extension of GNL-bias correction (GNC) developed for ADC to quantitative parameters derived from non-Gaussian diffusion kurtosis imaging (DKI) model for orthogonal multi-b acquisition.METHODS
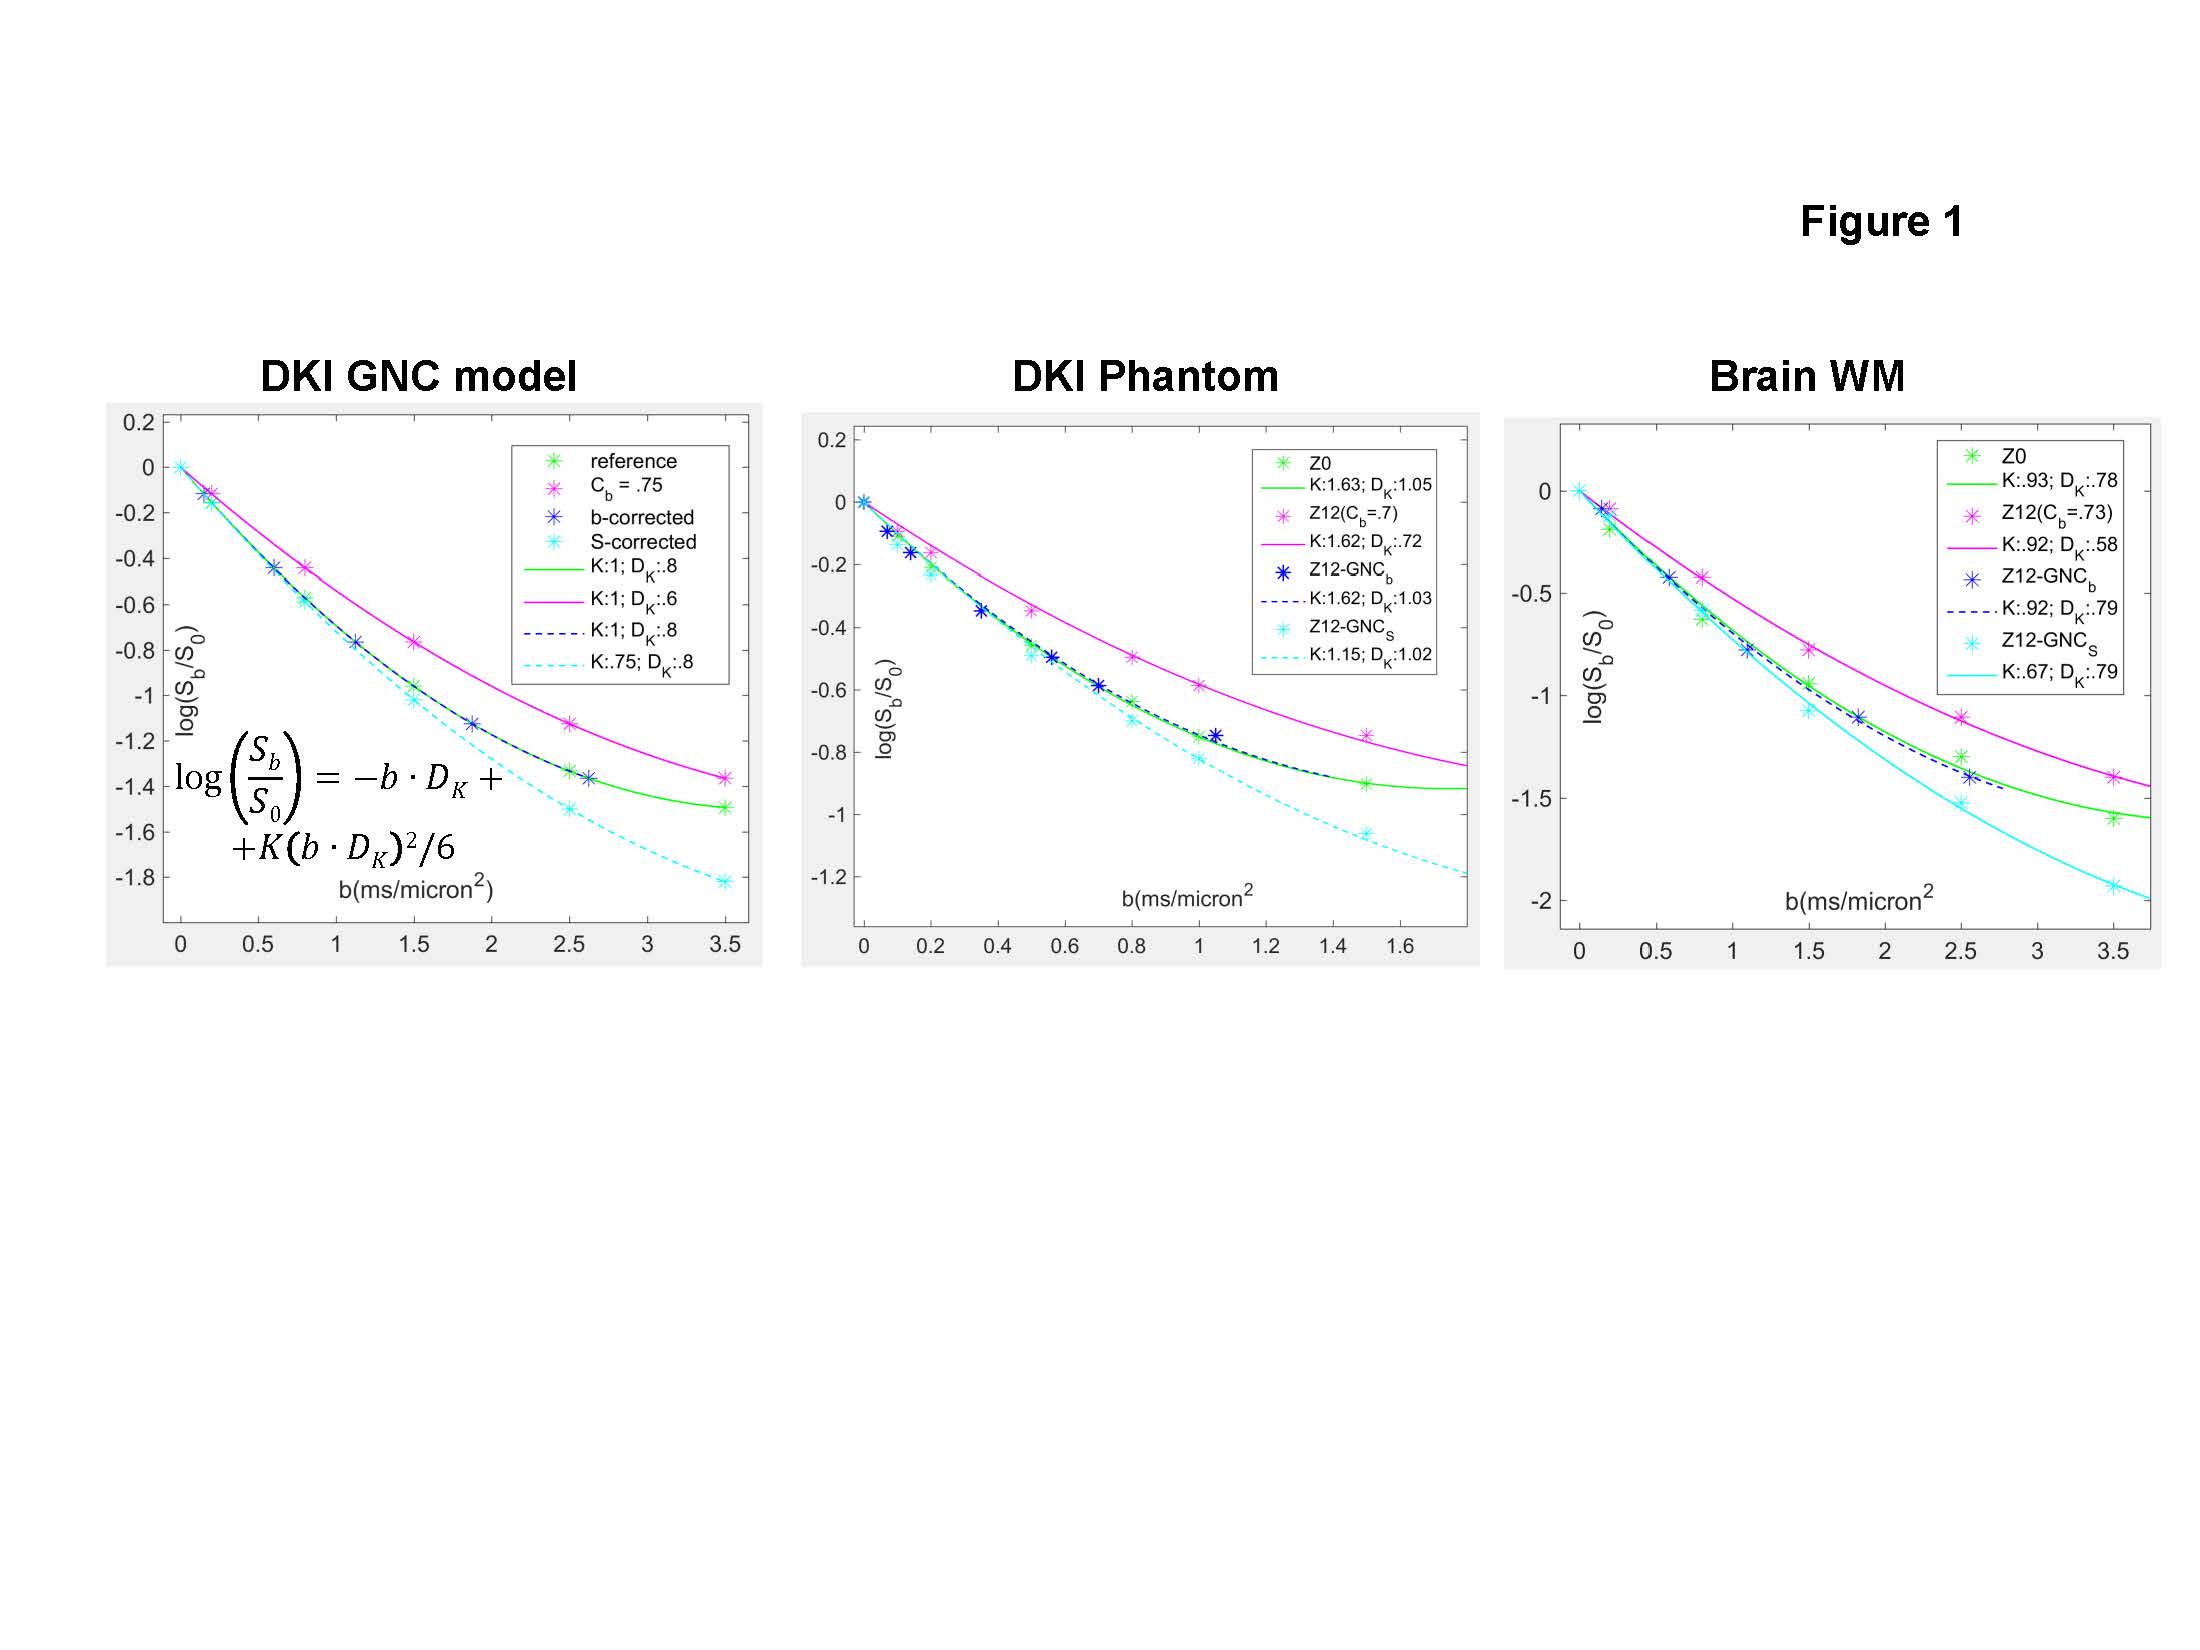
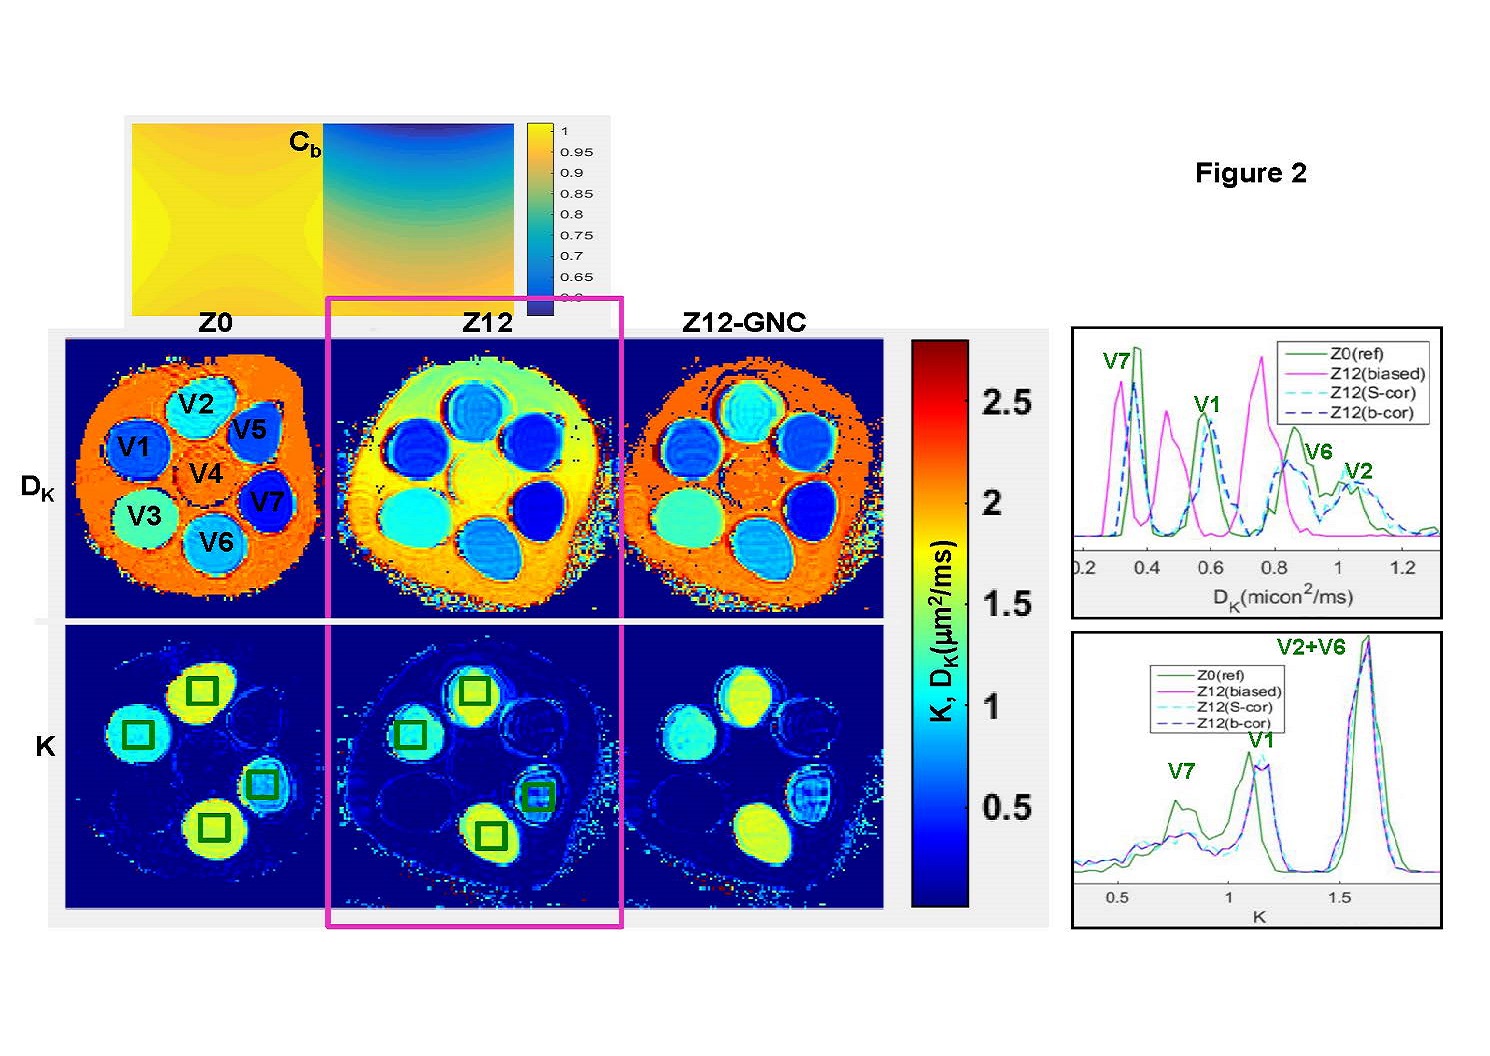
Analytical models: Correction of multiplicative GNL bias, Cb =||b’||/||b||= mean(trace(Luk(Luk)T) (for orthogonal 3-direction, uk, DWI acquisition and system GNL tensor1, L) previously developed for MEM diffusivity2, ADC=ADC’/Cb, was analytically extended for DKI model parameters (Figure 1a): apparent kurtosis, K, and diffusivity, DK.. Practical GNC implementations were compared for vectorized (whole-volume) b-value GNCb, b’=Cb·b, and closed-form MEM DWI-intensity GNCS (Eq.[1])2, Sc=S0(1-1/C)Sb’1/C. Corresponding GNC of DKI parametric maps for biased intensity Sb’-fit parameters, was (Eq.[2]): DK = DK’/Cb, K = K’; and MEM corrected intensity, SC-fit (Eq.[3]): DK = DKc, K = Kc/Cb.Empirical measurements: DKI phantom and volunteer brain were scanned on a clinical 3T system at magnet isocenter (bias-free “Z0” reference, Cb =1) and at 12-13cm superior offset (“Z12”, with finite GNL bias, Cb =0.7-0.75). The DKI phantom9 (Figure 2), included four materials (in vials V1, V2, V6, V7) with K > 0.5, as well as, three MEM, K = 0, diffusion media (V3, V4, V5). Brain white matter (WM) provided in vivo K>0.8 typical of solid tumor environment6,7. The seven 4mm coronal DWI sections of the phantom were scanned over a large FOV = 450mm2 using three orthogonal DWI directions, TR/TE = 5/.152s, 1.5x1.5mm2 voxel, and b = 0, .1, .2, .5, .8, 1, 1.5, 2, 2.5, 3, 3.5 ms/µm2. Same DWI directions and voxel dimensions were used for 25 axial sections of the brain DWI with FOV = 255mm2, TR/TE = 4.5/.106s and b = 0, .2, .8, 1.5, 2.5, 3.5 ms/µm2.
Data analysis: Prior to GNC for brain, all individual DWIb>0 directions were registered to b=0ms/µm2 using Elastix10 to minimize apparent eddy-current and motion artifacts. The 3D b-maps, Cb(r), were generated on the scanner using vendor reconstruction patch11, implementing previously published algorithms2, and exported as DICOM series. Directional DWI intensity correction, GNCS, was performed offline using Eq.[1]2. Parametric DK and K maps were derived using linear least squares fit for voxel log-signal versus b-value (Fig.1), observing DKI model convergence constraint, bmax < 3/(DKK).8 GNC effect on fit DKI parametric maps (Eqs.[2,3]) for Z12 offset location versus Z0 reference was quantified from 3-slice phantom and WM ROI histograms, binned between values of .1 and 2.5 with a bin-step of .03.
RESULTS AND DISCUSSION
Figure 1 shows consistency of analytical prediction (Eqs.[2,3]) for GNL bias (magenta) and correction (blue, cyan) with phantom and brain DKI results. b-value GNCb (Fig.1, dashed blue) overlapped with the reference (green) over reduced b-range (consistent with the Cb=0.7-0.75). The MEM-approximation (Eq.[1]) for GNCS under-estimated DWI for b>1 μs/mm2 (Fig.1, dashed cyan) and effectively “transferred” GNL-bias on to Kc (Fig.1, cyan legend). For biased DWI (Sb’) fit, only diffusivity required (inverse-multiplicative) correction by GNCb, Eq.[2], while K was nominally bias-free (Fig.1, magenta legend). This was reversed for GNCS fit-parameters (Eq.[3], Fig.1, cyan legend).Figure 2 further confirms adequate correction (right) of DKI parametric maps at Z12 offset (middle) compared to Z0 reference (left) using proposed analytical formalism Eqs.[2,3]. As is evident from Z12 Cb-map color-gradient (Fig.2, top), GNL-induced bias changes between .7 and .85 across the coronal phantom map. This leads to apparent loss of DK resolution between V2 and V6 (magenta histograms) compared to reference (green), which is recovered by correction (blue: Eq.[2], cyan: Eq.[3]). In contrast, the close K-values for these phantoms are preserved independent of bias (single K=1.6 magenta histogram peak). Overall, GNC restores mean DK and K values to within 3% of the reference for DKI phantom spectrum.
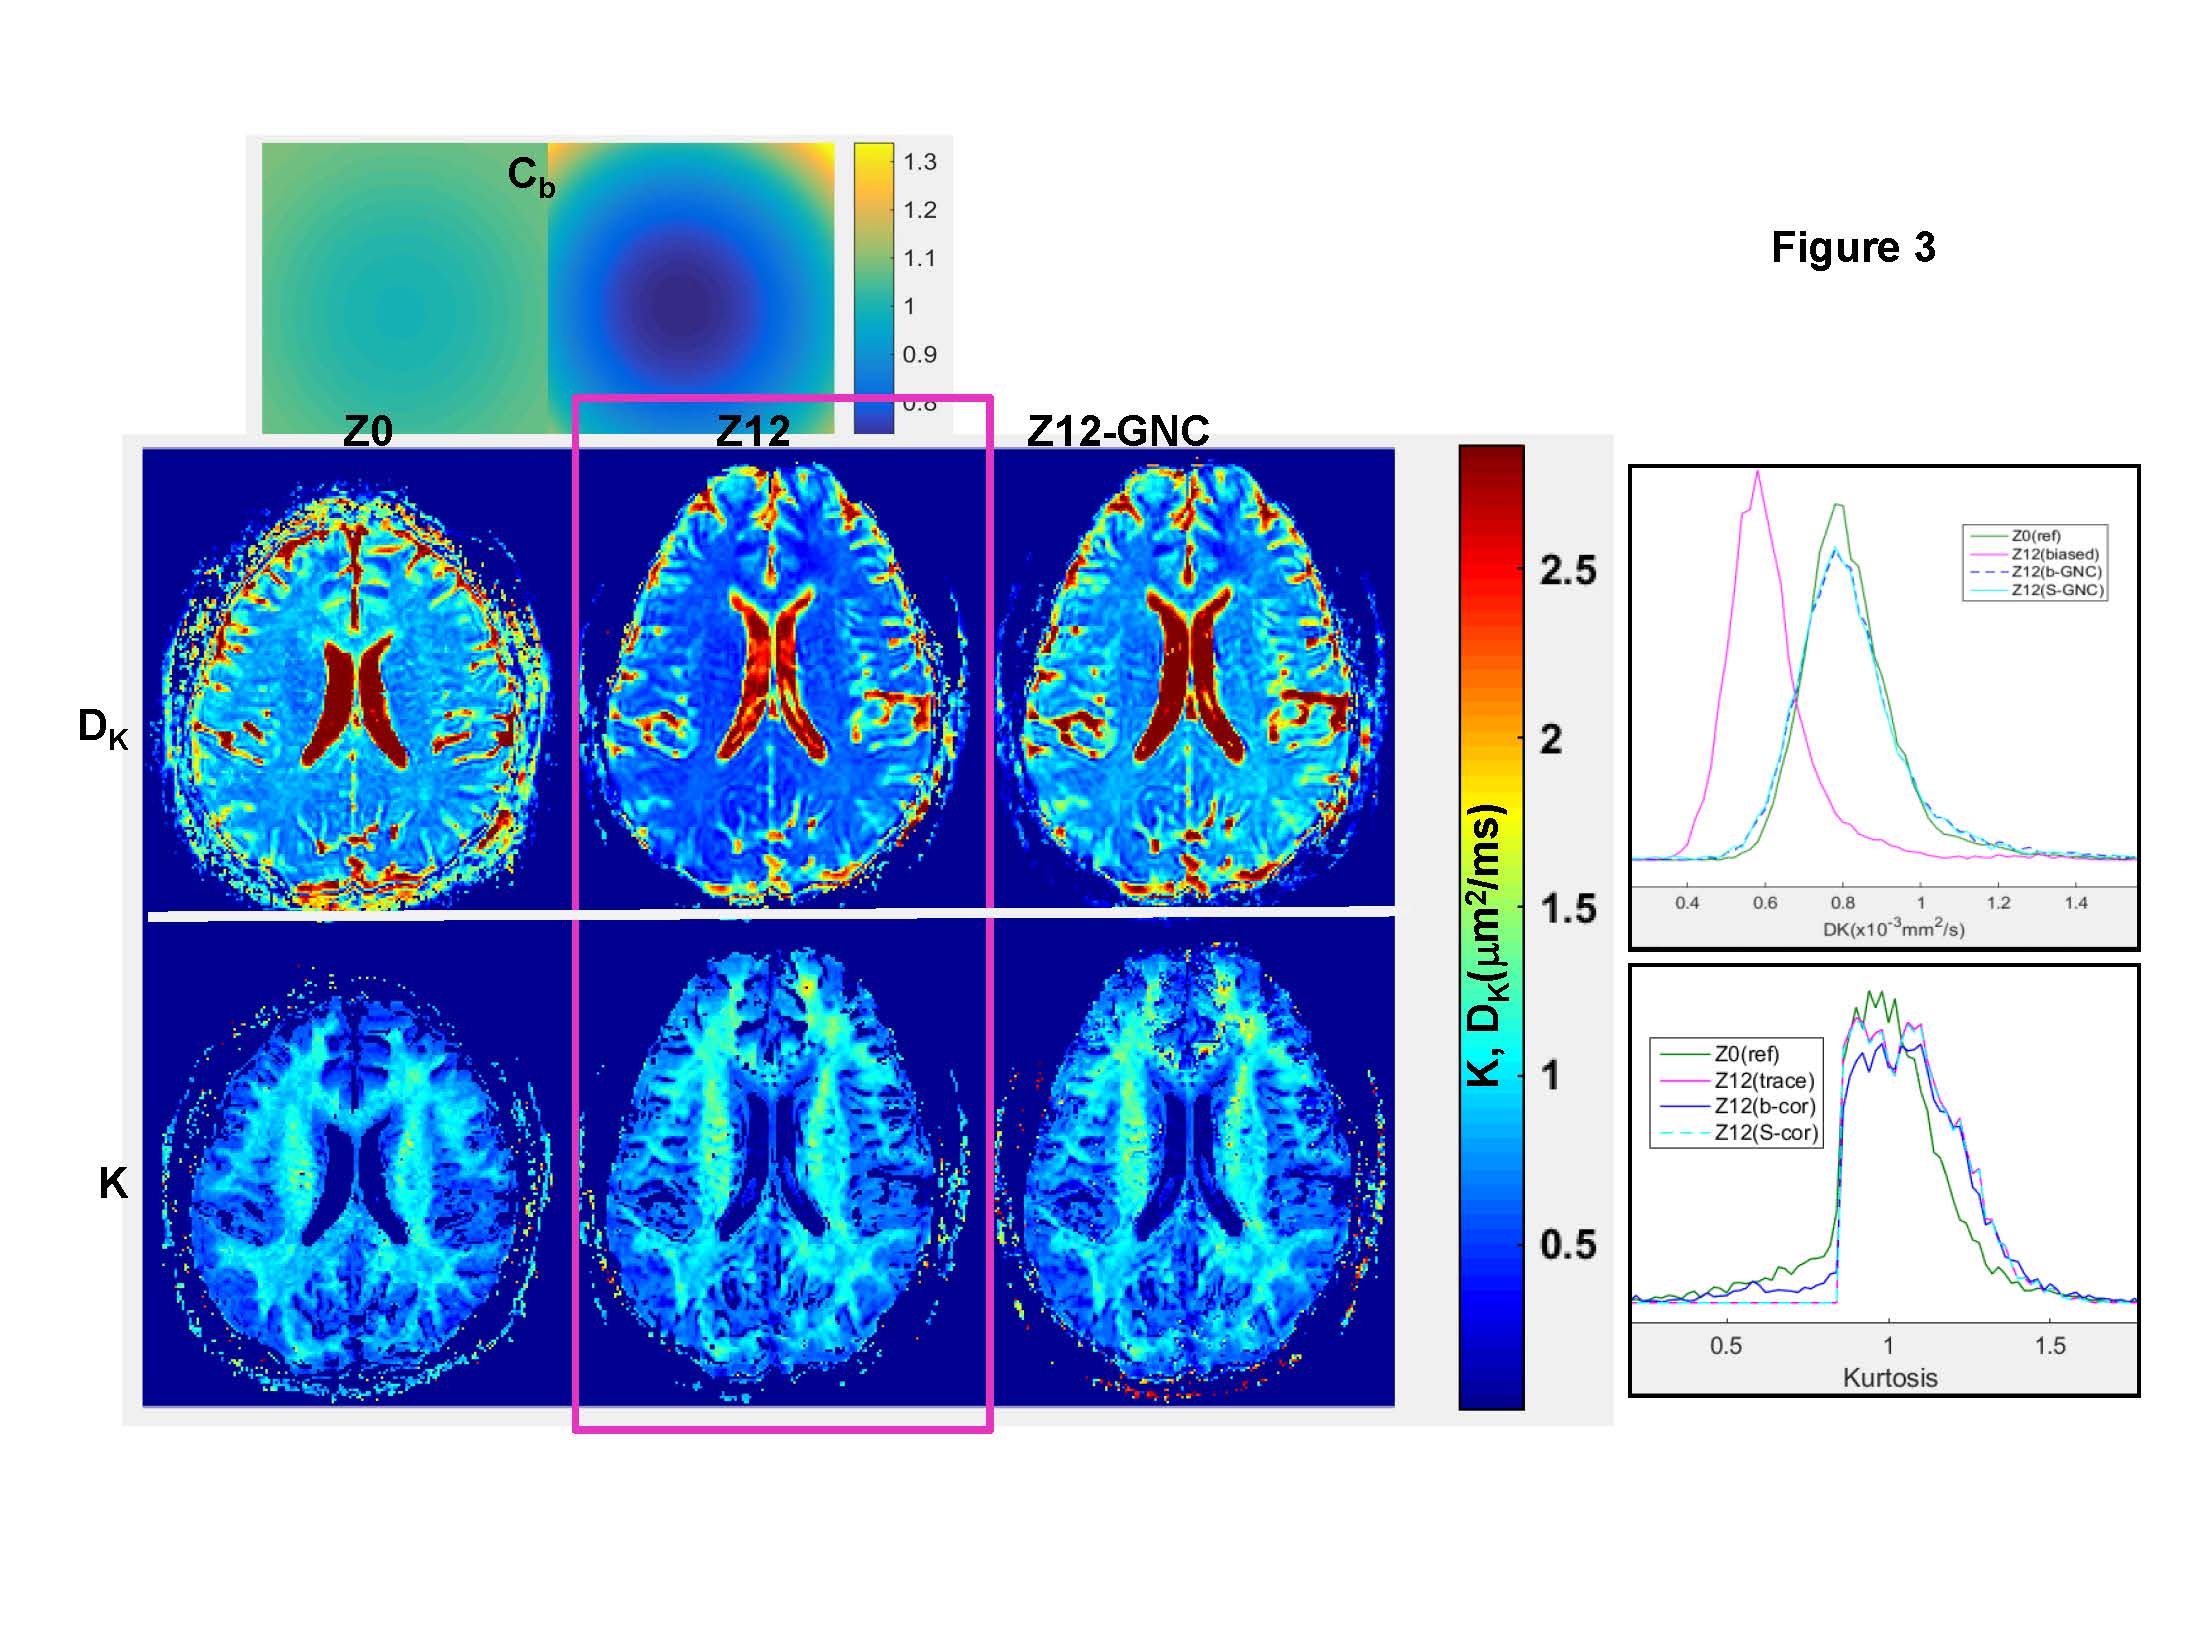
Figure 3 WM GNC results are consistent with observations for DKI phantom. No significant bias effect is evident for WM kurtosis at Z12 (overlapping K- histograms), while original average GNL-induced bias (Cb~.7-.8, Fig.3 top) in mean DK~.6 μm2/ms (magenta histogram) is effectively corrected (blue, cyan histograms) restoring reference values, DK~.8 μm2/ms, at isocenter (green). Broad WM DKI parameter histograms reflect biological variations.
CONCLUSION
For DKI model, multiplicative GNL DWI bias only effects fit mean diffusivity parameter, analytically coupled to b-value, while kurtosis is bias-free. Practical correction using instrumental b-bias maps is implemented for diffusivity fit from uncorrected DWI, and for kurtosis parameter fit for DWI corrected assuming mono-exponential diffusion.Acknowledgements
National Institutes of Health Grants: R01-CA190299, U01-CA166104, U24-CA237683References
1. Bammer R, Markl M, Barnett A, Acar B, Alley MT, Pelc NJ, Glover GH, Moseley ME. Analysis and generalized correction of the effect of spatial gradient field distortions in diffusion-weighted imaging. Magn Reson Med. 2003;50(3):560-9
2. Malyarenko DI, Ross BD, Chenevert TL. Analysis and correction of gradient nonlinearity bias in apparent diffusion coefficient measurements. Magn Reson Med. 2014;71(3):1312-23.
3. Newitt DC, Tan ET, Wilmes LJ, Chenevert TL, Kornak J, Marinelli L, Hylton N. Gradient nonlinearity correction to improve apparent diffusion coefficient accuracy and standardization in the american college of radiology imaging network 6698 breast cancer trial. J Magn Reson Imaging. 2015;42(4):908-19.
4. Malyarenko DI, Pang Y, Senegas J, Ivancevic MK, Ross BD, Chenevert TL. Correction of Gradient Nonlinearity Bias in Quantitative Diffusion Parameters of Renal Tissue with Intra Voxel Incoherent Motion. Tomography. 2015;1(2):145-51.
5. Malyarenko DI, Newitt D, Wilmes LJ, et.al. Demonstration of nonlinearity bias in the measurement of the apparent diffusion coefficient in multicenter trials. Magn Reson Med. 2016; 75(3):1312-23
6. Rosenkrantz AB, Padhani AR, Chenevert TL, Koh DM, De Keyzer F, Taouli B, et al. Body diffusion kurtosis imaging: Basic principles, applications, and considerations for clinical practice. Journal of magnetic resonance imaging : JMRI. 2015;42(5):1190-202.
7. Bickelhaupt S, Jaeger PF, Laun FB, Lederer W, Daniel H, Kuder TA, Wuesthof L, Paech D, Bonekamp D, Radbruch A, Delorme S, Schlemmer HP, Steudle FH, Maier-Hein KH. Radiomics Based on Adapted Diffusion Kurtosis Imaging Helps to Clarify Most Mammographic Findings Suspicious for Cancer. Radiology. 2018;287(3):761-70.
8. Jensen JH, Helpern JA. MRI quantification of non-Gaussian water diffusion by kurtosis analysis. NMR Biomed. 2010; 23: 698–710.
9. Malyarenko DI, Swanson SD, Konar AS, LoCastro E, et.al. Multicenter Repeatability Study of a Novel Quantitative Diffusion Kurtosis Imaging Phantom. Tomography. 2019;5:36-43 S.
10. Klein, M. Staring, K. Murphy, M.A. Viergever, and J.P.W. Pluim. elastix: a toolbox for intensitybased medical image registration. IEEE Trans Med Imaging, 29(1):196–205, Jan 2010.
11. Malyarenko D, Devaraj A, Tan ET, et al. Progress toward on-line implementation of vendor-provided prospective correction for non-uniform diffusion weighting due to gradient nonlinearity. ISMRM’27 proceedings DP:3399; 5/2019 Montreal, CA
Figures