4334
Evaluating Diffusion Kurtosis Imaging Precision at Varying Gradient Strength in High Spatial Resolution 3T MRI1School of Biomedical Engineering, Imaging Research Laboratories, Robarts Research Institute, Western University, LONDON, ON, Canada, 2Imaging Research Laboratories, Robarts Research Institute, School of Biomedical Engineering,,Department of Medical Biophysics,Departments of Medical Imaging, Western University, London, ON, Canada, 3Imaging Research Laboratories, Robarts Research Institute, Western University, London, ON, Canada, 4Imaging Research Laboratories, Robarts Research Institute, School of Biomedical Engineering, Department of Medical Biophysics, Western University, London, ON, Canada
Synopsis
Diffusion kurtosis imaging (DKI), an extension to diffusion tensor imaging (DTI), aims to improve quantification of the hindered/restricted diffusion pattern due to microstructural complexity in the brain. But in order to capture the non-Gaussian diffusion behaviour of water molecules in biological tissues, stronger gradients larger than those employed in standard diffusion weighted imaging (DWI) are required. Here, we explored the test-retest reliability of DKI derived metrics with respect to different gradient strength in a high spatial resolution dataset. It was observed that DKI precision was comparable between b-value=1000, 2000, 3000 s/mm2 and b-value=1000 & 3000 s/mm2 dataset.
Introduction
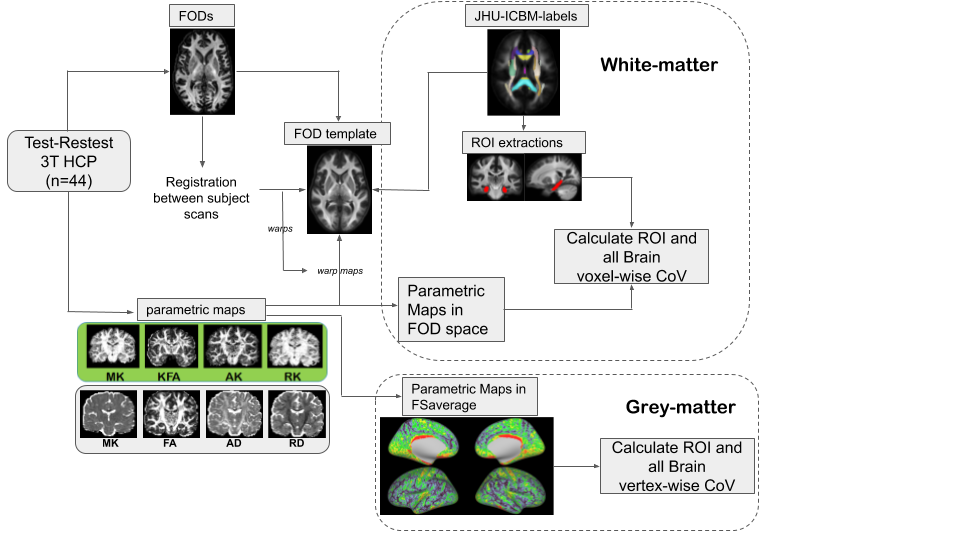
Diffusion tensor imaging(DTI)1 assumes unrestricted water diffusion in the brain. However, in vivo, DTI may be suboptimal when diffusion deviates from this due to the complex intracellular and extracellular environment. Instead, diffusion kurtosis imaging (DKI), an extension to DTI, aims to provides a more comprehensive characterization of water diffusion properties2. In order to capture the non-Gaussian diffusion behaviour of water molecules in biological tissues, larger b-values and/or stronger gradients than those employed in DWI are required. However, a higher b-value means a lower signal-to-noise ratio and a poorer repeatability of the calculated parameters3. Here, we explored the precision of the DKI derived metrics based on the number of b-values used in a test-retest setting (see general work flow, Fig 1).Materials and Methods
A total of 44 subjects from the Test-Retest Human Connectome Project (HCP) database were included in the study. Diffusion weighted imaging (DWI) data were acquired twice for all subjects across two separate sessions using a high quality image acquisition protocol and a modified Siemens Skyra 3T scanner. DWI acquisition parameters included TR/TE=5520/89.5 ms, phase partial Fourier=6/8, and nominal isotropic voxel size=1.25 mm. A total of 288 images were acquired in each DWI dataset (acquired in both anterior-to-posterior and posterior-to-anterior phase-encoding polarities, to correct for EPI distortions), including 18 baseline images with a low diffusion weighting b=5 s/mm2 and 270 diffusion weighted images evenly distributed at three shells of b=1000, 2000, 3000 s/mm2. The acquired data were processed following HCP’s ‘minimum processing pipeline4, which includes brain masking, motion correction, eddy current correction and EPI distortion correction. For both test and retest data of each subject, two subsets of data were generated from the original three shells dataset, for assessing DKI precision as function of b-values used. The second dataset included only b-values=1000 & 2000 s/mm2, while a third dataset only included b-values=1000 & 3000 s/mm2. Three separate fitting procedures were conducted using DIPY5 to generate corresponding DKI parametric maps with each subject’s scans. DKI metrics are: the DTI mean diffusivity (MD), the average diffusion, axial diffusivity (AD) the diffusion in the axial direction; and radial diffusivity (RD) the diffusion perpendicular to the axial diffusion. In addition to these are the kurtosis metrics, mean kurtosis (MK), radial kurtosis (RD) and axial kurtosis (AK) which are analogous to the DTI metrics. To allow group-analyses, we computed an unbiased group-average fiber orientation dispersion (FOD) template using affine and non-linear registration of individual subject FODs via MRtrix36. To minimize variability between the subjects’ scans, we performed rigid registration between subjects’ FODs. The calculated transformations were then used to transform each subject’s DKI maps to the template space. For white matter region-based analyses the JHU-ICBM-labels atlas7 was registered to the FOD template. In addition, for grey matter analyses of the individual lobes8, we mapped all the individual subject’s co-registered maps onto the ‘fsaverage’ surface space9 using FreeSurfer’s ‘mri_vol2surf’ function, sampling hereby between pial and white-grey matter boundaries from 20 to 80 percent of the estimated cortical thickness. Finally, to test for precision, we calculated the voxel- and vertex-wise within-subject coefficient of variation (CoV) a ratio of the standard deviation to the mean, for each parametric maps generated from the pair of three datasets. In addition, to check for any potential bias in our analysis, we performed Pearson correlation tests in the calculated values between the DKI parametric maps derived from each dataset (i.e., varying b-values).Results
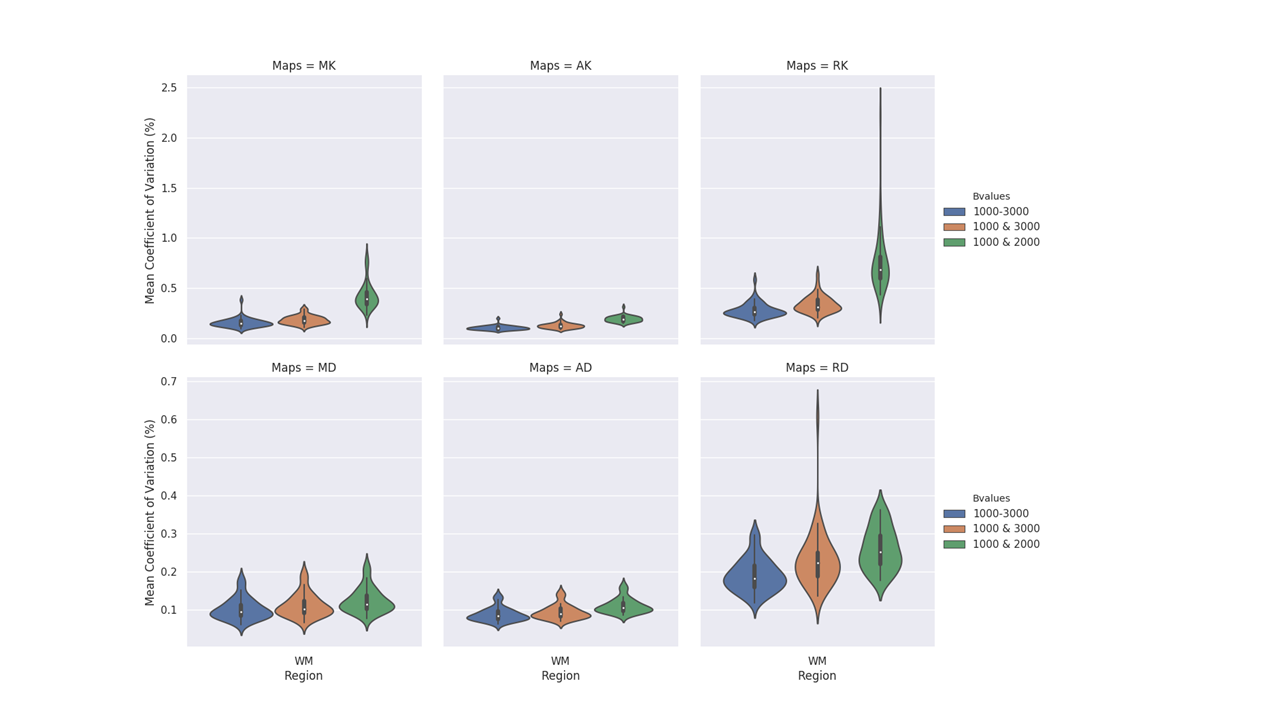
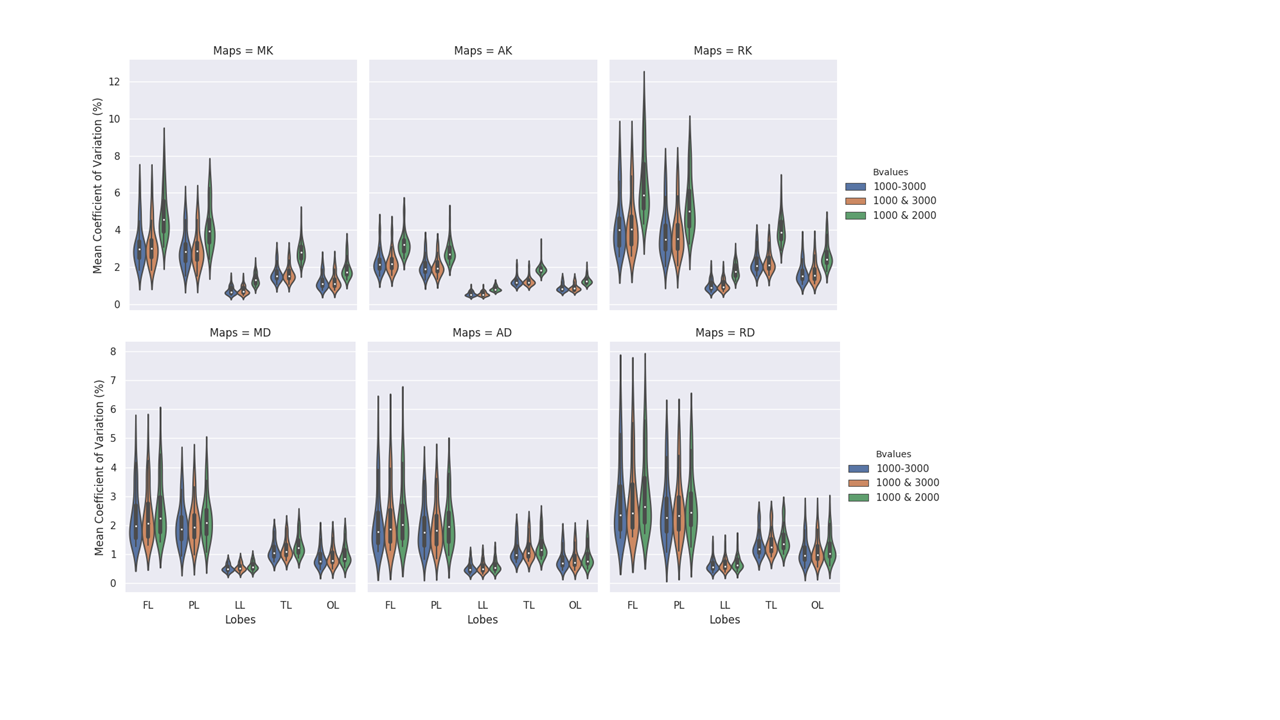
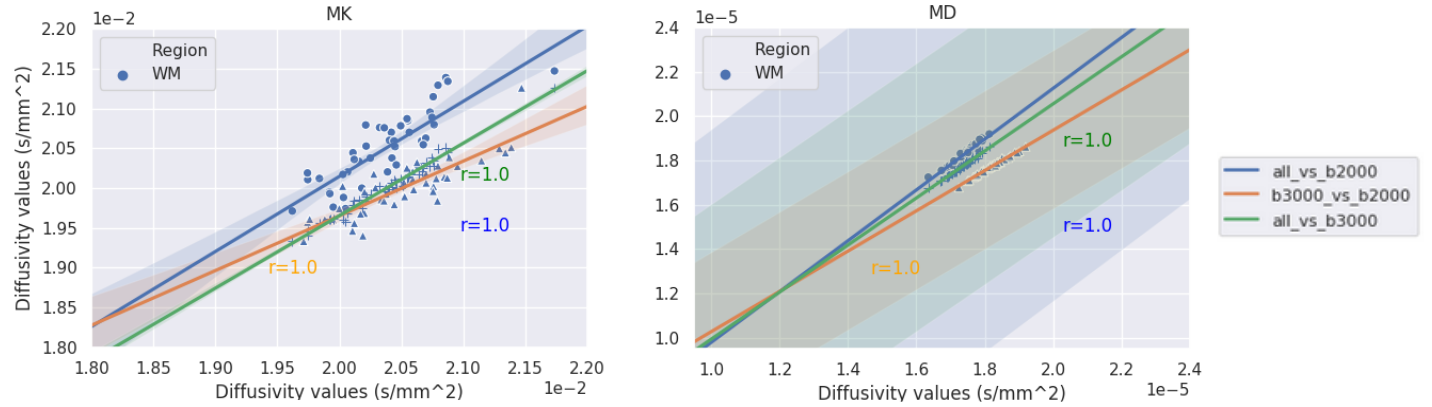
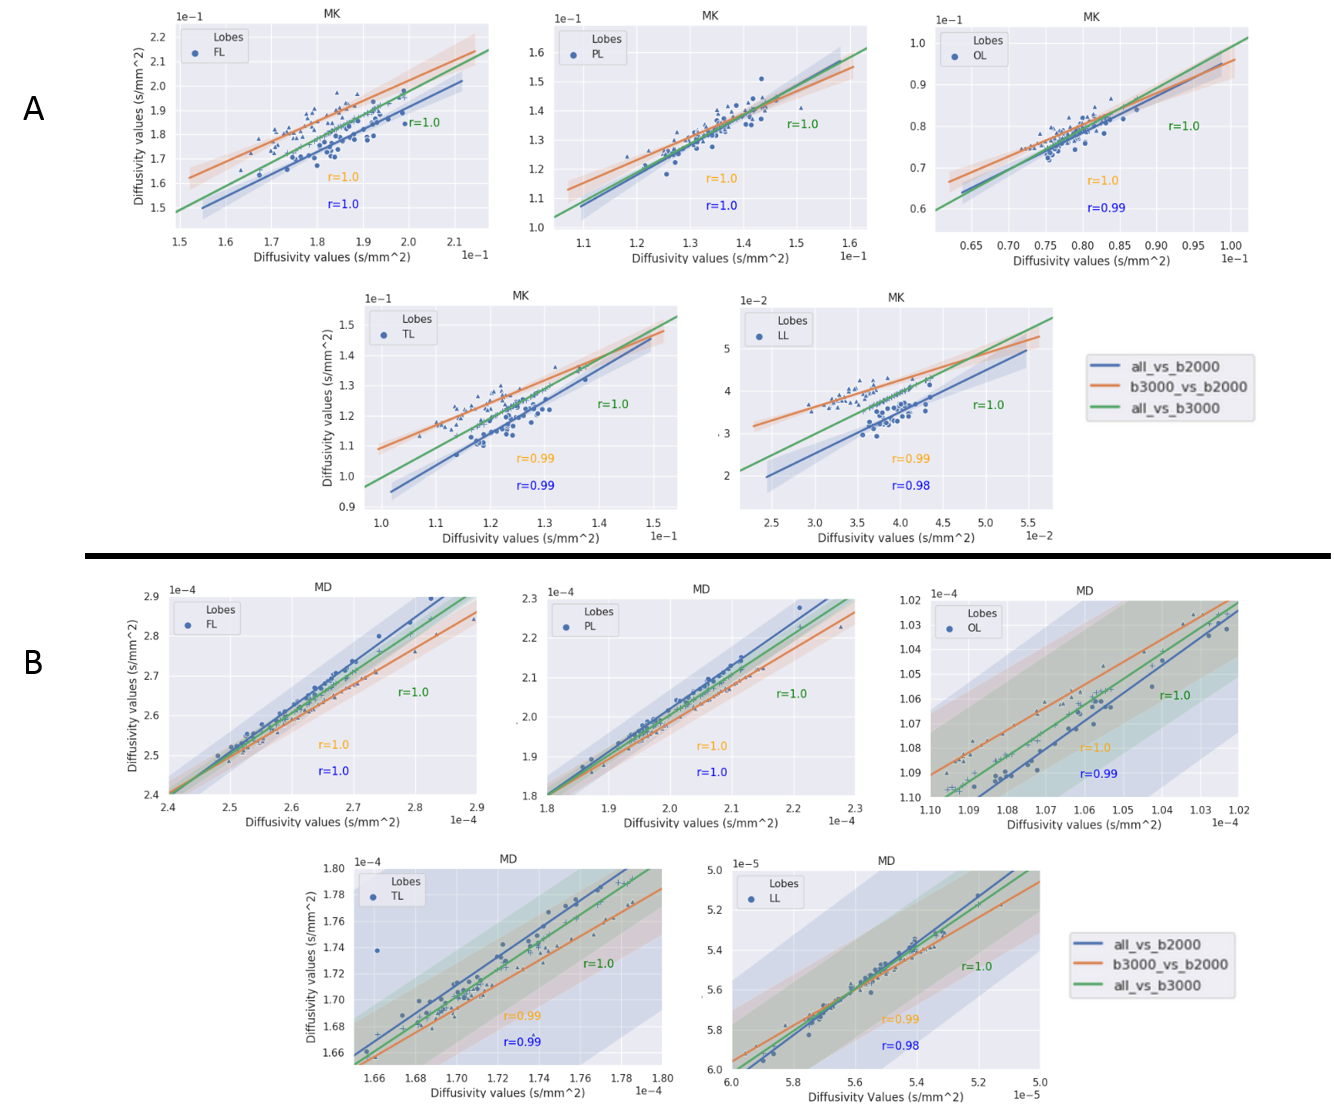
Figures 2 and 3 exhibit the mean within-subject coefficient of variation from the white-matter and on the surface of the five lobes calculated from the maps generated from the three datasets respectively. Both b-value=1000-3000 s/mm2 (initial dataset) and b-value=1000 & 3000 s/mm2 dataset achieved the lowest CoVs (> 0.5%) in all maps in the white-matter analysis. In the grey-matter, similar behaviour was observed between the initial dataset and the dataset with b-value=1000 & 3000 s/mm2, achieving CoVs > 3% compared to b-value=1000 & 2000 s/mm2 data.Figures 4 (white-matter) and 5 (grey-matter) presents the Pearson correlation (r) in calculated DKI metric values from each maps between different dataset’s. There is a consistent strong correlation (r=1) between the initial dataset and the two shells (b=1000 & 3000 s/mm2) dataset across grey and the white matter.
Discussion
The ability of DKI to precisely quantify different tissue type has a direct correlation with the maximum b-values used to acquire the underlying DWI data. Most importantly, our analysis show that the precision (i.e. CoV) of the dataset with only two shells b-value=1000 & 3000 s/mm2 is comparable to the original dataset with b=1000, 2000, 3000 s/mm2. In contrast, the more common acquisition strategy (i.e., b-values=1000 & 2000 s/mm2) is characterized by higher inter-scan variability. In addition, the Pearson correlation test demonstrated a close linear relationship (r=1) between the DKI metric values calculated from the initial dataset and the b-value=1000 & 3000 s/mm2 dataset. These findings suggest that it is possible to achieve similar DKI precision as in three shells data with only two shells leading to shorter acquisition times and therefore, increased utility in a clinical setting.Acknowledgements
This work was supported by Canadian Institutes of Health Research (CIHR) Foundation, Natural Sciences and Engineering Research Council (NSERC) Discovery, the Canada First Research Excellence Fund and Brain Canada.References
1. Tournier, J.-D., Mori, S. & Leemans, A. Diffusion tensor imaging and beyond. Magn. Reson. Med. 65, 1532–1556 (2011).
2. Jensen, J. H., Helpern, J. A., Ramani, A., Lu, H. & Kaczynski, K. Diffusional kurtosis imaging: The quantification of non-gaussian water diffusion by means of magnetic resonance imaging. Magn. Reson. Med. 53, 1432–1440 (2005).
3. Shahim, P., Holleran, L., Kim, J. H. & Brody, D. L. Test-retest reliability of high spatial resolution diffusion tensor and diffusion kurtosis imaging. Sci. Rep. 7, (2017).
4. Glasser, M. F. et al. The minimal preprocessing pipelines for the Human Connectome Project. NeuroImage 80, 105–124 (2013).
5. Garyfallidis, E. et al. Dipy, a library for the analysis of diffusion MRI data. Front. Neuroinformatics 8, (2014).
6. Tournier, J.-D. et al. MRtrix3: A fast, flexible and open software framework for medical image processing and visualisation. bioRxiv (2019) doi:10.1101/551739.
7. Mori, S. et al. Stereotaxic white matter atlas based on diffusion tensor imaging in an ICBM template. NeuroImage 40, 570–582 (2008).
8. Van Essen, D. C. A Population-Average, Landmark- and Surface-based (PALS) atlas of human cerebral cortex. NeuroImage 28, 635–662 (2005).
9. Fischl, B., Sereno, M. I., Tootell, R. B. H. & Dale, A. M. High-resolution intersubject averaging and a coordinate system for the cortical surface. Hum. Brain Mapp. 8, 272–284 (1999).
Figures