4333
The Use of Stimulated-Echo EPI to Obtain High b-Value DTI Data at Short TEs on a Clinical Scanner1Laboratory for Cognitive Brain Mapping, RIKEN - Center for Brain Science, Wako-shi, Japan, 2Siemens Healthcare GmbH, Erlangen, Germany
Synopsis
On clinical scanners, high b-value diffusion studies using SE-EPI suffer from the need for long TEs, which leads to signal loss due to T2 decay. Stimulated-Echo EPI permits high b-values together with short TEs on clinical scanners. We demonstrate that tractograms obtained from high b-value STE-EPI images are clean even in regions where tractograms from SE-EPI images with the same b-values break down.
Introduction
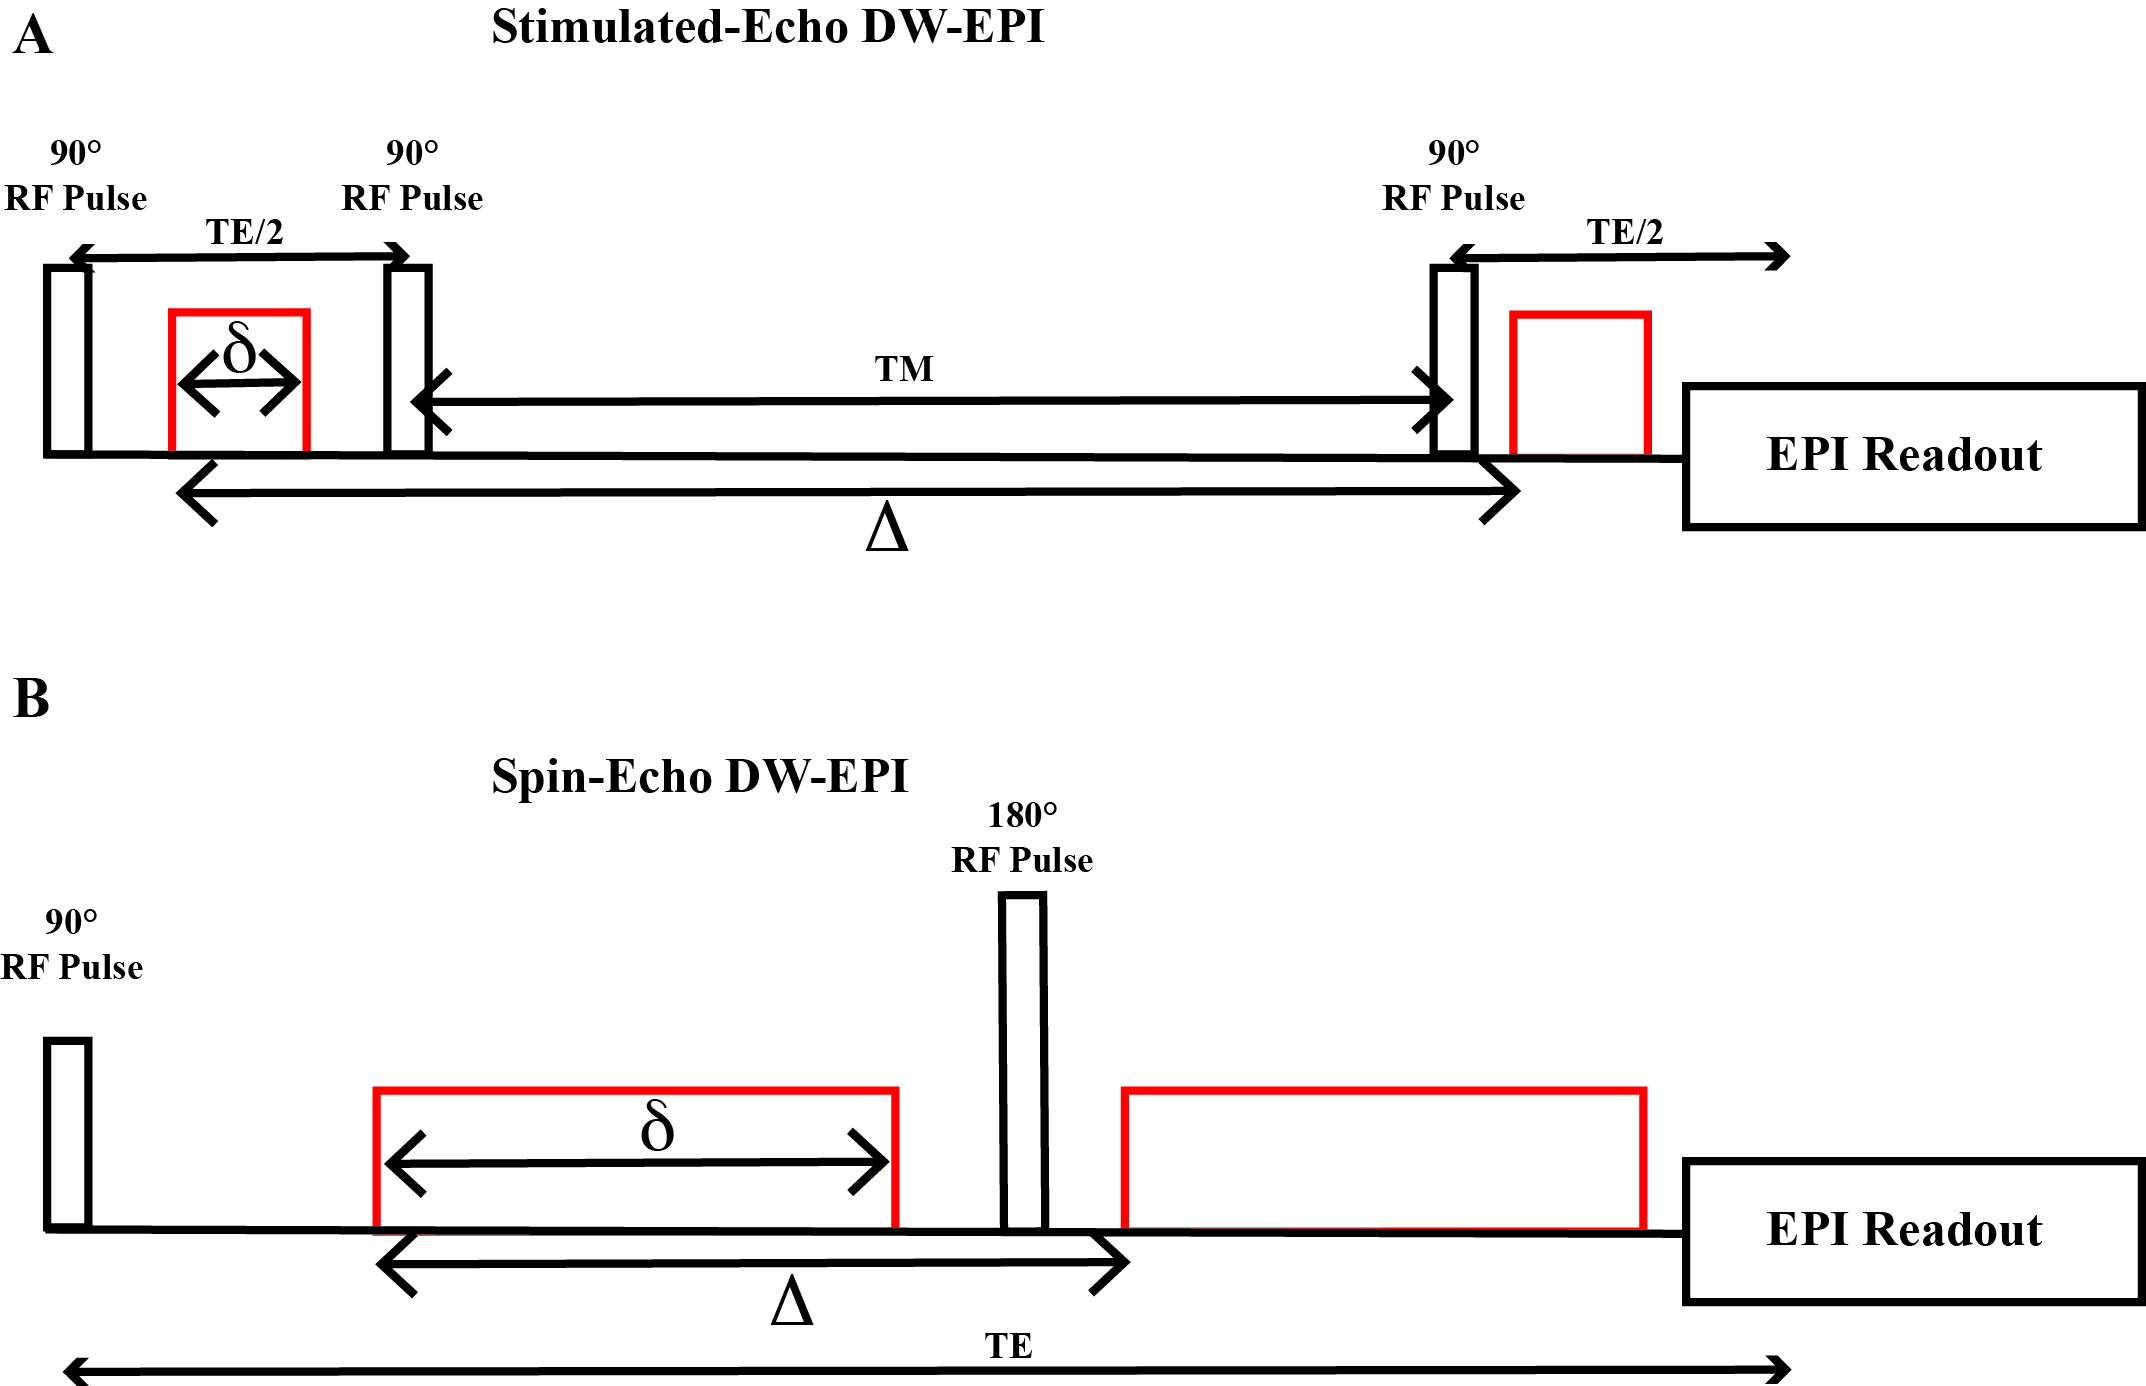
Recent studies using very high performance gradient coils have shown the value of acquiring high b-value diffusion-weighted (DW) data, with short echo times.1,2 This significantly improves SNR in the heavily DW images. But the maximum gradient strength available in those studies is not available on clinical MRI scanners. The use of Stimulated-Echo EPI (STE-EPI) enables the acquisition of heavily diffusion-weighted data with clinically available gradient coils, while keeping TE short. This is accomplished by extending the T1-dependent mixing time TM (see Fig. 1A) to increase Δ, without increasing TE. The use of Stimulated-Echoes for DW images predates even DTI,3 but it is not widely used because at low b-values, Spin-Echo EPI (SE-EPI) has better SNR. The use of Stimulated-Echoes as a tool for studying diffusion in systems with long T1s and short T2s is an idea that even predates MRI.4 Dhital and Turner showed that at 7 Tesla, STE-EPI has higher SNR than SE-EPI at long echo times (TE + TM).5 In this study, we show that at high b-values STE-EPI can yield higher-quality results than SE-EPI on a clinical 3T scanner as well.Methods
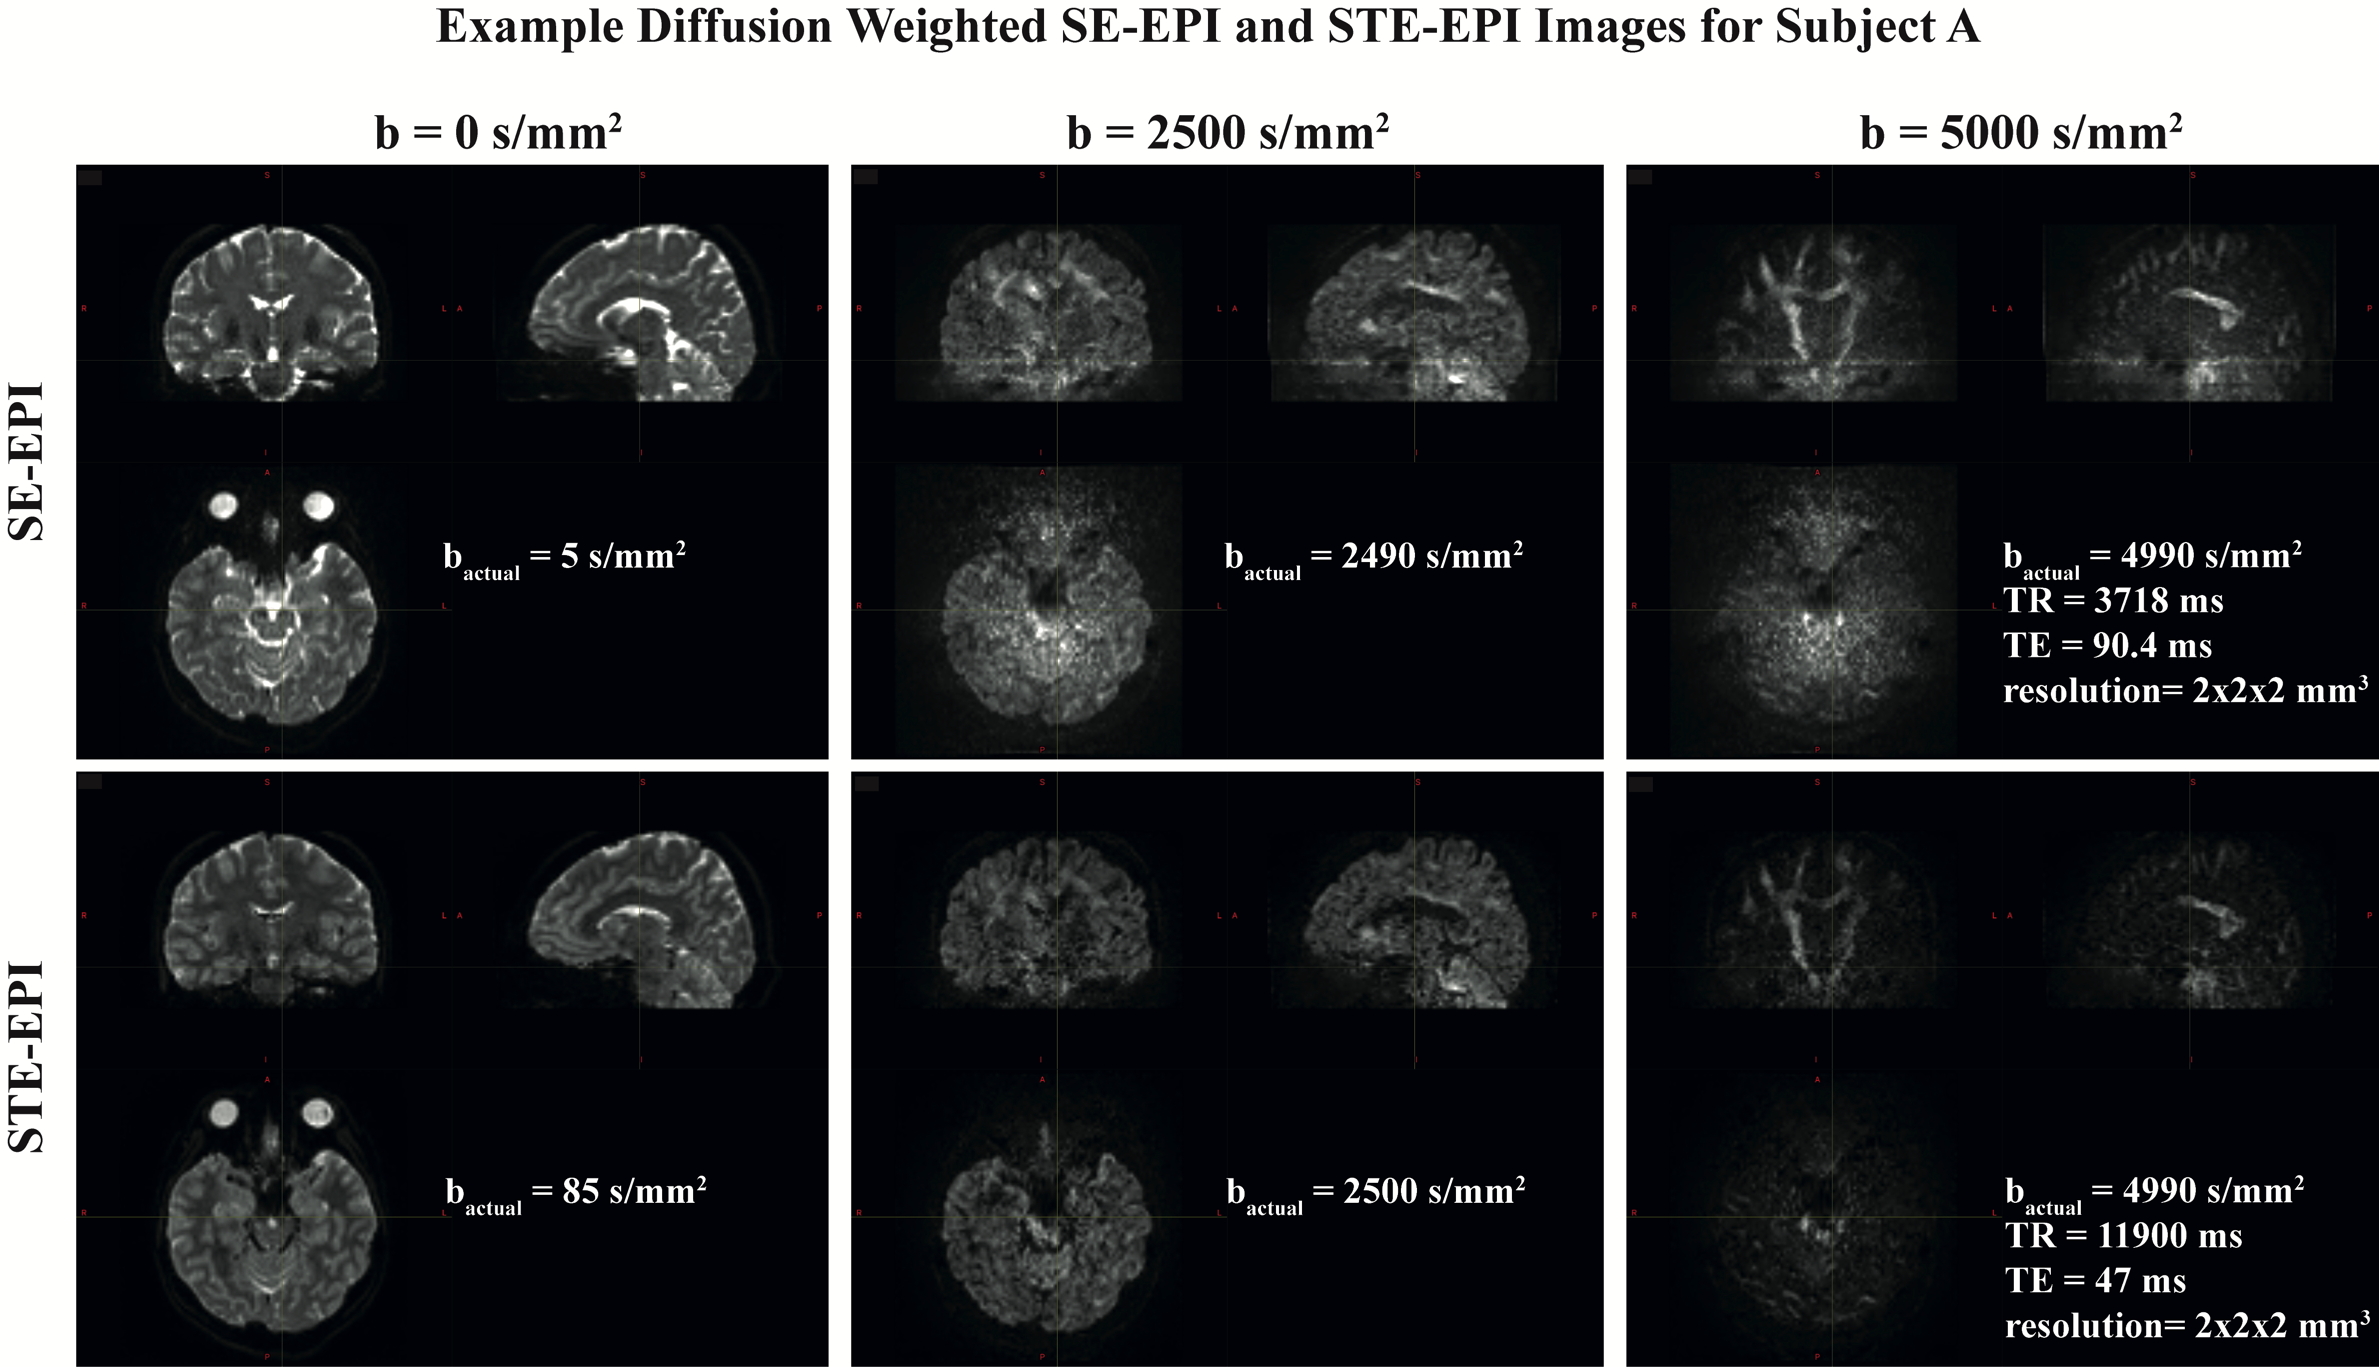
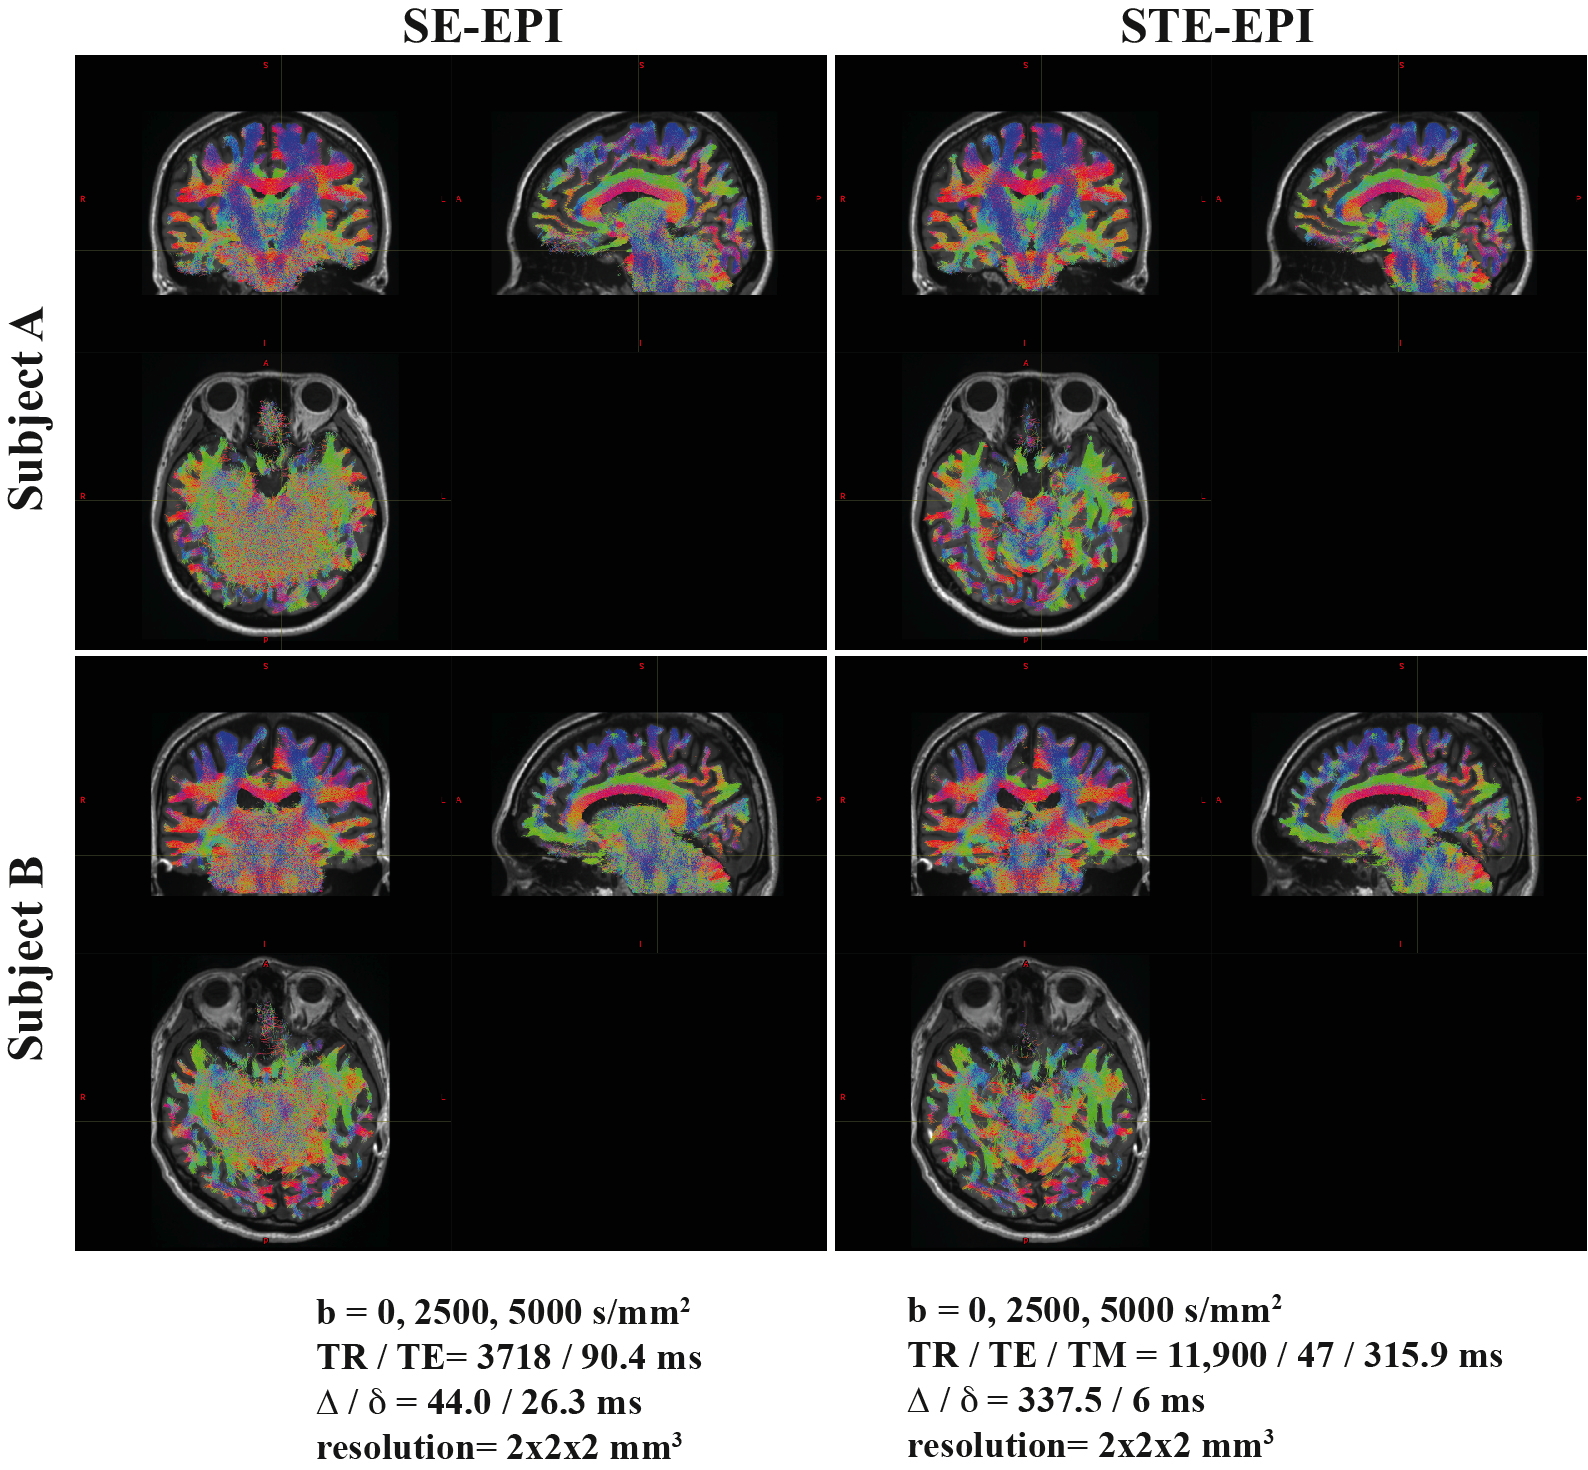
Experiments were performed on a 3T MAGNETOM Prisma (Siemens Healthcare, Erlangen, Germany), using a Siemens 32-channel head coil and a prototype STE-EPI sequence. For comparison, SE-EPI data was also acquired for each subject using a customized multi-band DTI sequence (CMRR C2P R2016a, University of Minnesota). For both sequences, 60 2mm-thick slices were acquired with a multi-band factor of 2, iPAT=2, and Partial Fourier=7/8. The in-plane resolution was 2x2 mm2, with an FOV of 192x192mm2. The values of TR, TE, Δ, and 𝛿, are given in Fig. 3. The nominal b-values in each case were b=0 (11 volumes), 2500 (48 directions) , 5000 (48 directions) s/mm2; however, primarily due to crusher gradients, the actual minimum b-values were 5 s/mm2 (SE-EPI) and 85 s/mm2 (STE-EPI). The use of the long Δ does significantly increase the overall acquisition time for the 107 volumes acquired using each pulse sequence, from 7.4 mins. for SE-EPI to 22.6 mins. for STE-EPI. Two subjects were studied (one female), average age 40yrs.Each data set was distortion corrected and motion corrected, using FSL's topup and eddy.6 A PCA-based denoising algorithm, dwidenoise, was applied.7,8 Then, multi-shell multi-tissue constrained spherical deconvolution (MSMT-CSD) in MRtrix38 was used to estimate fiber orientation distributions.8,9 500,000 fiber tracts were generated from random seeds throughout the white matter using the fiber orientation distributions, and tracts shorter than 30 mm were removed.
Results & Discussion
Fig. 2 shows example images at each b-value for both STE-EPI and SE-EPI, from subject A. At the higher b-values, the STE-EPI images are clearly cleaner, especially in the inferior portion of the brain, the region farthest from the receive array. The long Δ and therefore long TM of the STE-EPI b=0 images causes the crusher gradients to add noticeable diffusion weighting (b=85 s/mm2) and thus stronger gray matter/white matter contrast than in the SE-EPI b=0 images. The much shorter TE of the STE-EPI images (47 ms vs 90.4 ms) results in less signal drop-out in the orbitofrontal region than in the SE-EPI images.Fig 3. Shows the tractograms for both subjects and each pulse sequence. The STE-EPI tractograms are relatively clean over the entire brain, including the cerebellum. In regions close to the receive coils and therefore higher in SNR, the SE-EPI tractograms are also largely free of randomly oriented tracts. In the inferior part of the brain, especially toward the middle of the brain, the tracts appear to be largely random, clearly suffering from the poor quality of the underlying data.
Conclusions
High b-value DW data enables characterization of the complex fiber orientation distributions present in voxels containing multiple fiber bundles. Obtaining such data is difficult with clinically available gradient coils, when using SE-EPI, because long TEs are needed with a corresponding signal loss due to T2 relaxation. As we have demonstrated here, STE-EPI permits high b-values, while minimizing TE by use of a long Δ (and TM). Thus STE-EPI seems to be an ideal sequence for high b-value DTI studies on clinical MRI scanners.Acknowledgements
This work was partially funded by a grant from the Brain/MINDS project.References
1. Setsompop K, Kimmlingen R, Eberlein E, et al. Pushing the limits of in vivo diffusion MRI for the Human Connectome Project. NeuroImage. 2013;80:220-233.
2. Mcnab JA, Edlow BL, Witzel T, et al. The Human Connectome Project and beyond: initial applications of 300 mT/m gradients. NeuroImage. 2013;80:234-245.
3. Merboldt KD, Hänicke W, Frahm J. Diffusion imaging using stimulated echoes. Magn Reson Med. 1991;19(2):233-239.
4. Tanner J. Use of the stimulated echo in NMR diffusion studies. J Chem Phys. 1970;52:2523.
5. Dhital B, Turner R. Diffusion Weighted Imaging at 7T with STEAM-EPI and GRAPPA. ISMRM 2010;18:3994.
6. FSL 6.0.1, https://fsl.fmrib.ox.ac.uk/fsl/fslwiki
7. Veraart, J.; Novikov, D.S.; Christiaens, D.; Ades-aron, B.; Sijbers, J. & Fieremans, E. Denoising of diffusion MRI using random matrix theory. NeuroImage. 2016;142:394-406.
8. MRtrix3, https://mrtrix.readthedocs.io/en/latest/index.html
9. Jeurissen, B. Tournier J-D, Dhollander T, Connelly A, Sijbers J. Multi-tissue constrained spherical deconvolution for improved analysis of multi-shell diffusion MRI data. NeuroImage. 2014;103(C):411-426.
Figures