4331
Single-Shot Diffusion-Weighted Spatiotemporal Encoding (SPEN) using Polarities Average Mode (PAM) to Correct Spatial-Dependent b-Values1Center for Brain Imaging Science and Technology, Department of Biomedical Engineering, Key Laboratory for Biomedical Engineering of Ministry of Education, Zhejiang University, Hangzhou, China, 2MR Collaboration, Siemens Healthcare Ltd., Shanghai, China, 3Department of Imaging Sciences, University of Rochester, Rochester, NY, United States
Synopsis
Compared to traditional echo-planar imaging (EPI)-based schemes, spatiotemporal encoding (SPEN) is largely insensitive to magnetic field and chemical shift heterogeneities. However, excitation gradient has different effects for each position, thus the interaction between imaging and diffusion gradients introduces spatial-dependent diffusion weightings along the SPEN axis. A new method named polarities average mode (PAM) was proposed to obtain accurate apparent diffusion coefficient (ADC) map, with two acquisitions of different polarities between excitation and diffusion gradients. Simulation, phantom, and human experiments were designed to assess method performance. The proposed method enables SPEN to obtain ADC maps easily and accurately.
Synopsis
Compared to traditional echo-planar imaging (EPI)-based schemes, spatiotemporal encoding (SPEN) is largely insensitive to magnetic field and chemical shift heterogeneities. However, excitation gradient has different effects for each position, thus the interaction between imaging and diffusion gradients introduces spatial-dependent diffusion weightings along the SPEN axis. A new method named polarities average mode (PAM) was proposed to obtain accurate apparent diffusion coefficient (ADC) map, with two acquisitions of different polarities between excitation and diffusion gradients. Simulation, phantom, and human experiments were designed to assess method performance. The proposed method enables SPEN to obtain ADC maps easily and accurately.Introduction
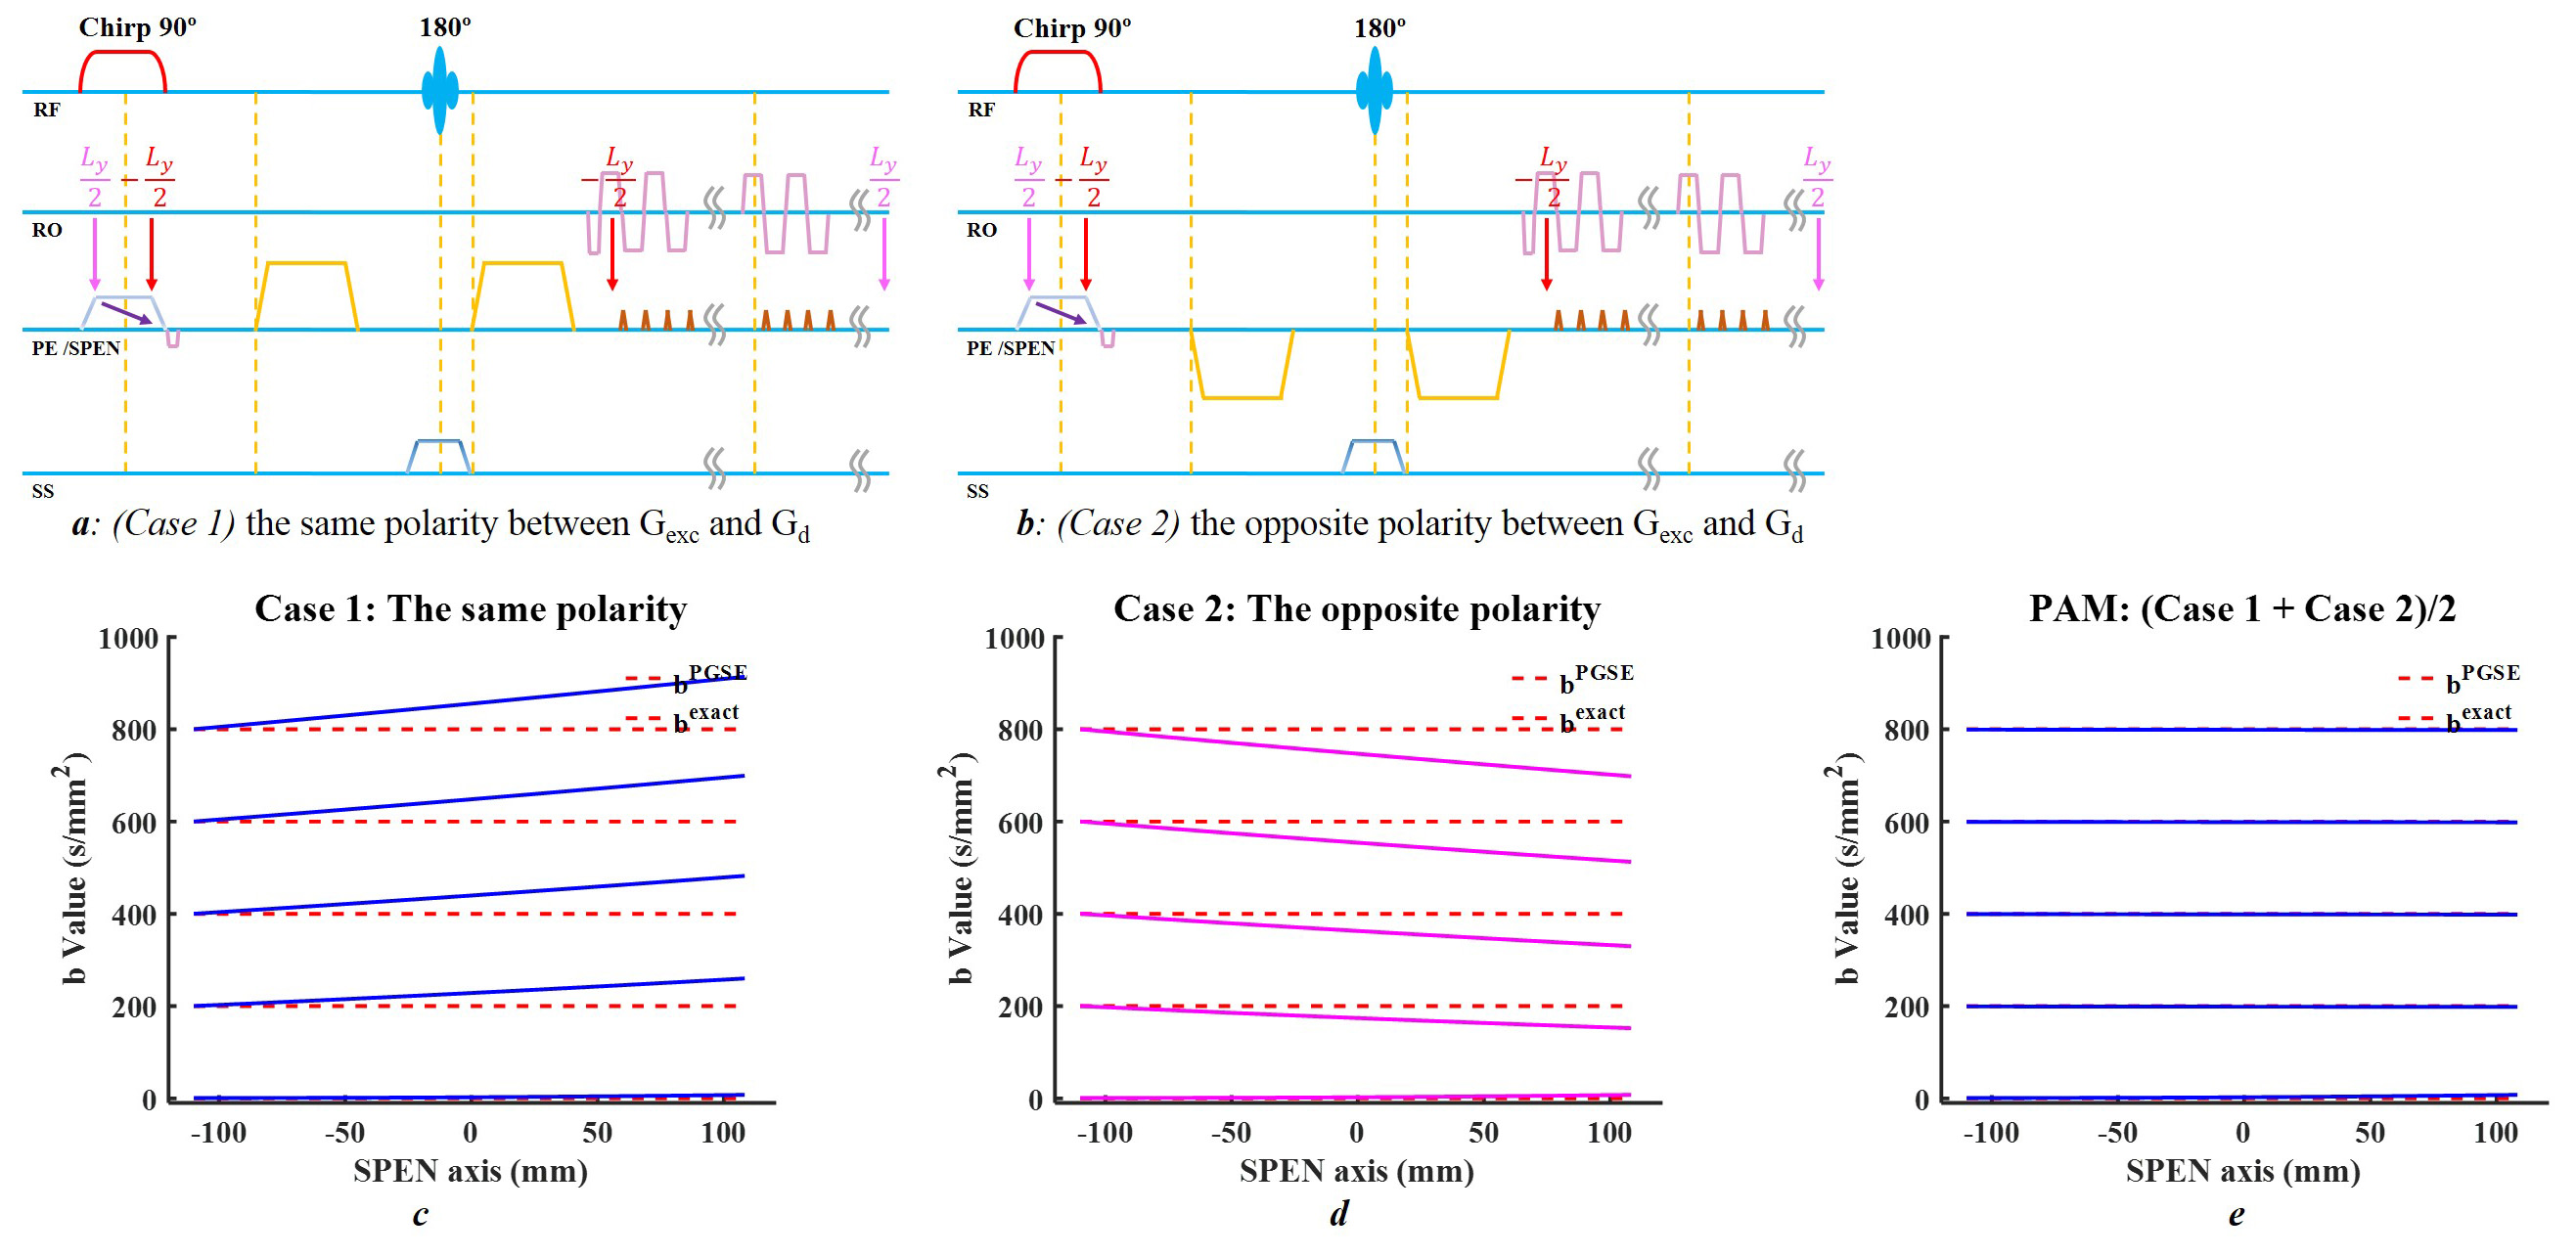
As an alternative to single-shot echo-planar imaging (EPI)1, single-shot spatiotemporal encoding (SPEN) has received wide attention due to its robustness against inhomogeneity-induced distortion2. For diffusion-weighted (DW) MRI3, the precise assessment of b-values is important for quantification. However, general b-value calculation is not applicable to SPEN4. Protons are excited along the SPEN-axis at different times, and their dephasing caused by the effective area of excitation gradient (Gexc) does not rephase immediately. The extent of the interaction between Gexc and diffusion gradient (Gd) varies with different positions, producing non-negligible spatial-dependent b-values along the SPEN-axis. SPEN also suffers from spatially dependent echo times (TEs) along the SPEN-axis due to its “first-in-last-out” characteristics5.This study examines the possibility to obtain DWI with uniform b-values and accurate apparent diffusion coefficient (ADC). One end of the sample along the SPEN-axis, which is excited last but refocused first, has a minimal effective TE value and a minimal effective area of Gexc to interact with Gd. Therefore, if the chirp pulse and Gexc remain the same, but the directions of the diffusion gradients are changed, two acquired images will have the same TE(y) curves and two symmetrical b(y) but opposite trends. By processing these two images, complex b-value spatial dependence may be largely avoided.
Methods
TheoryThe frequency of chirp pulse is chosen as linearly decreasing with time. For simplicity, only diffusion weightings along the SPEN-axis are considered. Two acquisitions with opposite directions of the diffusion gradient are shown in Figures 1a-b.
i. Case 1: Gexc and Gd have the same polarity.
ii. Case 2: Gexc and Gd have opposite polarity.
The reconstructed images have the same spatially dependent TE(y) due to their same excitation/refocusing order. Simulations of the spatial-dependent b(y) curves from the two cases show an opposite but symmetrical trend (Figures 1c-d). After averaging the corresponding b(y) curves for each expected b-value, a new curve which is spatial-independent was obtained.
The diffusion effect for Case1, Case 2, and combined image can be described by the following equations,
$${I_1} = {I_0}*{e^{ - {b_1}(y)*ADC}}{\kern 1pt}{\kern 1pt}[1]$$
$${I_2} = {I_0}*{e^{ - {b_2}(y)*ADC}}{\kern 1pt}{\kern 1pt}[2]$$
$$\sqrt {{I_1}*{I_2}} = {I_0}*{e^{ - \frac{{{b_1}(y) + {b_2}(y)}}{2}*ADC}}{\kern 1pt}{\kern 1pt}[3]$$
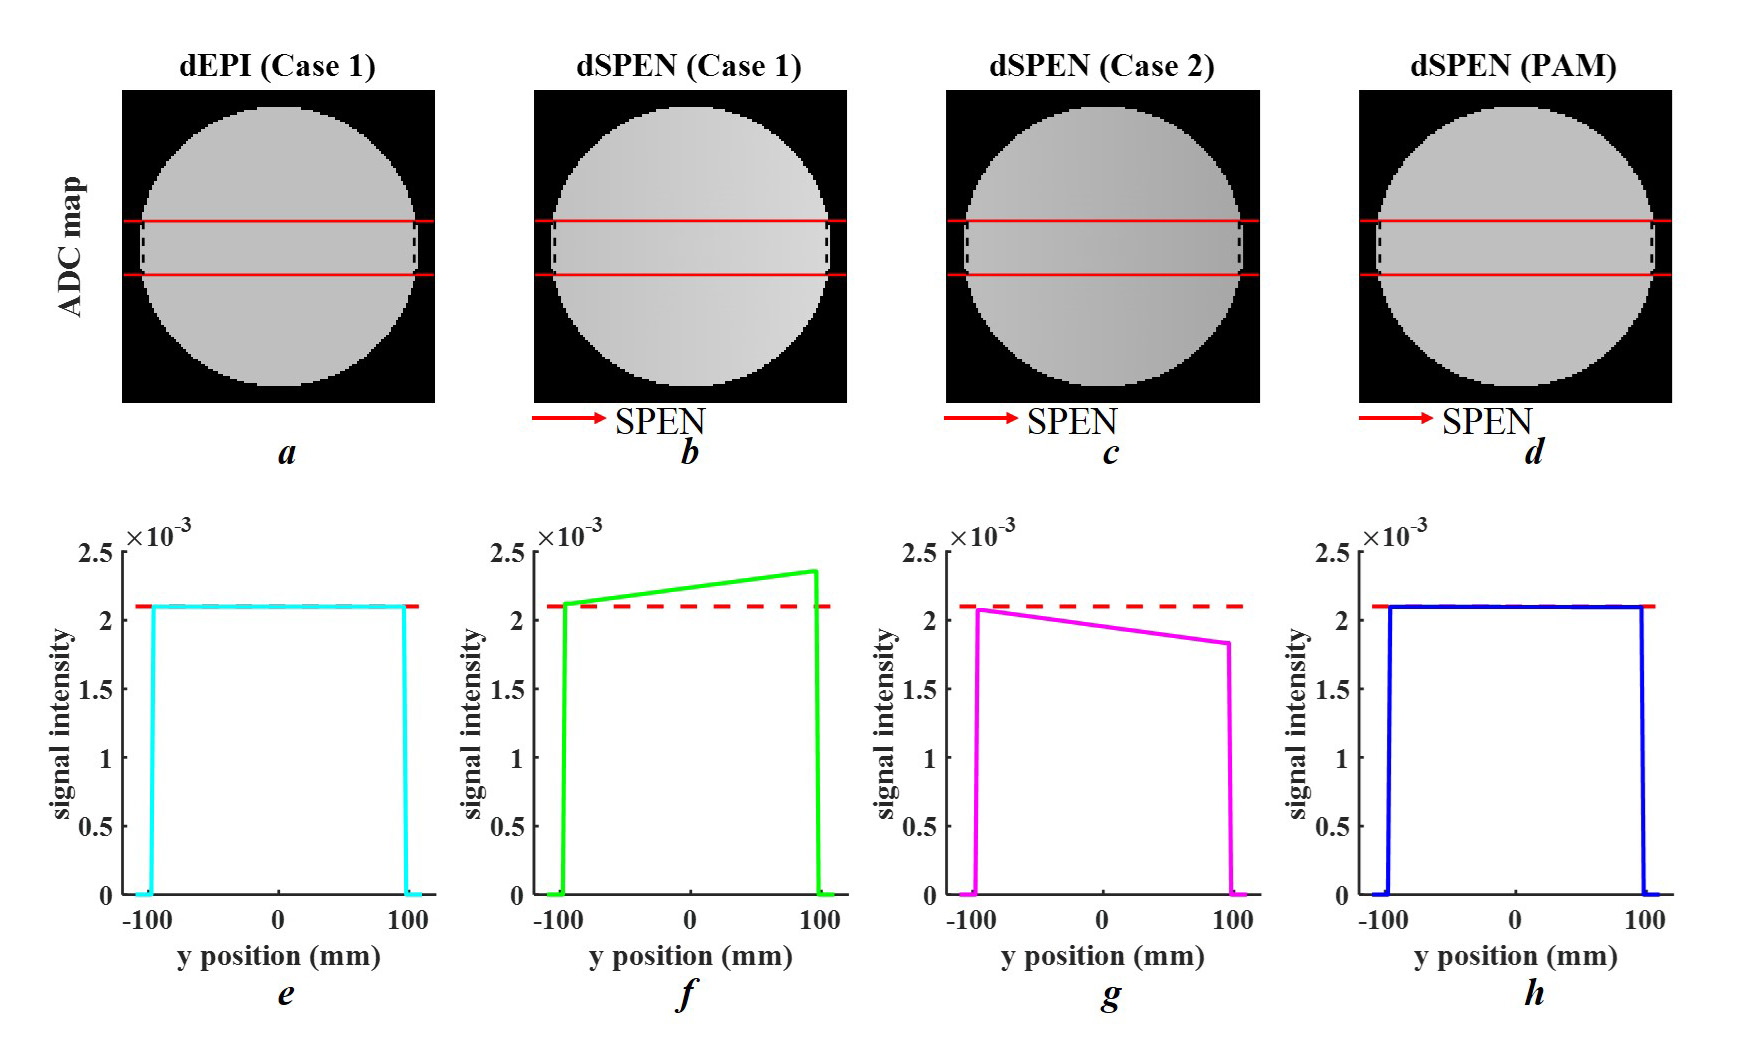
By integrating two DWIs with different polarities, namely polarities average mode (PAM), the combined $$$\sqrt {{I_1}*{I_2}}$$$ has an expected b-value in all positions along the SPEN-axis (Figure 1e). In addition to spatial-independent diffusion weighting, the combined image has an improved signal-to-noise ratio (SNR) and could be used to produce an improved ADC map. ADC map was calculated from b=0 and b=800 DWIs, and the results were compared among , i) dEPI (Case 1), ii) dSPEN (Case 1), iii) dSPEN (Case 2), and iv) dSPEN (PAM).
Simulation, phantom and human measurements
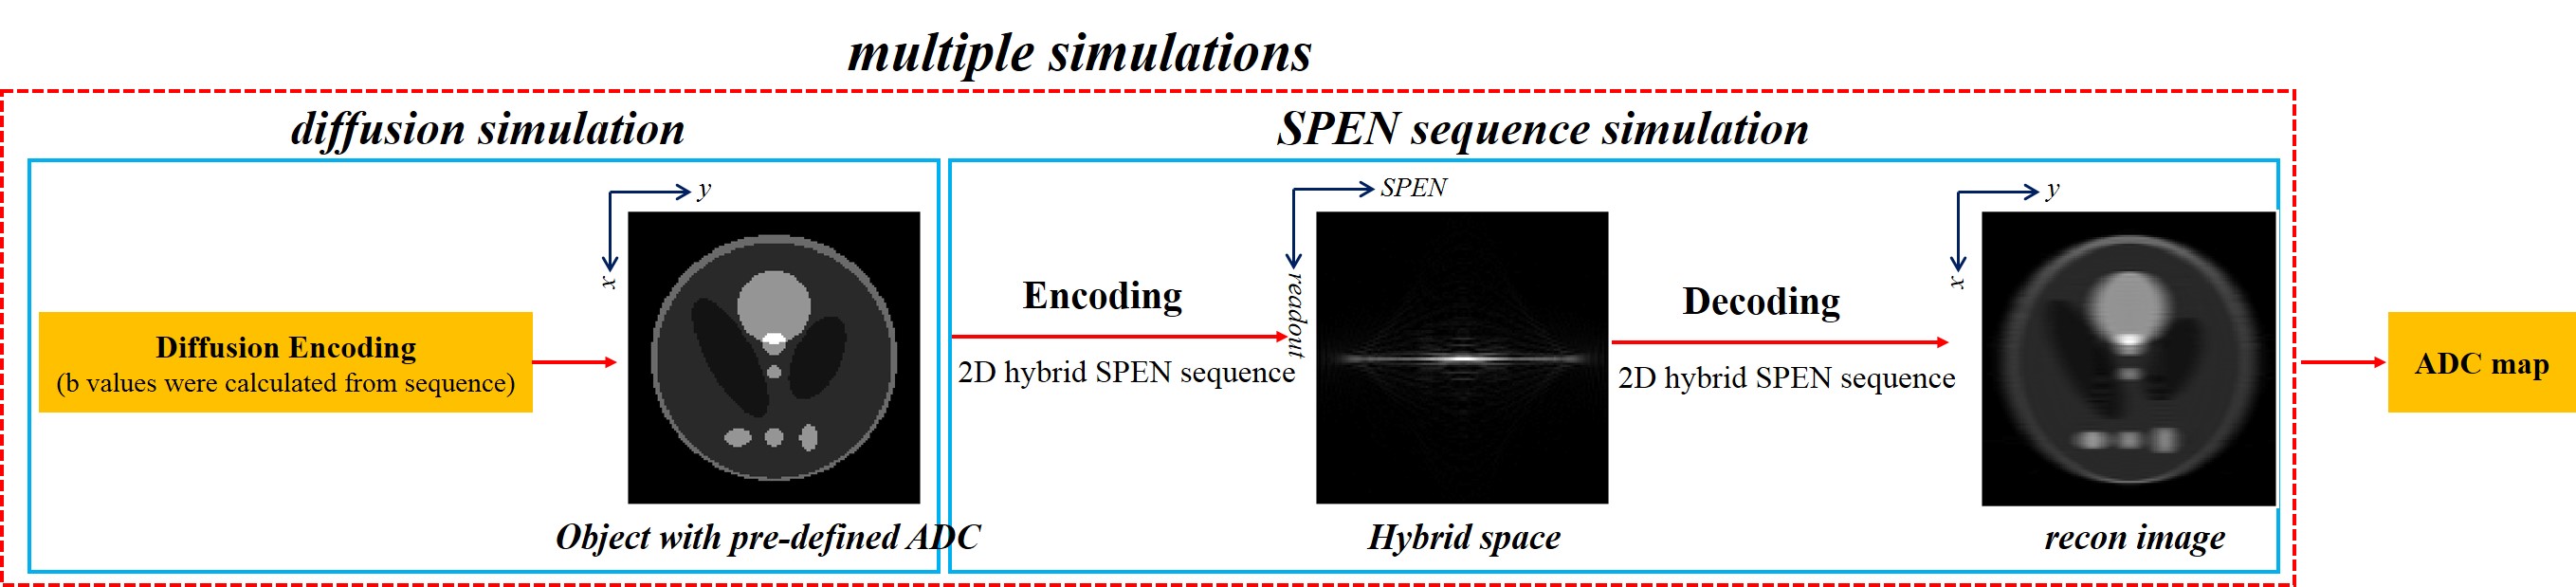
A simulation was designed as shown in Figure 2. The simulated object was encoded by two parts: i) diffusion simulation, in which the ADC values within a circular ROI were pre-defined as 2.10*10-3 mm2/s; and ii) SPEN sequence simulation, which includes spatial encoding and partial Fourier Transform6 along the SPEN-axis, as well as Fourier Transform encoding and inverse Fourier Transform decoding along the readout-axis.
All simulations and real experiments shared the following parameters: field of view (FOV)=220×220 mm2, matrix size=128×128, TR/TE/FA = 3000ms/142ms/90°, 5.0mm slice thickness, 1 slice, diffusion schedule=monopolar, diffusion weightings=2, b-value=[0,800 s/mm2], bandwidth=1502 Hz/Px, echo spacing (ESP)=0.94ms. MR data were acquired on a 3T scanner (MAGNETOM Prisma, Siemens Healthcare, Erlangen, Germany).
Results
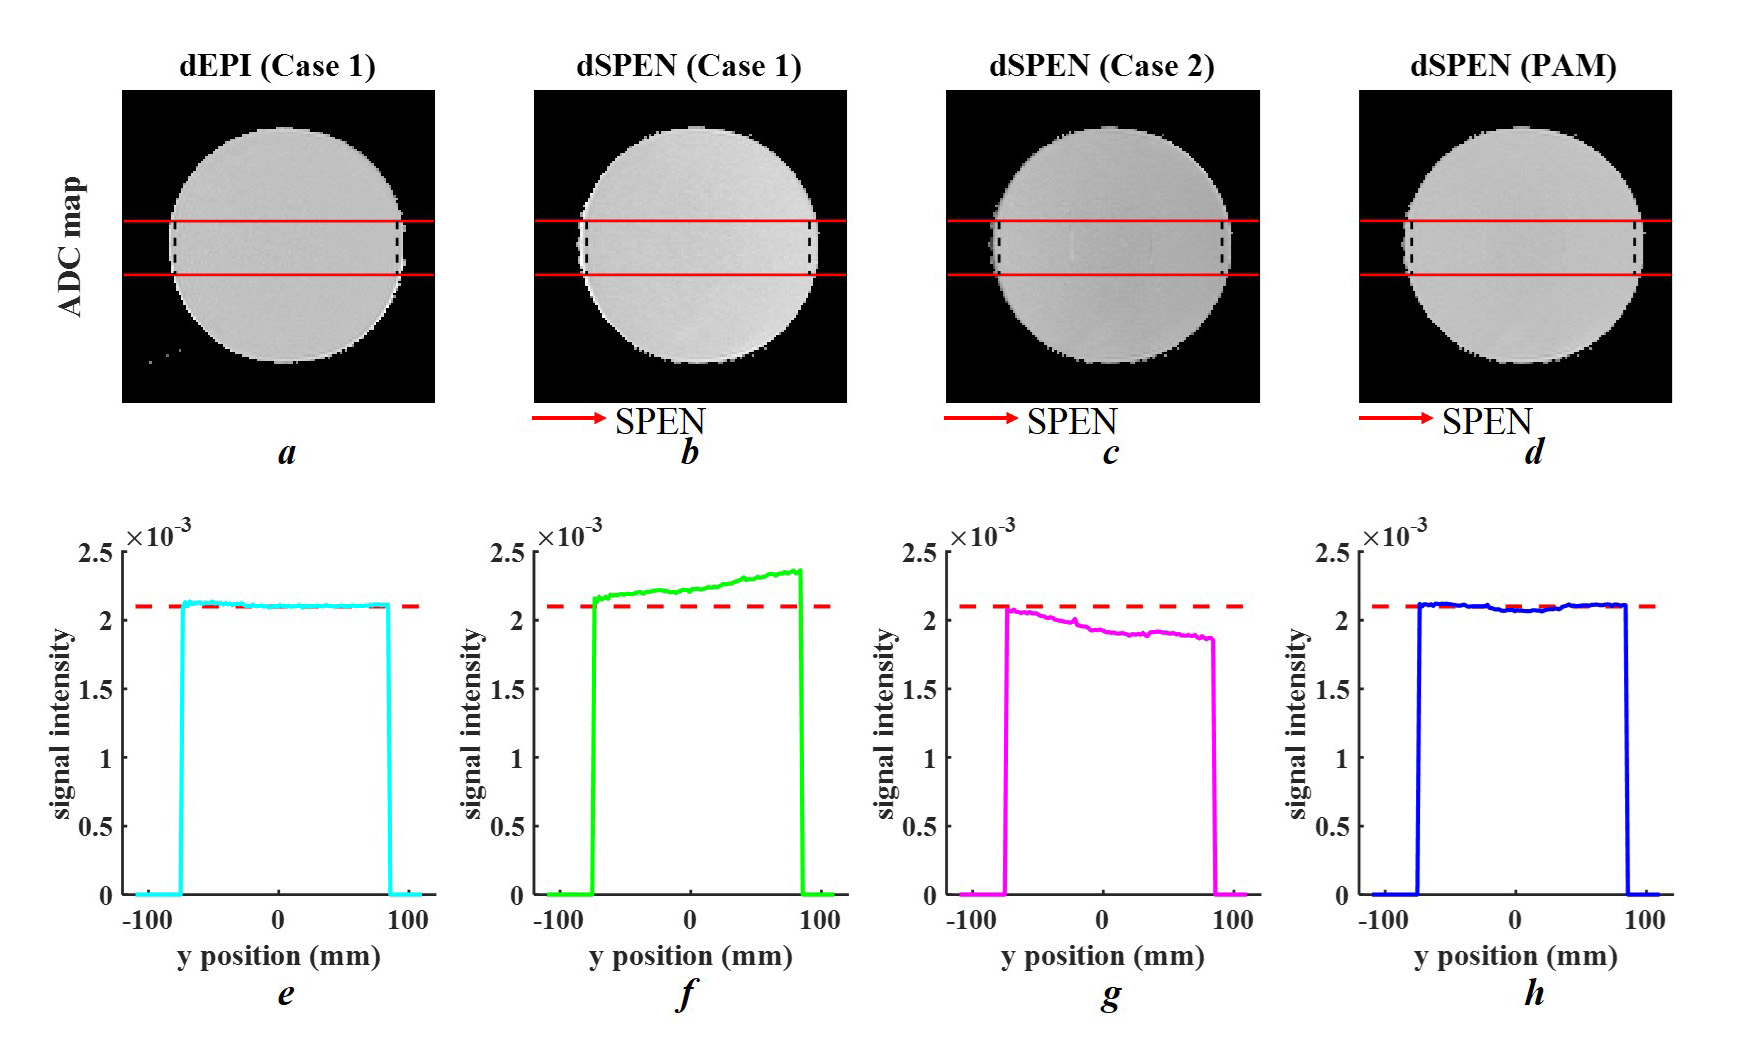
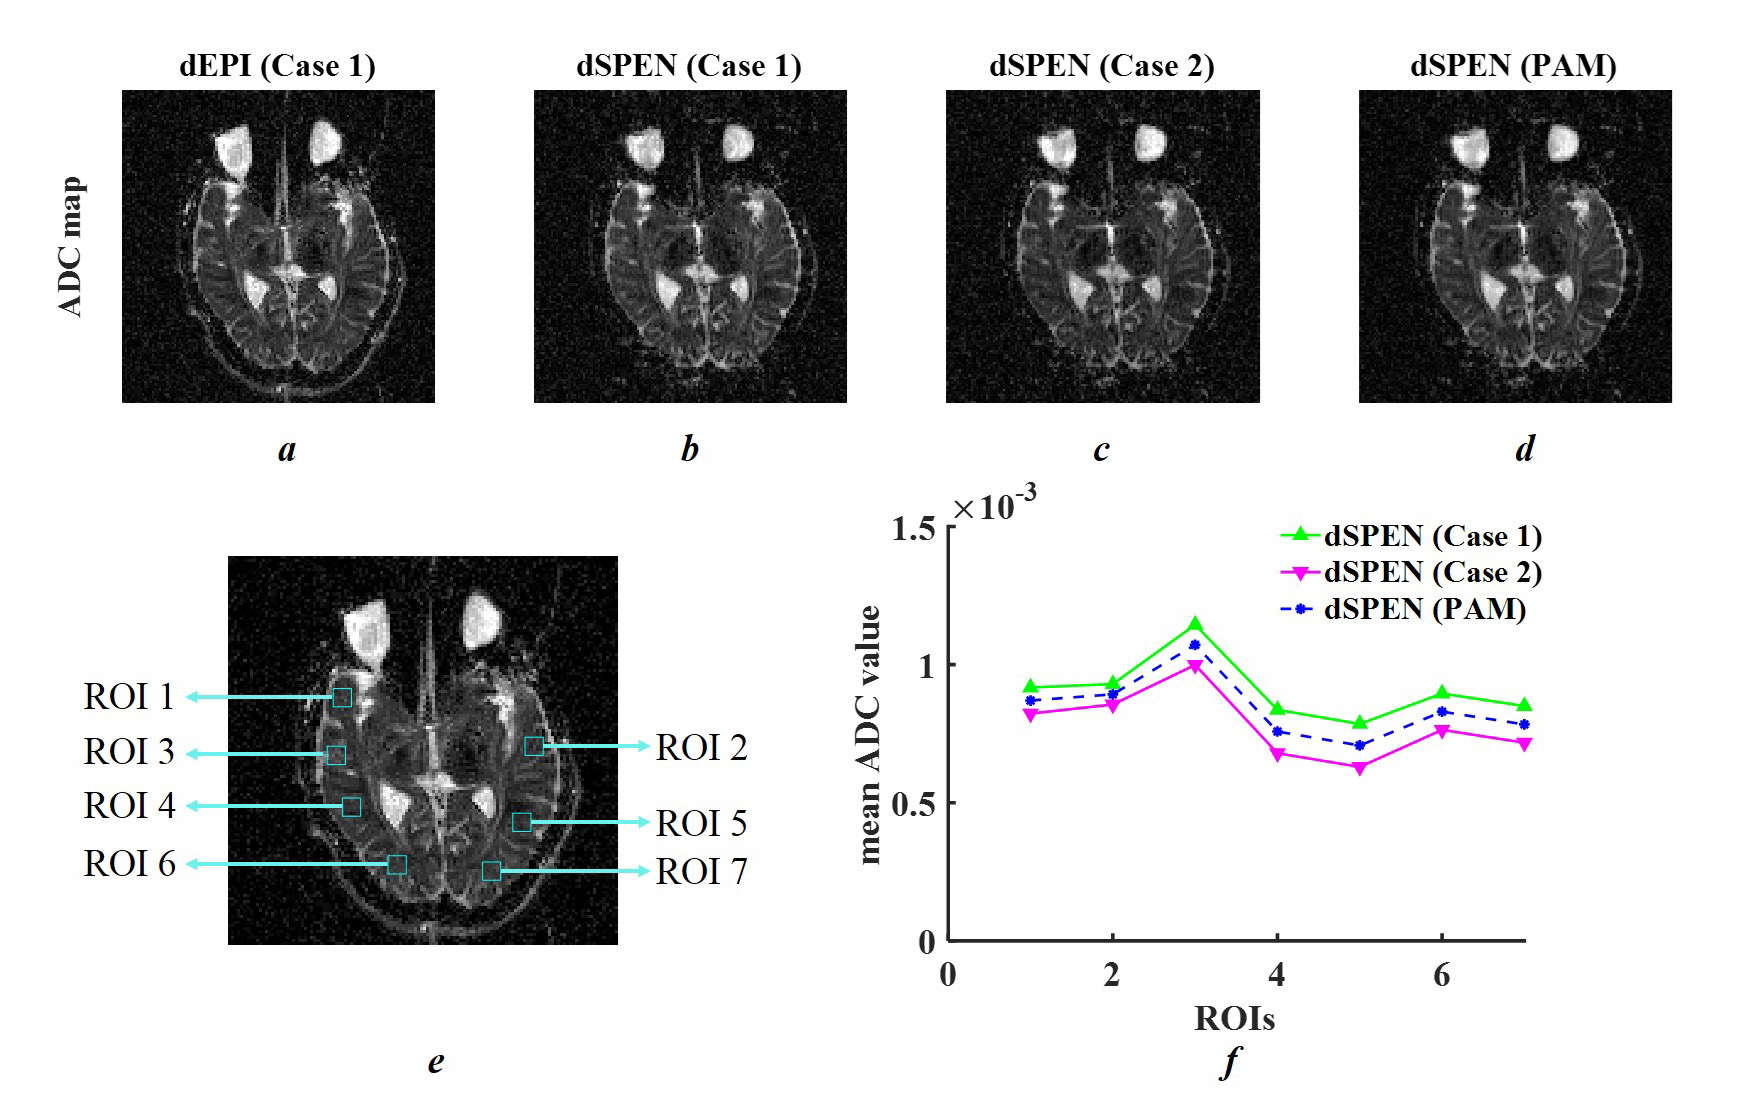
Figure 3 provides simulation results for ADC maps and mean ADC values along the SPEN-axis. The proposed PAM method (Figure 3h) showed excellent performance for the precise assessment of ADC values as dEPI (Figure 3e), where a linear profile caused by the spatial dependency of b-values in SPEN (Figure 3f, g) was corrected. The phantom results (shown in Figure 4) were in strong accordance with the simulation results. Furthermore, brain ADC maps also confirmed that the proposed PAM method mitigated the inaccurate ADC values between those calculated from Case 1 and Case 2 (Figure 5f).Discussion and Conclusion
This study proposes the PAM method to obtain improved image quality of SPEN DWIs and more accurate ADC maps, based on acquiring two scans with opposite directions of diffusion gradient. The method improves image quality of DWIs and provides precise assessment of ADC maps. ADC calculation is easier without spatial-dependent b-value calculation, and it is generally applicable for SPEN sequence protocols. Unlike the widely used AP-PA scheme, DWIs acquired from these two cases do not require distortion correction. Since SPEN diffusion imaging often requires averaging to achieve a proper SNR, there is no extra time wasted even though two acquisitions are required for our method.Acknowledgements
We are grateful to Prof. Lucio Frydman, Dr. Eddy Solomon and Dr. Martins Otikovs for their technical support and insightful discussions on b-value calculation in diffusion SPEN.References
1. Mansfield P. Multi-planar image formation using NMR spin echoes. J Phys C, 1977, 10(3):L55.
2. Ben-Eliezer N, Shrot Y, Frydman L. High-definition, single-scan 2D MRI in inhomogeneous fields using spatial encoding methods. Magnetic Resonance Imaging, 2010, 28(1):77-86.
3. Ben‐Eliezer N, Irani M, Frydman L. Super‐resolved spatially encoded single‐scan 2D MRI. Magnetic Resonance in Medicine, 2010, 63(6):1594-1600.
4. Bammer R. Basic principles of diffusion-weighted imaging. Eur J Radiol 2003; 45:169–184
5. Solomon E, Shemesh N, Frydman L. Diffusion weighted MRI by spatiotemporal encoding: Analytical description and in vivo validations. Journal of Magnetic Resonance, 2013, 232:76-86.
6. Chen Y, Li J, Qu X, et al. Partial Fourier transform reconstruction for single-shot MRI with linear frequency-swept excitation. Magnetic Resonance in Medicine, 2013, 69(5):1326-1336.
Figures