4326
Investigating restricted diffusion within different cortical regions using double-diffusion encoding1Athinoula A. Martinos Center for Biomedical Imaging, Massachusetts General Hospital, Harvard Medical School, Boston, MA, United States
Synopsis
We report the acquisition of whole brain, 2-mm isotropic resolution DDE data in a healthy volunteer using an orientationally invariant sampling scheme and quantify the mean DDE signal intensity across cortical regions as a measure of diffusion restriction within different cortices. Higher mean signal intensities were observed in the cerebellum and limbic cortices, which are thought to reflect a higher degree of restriction in the tissue microstructural environment and may correspond to densely packed, small granule and pyramidal cells known to be present in these regions.
Introduction
Cytoarchitectonic mapping of the human cerebral cortex by diffusion MRI has gained considerable interest in the last few years due to the increasing availability and feasibility of performing advanced diffusion-encoding and modeling to map the microanatomical domains of the brain (1,2). Exploring the cellular organization, packing density and orientation of cellular processes within the cortex by diffusion MRI poses several challenges, including the diminished anisotropy observed in cortical gray matter compared to white matter and partial volume effects related to large voxel sizes. Microscopic diffusion anisotropy can be probed using double diffusion encoding (DDE) and may enable the distinction of microanatomical domains characterized by randomly oriented compartments of variable size and shape (3-9). Recent work has demonstrated evidence of microscopic anisotropy in human cortical gray matter in vivo using protocols that covered only a single axial slice of the brain at 3 mm isotropic resolution in healthy volunteers (10). The goal of this work was to explore the differences in restricted diffusion in different cortical regions mapped using DDE versus SDE at 2 mm isotropic resolution throughout the whole brain.Methods
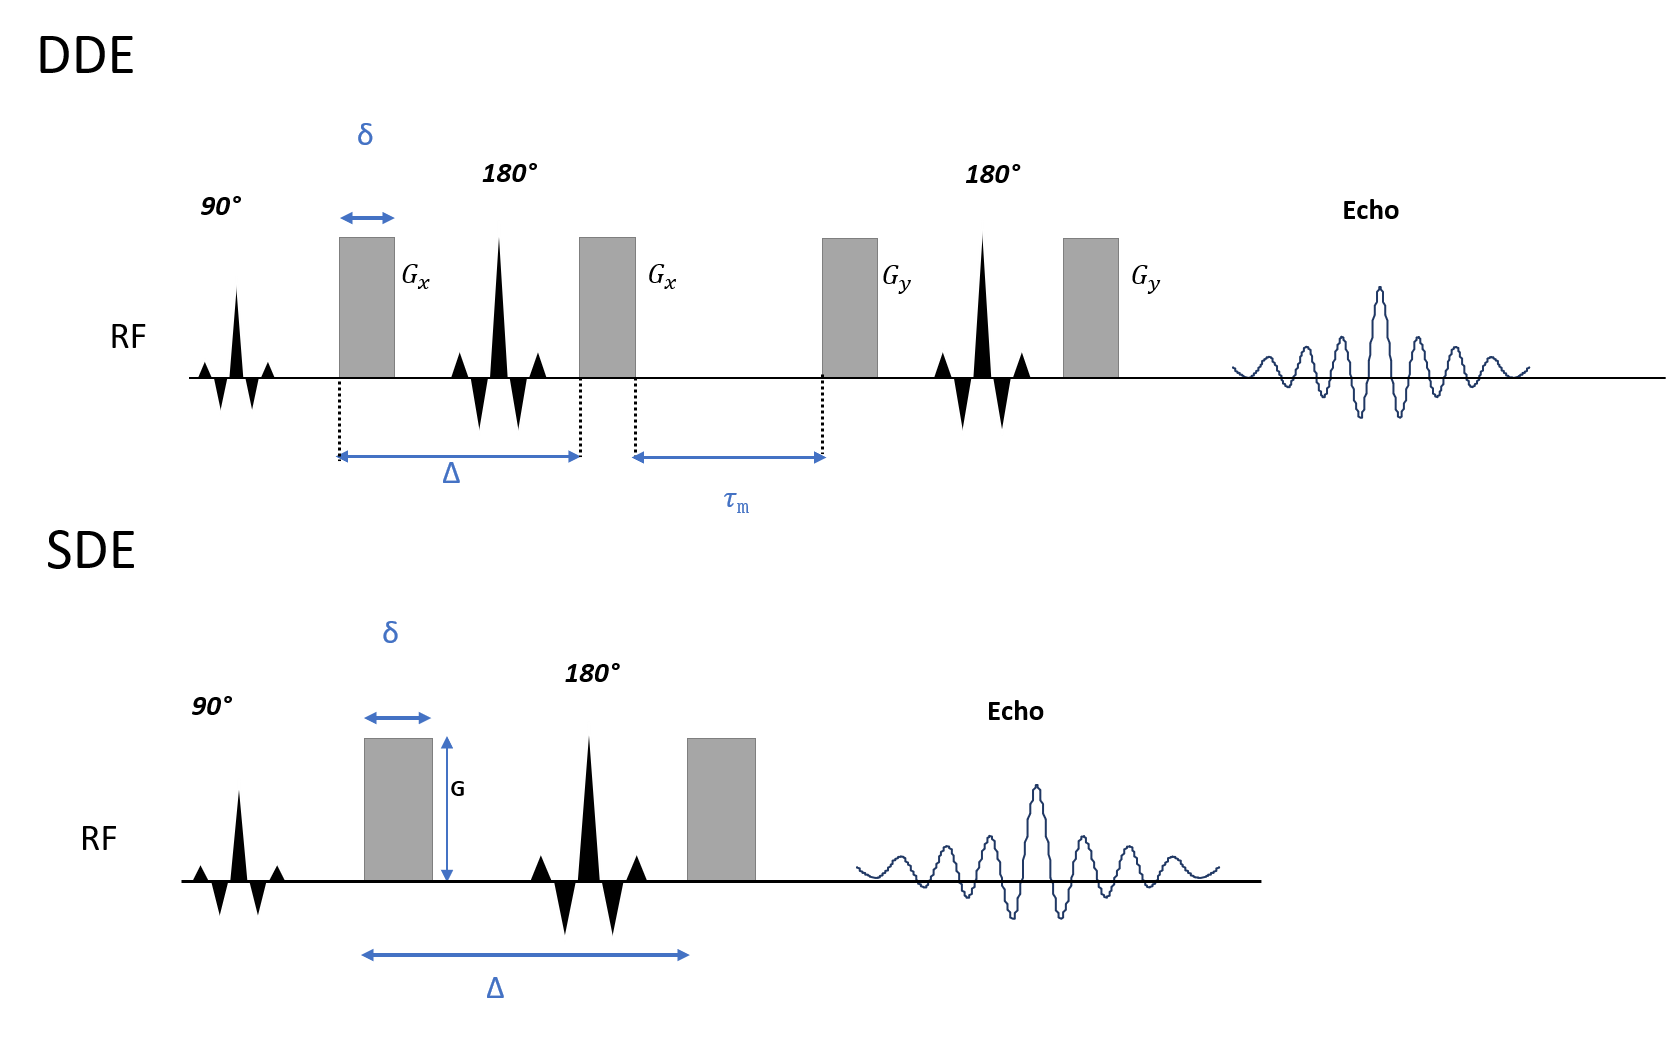
Data acquisition: Diffusion MRI data were acquired in a healthy adult volunteer on the dedicated high-gradient 3T Connectome scanner (MAGNETOM Connectom, Siemens) equipped with 300 mT/m maximum gradient strength and maximum slew rate of 200 T/m/s, using a custom-built 64-channel head coil. Double diffusion-encoding MRI was performed using a fully balanced twice-refocused DDE sequence (Figure 1), in which each diffusion block had an equal magnitude of q (δ=6 ms, Δ=13 ms, G=226.23 mT/m, q=0.0395 μm-1, b=800 s/mm2), and the diffusion blocks were separated by a mixing time of 15 ms. A total of 60 directions were acquired following the dPFG-5 scheme (11) (12 axes of an icosahedron sampled with 5 perpendicular directions for a total of 60 perpendicular encodings) as well as 12 interspersed b=0 images. The readout module consisted of 2 mm isotropic resolution echo planar imaging with 220 mm FOV, matrix size of 110, partial Fourier 6/8, and TR/TE=10,100/102ms. Images were acquired in the axial plane with anterior-to-posterior (AP) and posterior-to-anterior (PA) phase encoding in two separate acquisitions, with 70 slices to achieve whole-brain coverage. The scan time for each DDE acquisition was 14 min 39 s. For comparison, an SDE sequence with diffusion-encoding parameters of δ=8 ms, Δ=19 ms, and b-value=1600 s/mm2 was acquired with 32 diffusion-encoding directions. Image readout was performed with 2D EPI with matched FOV and spatial resolution to the DDE acquisition and TR/TE=4000/46 ms. T1-weighted multi-echo MPRAGE images were acquired at 1 mm isotropic resolution. One b=0 image with reversed phase encoding direction was acquired for susceptibility distortion correction.Data preprocessing: DDE: The second set of diffusion encoding directions was used for eddy current correction. Both AP and PA phase encoding datasets were fed into EDDY to obtain a single combined dataset. All 60 diffusion volumes with perpendicular diffusion-encoding pairs were extracted and averaged, then divided by the b=0 image to obtain a normalized mean DWI image. SDE: Diffusion weighted images (DWIs) were corrected for susceptibility distortions and eddy currents using FSL. 32 DWI images were extracted and averaged, followed by normalization by b=0 image. Cortical surface reconstruction: Cortical surfaces were obtained from FreeSufer reconstruction (version 6.0). The normalized mean DWI was sampled at 50% cortical depth with trilinear interpolation and rendered on inflated surfaces. The cortical segmentation using the Desikan atlas in FreeSurfer was adopted to calculate ROI-averaged values of mean DWI images. Cerebellar cortices were also included.
Results
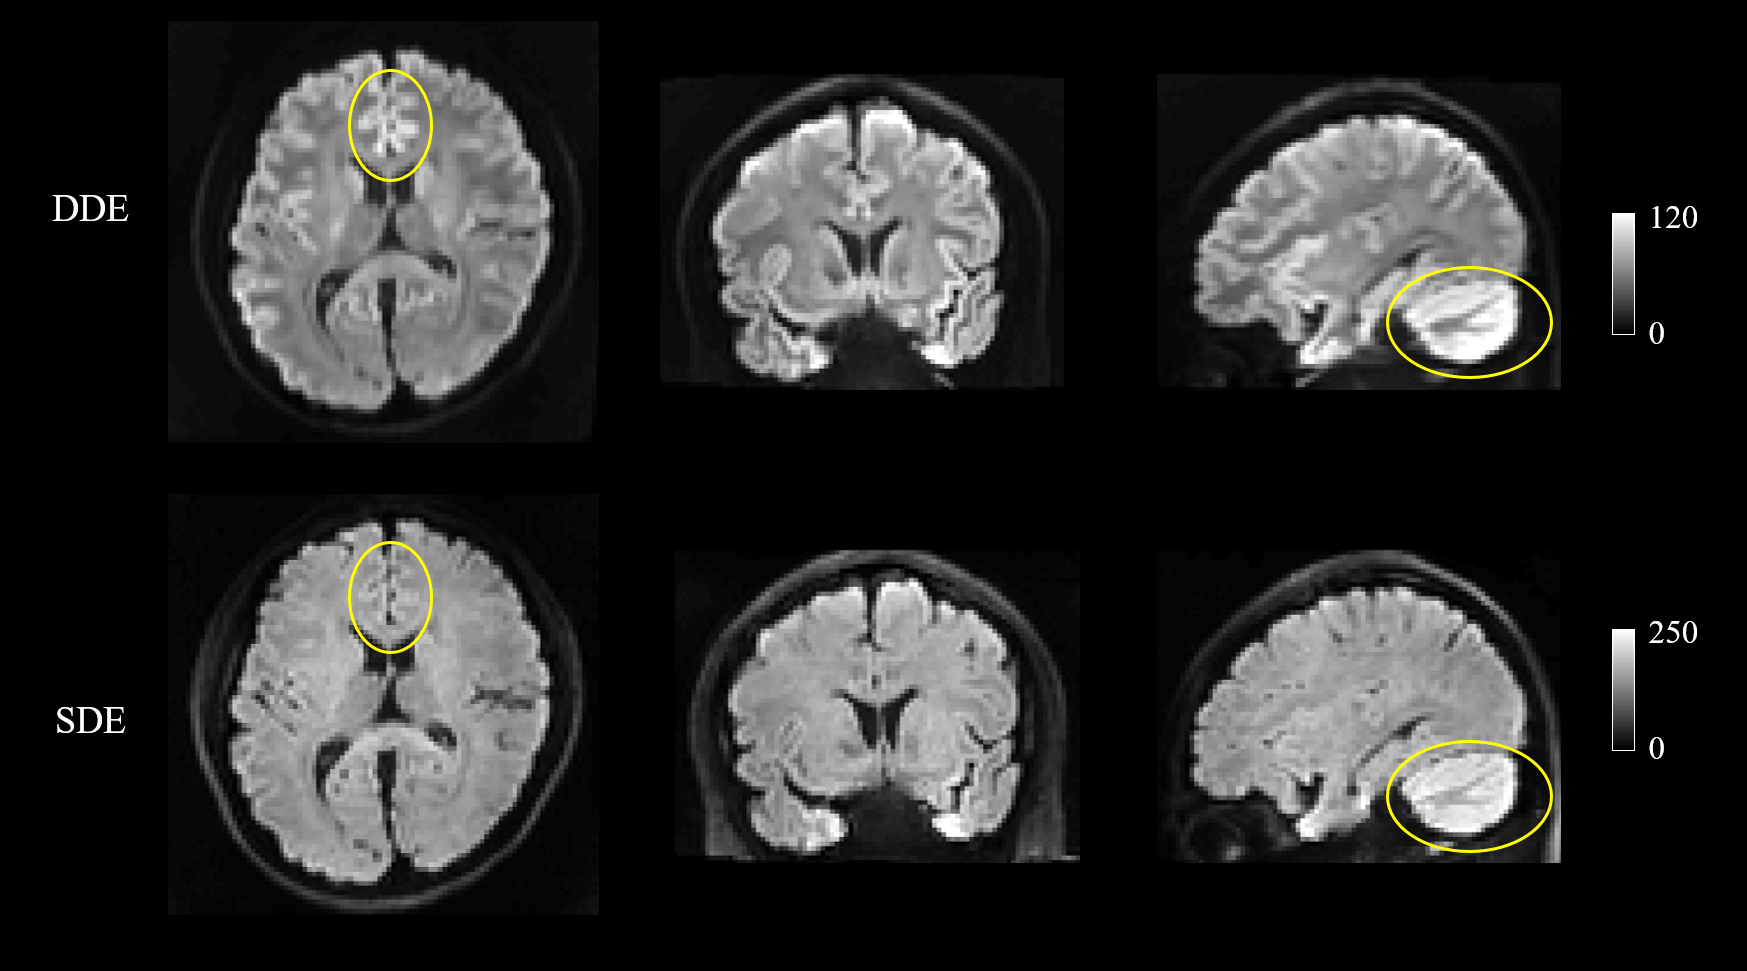
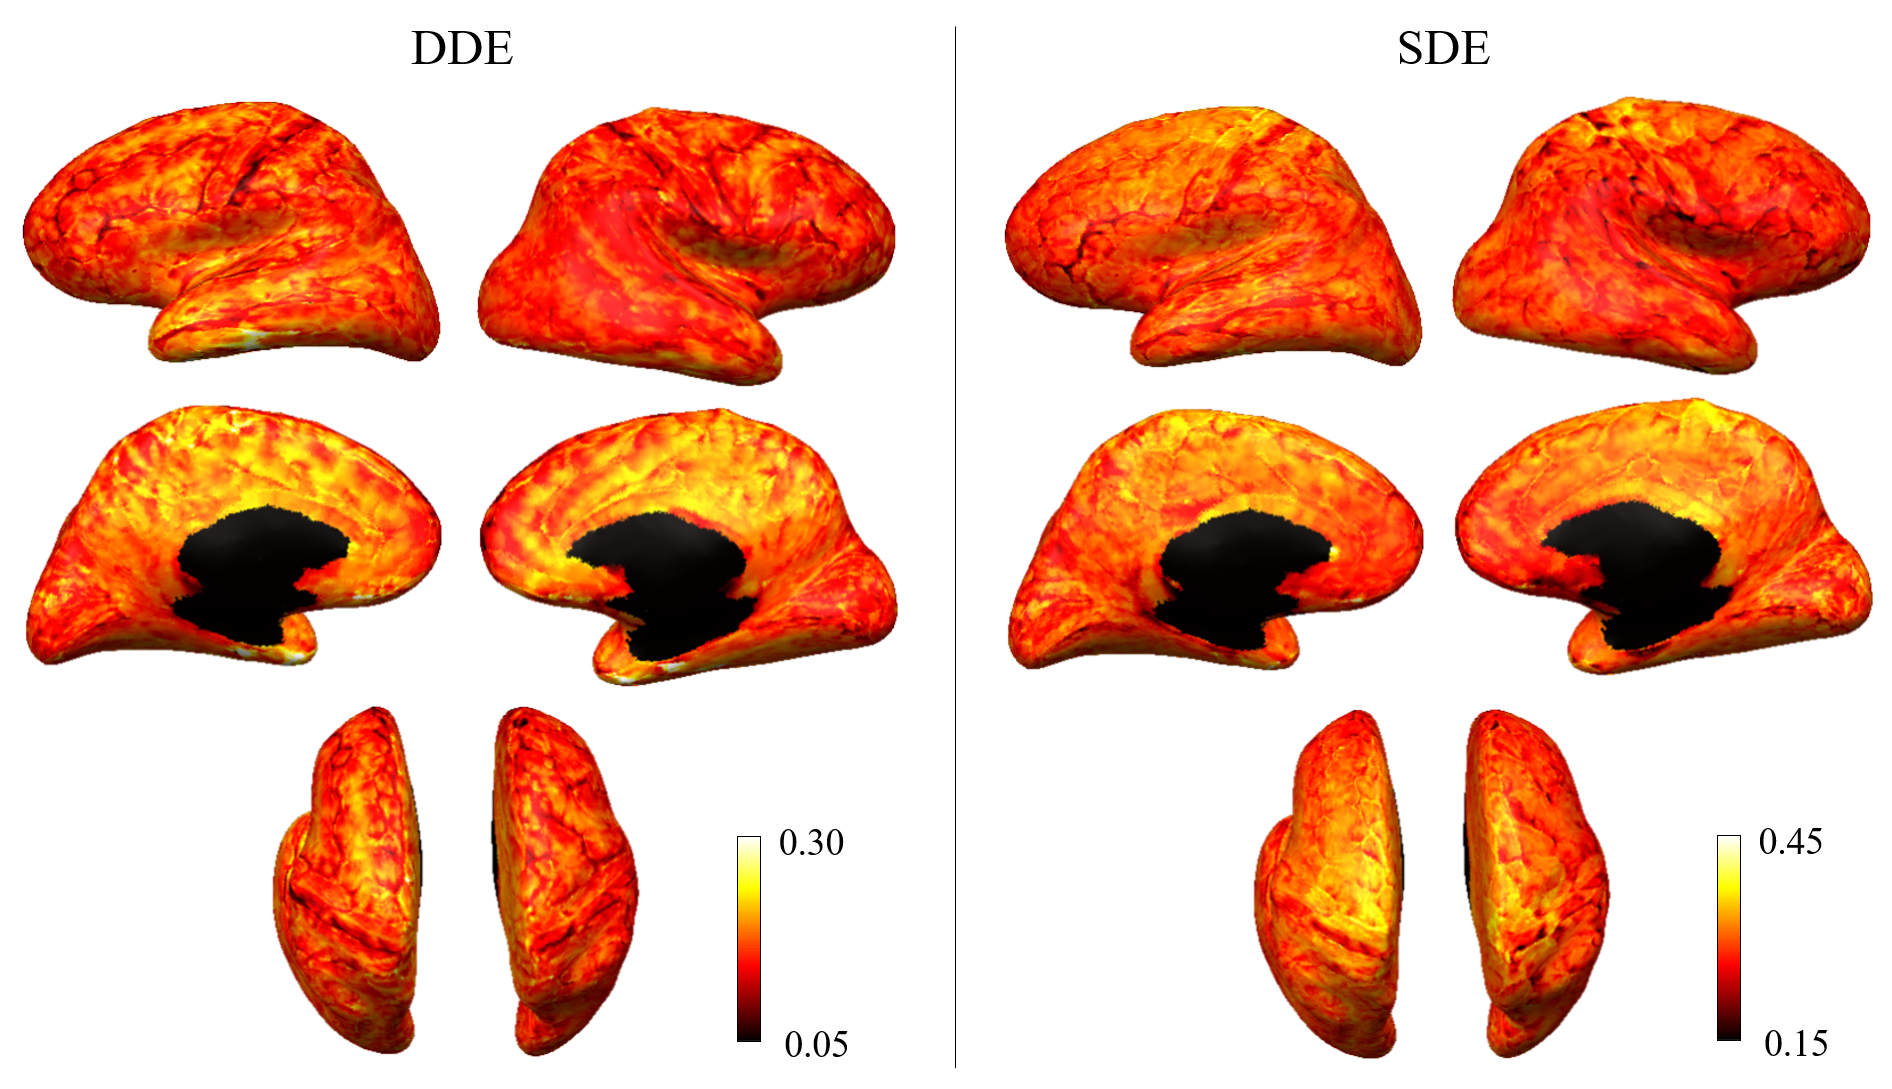
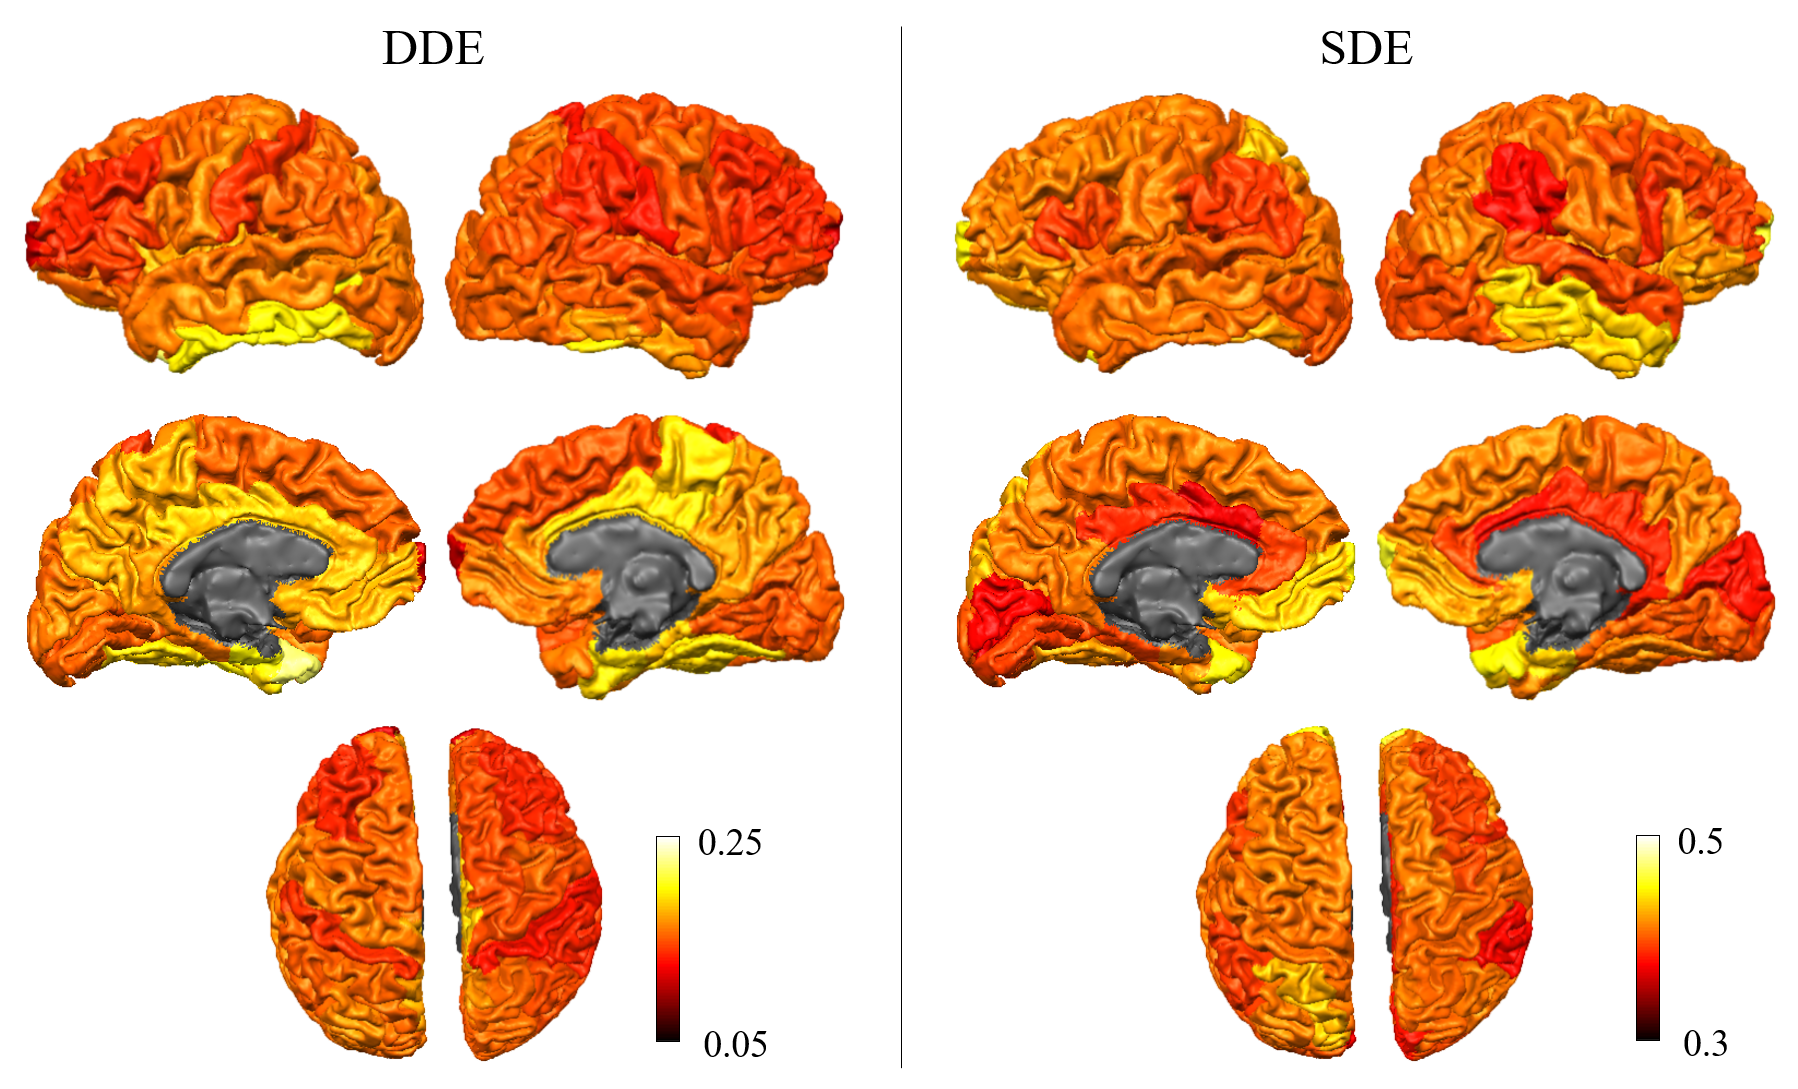
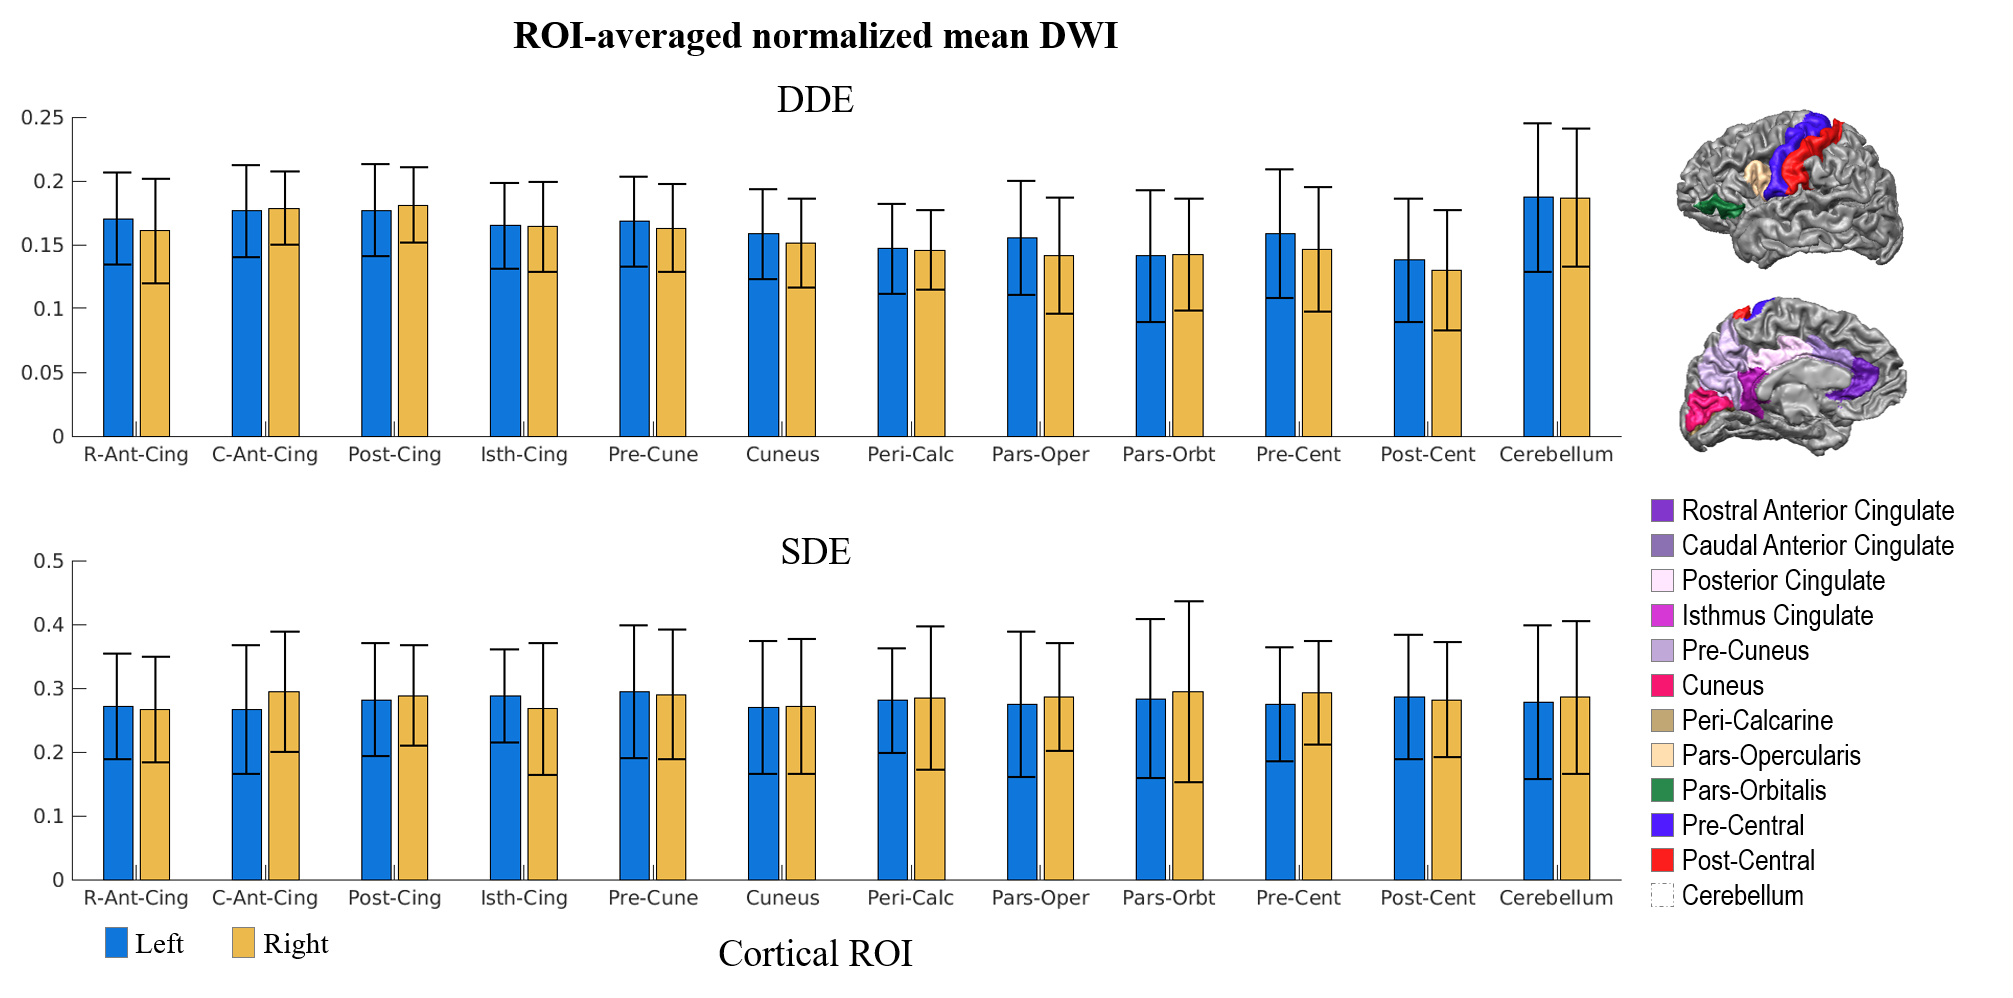
Figure 1 shows representative whole-brain axial, coronal and sagittal views of the mean DWI averaged over all diffusion-encoding directions for the DDE and SDE acquisitions. Higher mean signal was observed in the cerebellum and limbic cortices, e.g., anterior cingulate gyrus, compared to adjacent cortices on DDE. By comparison, the mean DWI images from the SDE showed only slightly higher signal intensity in the cerebellum and relatively uniform signal intensity throughout the cerebral cortex.Figures 2 and 3 show the normalized mean DWI signal sampled at mid-cortical depth and projected on the inflated cortical surface for DDE and SDE acquisitions. Again, relatively higher mean signal intensity was observed for DDE on the medial surfaces of the cerebral hemispheres corresponding to the cingulate gyri, as compared to other cortical regions, including the peri-rolandic gyri, occipital and frontal lobes (Figure 4).
Discussion and Conclusion
We acquired DDE data at 2-mm isotropic resolution throughout the whole brain in a healthy volunteer. The DDE results reveal intriguing contrast with higher mean signal in the cerebellum and limbic cortices, which are thought to reflect a higher degree of restriction in the tissue microstructural environment. The high degree of restriction observed in the cerebellum corroborates findings obtained with spherical tensor encoding at high b-values (12) and may reflect the presence of densely-packed, small granule cells. Similarly, limbic cortices such as the cingulate and entorhinal cortex are known to contain many small, densely-packed pyramidal cells. Future work will extend this acquisition to parallel-encoding directions for DDE to enable the quantification of orientationally-invariant microscopic diffusion anisotropy (11) and push the resolution of image readout through conventional 2D EPI and advanced sub-mm acquisitions such as gSlider (13).Acknowledgements
This work was supported by NIH U01EB026996.References
1. Fischl, B. & Sereno, M. I. Microstructural parcellation of the human brain. NeuroImage 182, 219-231, doi:10.1016/j.neuroimage.2018.01.036 (2018).
2. Palombo, M. et al. SANDI: A compartment-based model for non-invasive apparent soma and neurite imaging by diffusion MRI. arXiv 1907.02832 (2019).
3. Cory, D. G. & Garroway, A. N. Measurement of translational displacement probabilities by NMR: an indicator of compartmentation. Magnetic resonance in medicine : official journal of the Society of Magnetic Resonance in Medicine / Society of Magnetic Resonance in Medicine 14, 435-444, doi:10.1002/mrm.1910140303 (1990).
4. Mitra, P. P. Multiple wave-vector extensions of the NMR pulsed-field-gradient spin-echo diffusion measurement. Phys Rev B Condens Matter 51, 15074-15078, doi:10.1103/physrevb.51.15074 (1995).
5. Shemesh, N., Ozarslan, E., Komlosh, M. E., Basser, P. J. & Cohen, Y. From single-pulsed field gradient to double-pulsed field gradient MR: gleaning new microstructural information and developing new forms of contrast in MRI. NMR in biomedicine 23, 757-780, doi:10.1002/nbm.1550 (2010).
6. Komlosh, M. E. et al. Detection of microscopic anisotropy in gray matter and in a novel tissue phantom using double Pulsed Gradient Spin Echo MR. Journal of magnetic resonance 189, 38-45, doi:10.1016/j.jmr.2007.07.003 (2007).
7. Ozarslan, E. Compartment shape anisotropy (CSA) revealed by double pulsed field gradient MR. Journal of magnetic resonance 199, 56-67, doi:10.1016/j.jmr.2009.04.002 (2009).
8. Shemesh, N., Ozarslan, E., Adiri, T., Basser, P. J. & Cohen, Y. Noninvasive bipolar double-pulsed-field-gradient NMR reveals signatures for pore size and shape in polydisperse, randomly oriented, inhomogeneous porous media. J Chem Phys 133, 044705, doi:10.1063/1.3454131 (2010).
9. Lawrenz, M. & Finsterbusch, J. Detection of microscopic diffusion anisotropy on a whole-body MR system with double wave vector imaging. Magnetic resonance in medicine : official journal of the Society of Magnetic Resonance in Medicine / Society of Magnetic Resonance in Medicine 66, 1405-1415, doi:10.1002/mrm.22934 (2011).
10. Lawrenz, M. & Finsterbusch, J. Detection of microscopic diffusion anisotropy in human cortical gray matter in vivo with double diffusion encoding. Magnetic resonance in medicine : official journal of the Society of Magnetic Resonance in Medicine / Society of Magnetic Resonance in Medicine 81, 1296-1306, doi:10.1002/mrm.27451 (2019).
11. Jespersen, S. N., Lundell, H., Sonderby, C. K. & Dyrby, T. B. Orientationally invariant metrics of apparent compartment eccentricity from double pulsed field gradient diffusion experiments. NMR in biomedicine 26, 1647-1662, doi:10.1002/nbm.2999 (2013).
12. Tax, C. M., Szczepankiewicz, F., Nilsson, M. & Jones, D. K. The dot-compartment revealed? Diffusion MRI with ultra-strong gradients and spherical tensor encoding in the living human brain. bioRxiv https://doi.org/10.1101/584730 (2019).
13. Setsompop, K. et al. High-resolution in vivo diffusion imaging of the human brain with generalized slice dithered enhanced resolution: Simultaneous multislice (gSlider-SMS). Magnetic resonance in medicine : official journal of the Society of Magnetic Resonance in Medicine / Society of Magnetic Resonance in Medicine, doi:10.1002/mrm.26653 (2017).
Figures