4324
Implementation of a Diffusion-Weighted Echo Planar Imaging sequence using the Open Source Hardware-Independent PyPulseq Tool1Instituto Superior Técnico, Lisbon, Portugal, 2Columbia University Magnetic Resonance Research Center, New York, NY, New York, NY, United States
Synopsis
Diffusion-weighted imaging is an essential sequence for many clinical applications. While the post-processing tools for diffusion are widely available, vendor-neutral, open-source acquisition implementations have not been shared for research purposes. We develop a cross-vendor, open source package of a multi-slice single-shot spin echo-planar imaging based diffusion pulse sequence, capable of multiple b values and directions. We demonstrate this on an in vitro phantom, measuring plausible Apparent Diffusion Coefficient values and in vivo human brain data, obtaining good quality Fractional Anisotropy and Mean Diffusivity maps. We process our data with freely available post-processing tools to generate quantitative diffusion maps.
Introduction
Diffusion-weighted imaging (DWI) provides a key type of contrast for many clinical applications, including stroke and tumour characterization1. Recently, a tool for cross-platform pulse sequence development (PSD) has been introduced (Pulseq)2 which enables to apply the same imaging protocol in hardware systems manufactured by different vendors; this can be helpful to reduce variability in multi-centric studies. Importantly, it also provides an environment for performing PSD for in-house built MRI systems. One of the limitations of Pulseq is that it is based on the commercial software Matlab. To address this issue, and since there is currently a growing interest in developing open-source solutions for MR imaging (e.g. www.opensourceimaging.org), an alternative implementation is being developed using the free Python coding language - PyPulseq3. Many sequences have been provided as examples by the developers of these tools (Pulseq or PyPulseq), including Echo Planar Imaging (EPI), but no implementation of DWI had yet been provided. We implemented a DWI sequence using the PyPulseq software tool, and made it available to the community. Among other applications, we expect that in the future it can be used as a starting point for PSD in the context of accessible low-field stroke imaging4.Methods
A single-shot spin echo-planar imaging (EPI) diffusion-weighted sequence was implemented using the PyPulseq software3. The DWI sequence code can be obtained from https://github.com/ritagnunes/PulseqDiffusion, and the PyPulseq functions downloaded from https://github.com/imr-framework/pypulseq. The sequence includes a Fat Suppression RF pulse, a partial Fourier readout and is applicable to multi-slice imaging (acquired in interleaved order). Three options were implemented for the number of gradient directions: 3, 12 and 60. These were optimally distributed using the gen_scheme function, part of the software MRtrix35. The possibility to acquire multiple b-value shells was also implemented.The sequence was tested on a 3.0 T Siemens Prisma Fit scanner using a 64-channel head coil using the Autonomous MRI-Scanner as an Online Service (AMRI-SOS) - https://github.com/imr-framework/amri. The sequence files were uploaded using an online form and the type of phantom and coil were selected. These files were created taking into account the system characteristics, such as the maximum gradient amplitude (32mT/m) and slew rate (130 T/m/s), as well as the RF ringdown and dead times ( 30𝜇s and 100𝜇s, respectively). The raw data was exported and image reconstruction was performed off-line using in-house scripts implemented in Matlab R2016a, including EPI ghost correction from a non-phase encoded volume, Homodyne partial Fourier reconstruction and sum-of-squares combination of the individual coil images. The reconstruction code is provided in the same repository as the sequences.The sequence was first tested on a water bottle phantom, using a sequence with 5 different b-values (200:200:1000 mm2/s) applied along 3 directions and including a non-diffusion weighted image. Spatial resolution was 2.5x2.5x2.5 mm3 and in-plane field of view (FOV) 240x240 mm2, with a partial Fourier factor of 75%, TE=114 ms and TR=5s. The apparent diffusion coefficients (ADC) along all three directions were evaluated applying linear regression to the logarithm of the signal to check calculated b-values were correct.Results
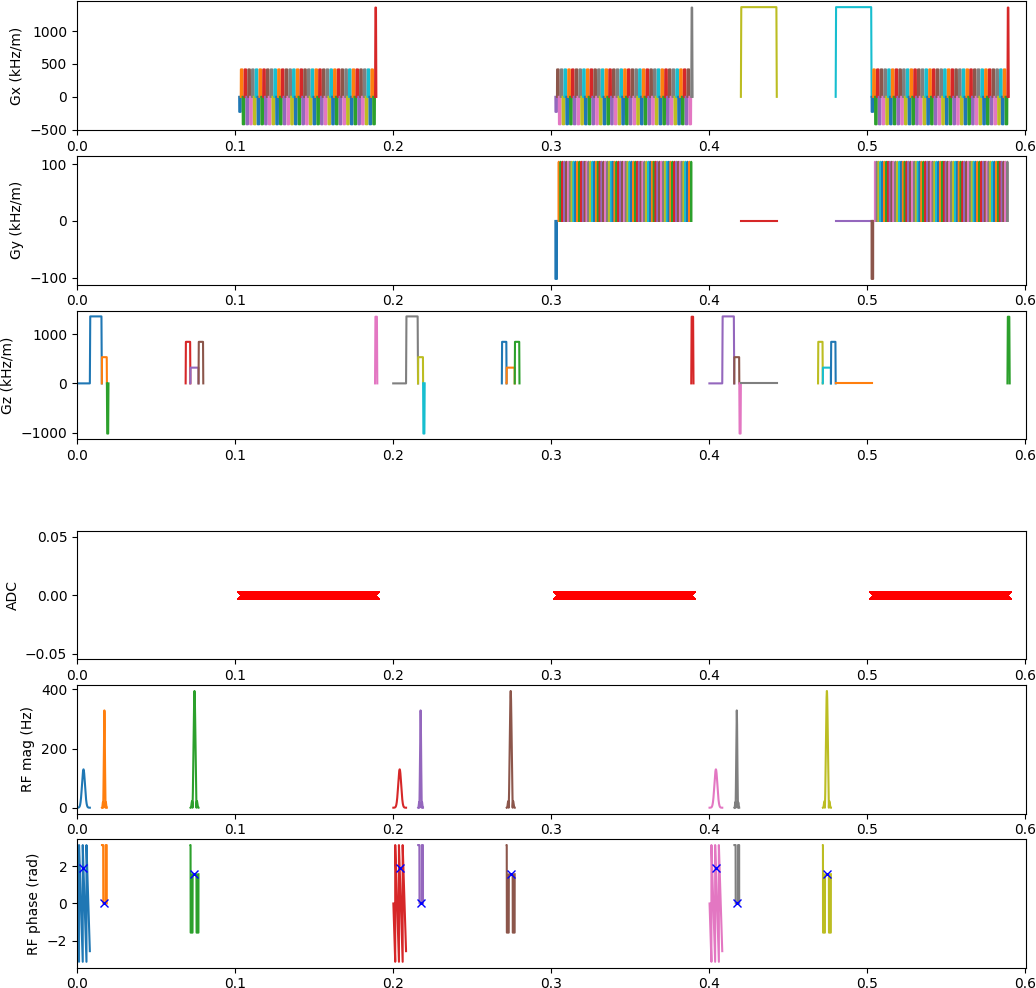
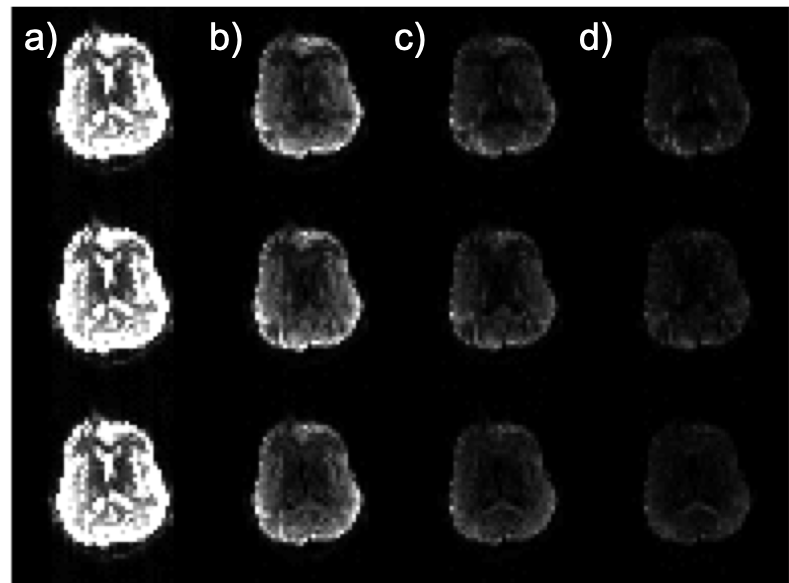
A graphical representation of the implemented sequence is presented in Figure 1 - for a single-slice, close to minimum TR, two b-values (0, 1000 s/mm2), sampling three orthogonal directions.Images obtained in the water phantom are shown in Figure 2, demonstrating mean ADC estimates of the correct order of magnitude compared to the expected value for water at room temperature (2.0x10⁻³ mm2/s). The observed difference could be partly due to contributions from extra gradients to the effective b-value (e.g. refocusing spoilers) and the presence of doping.
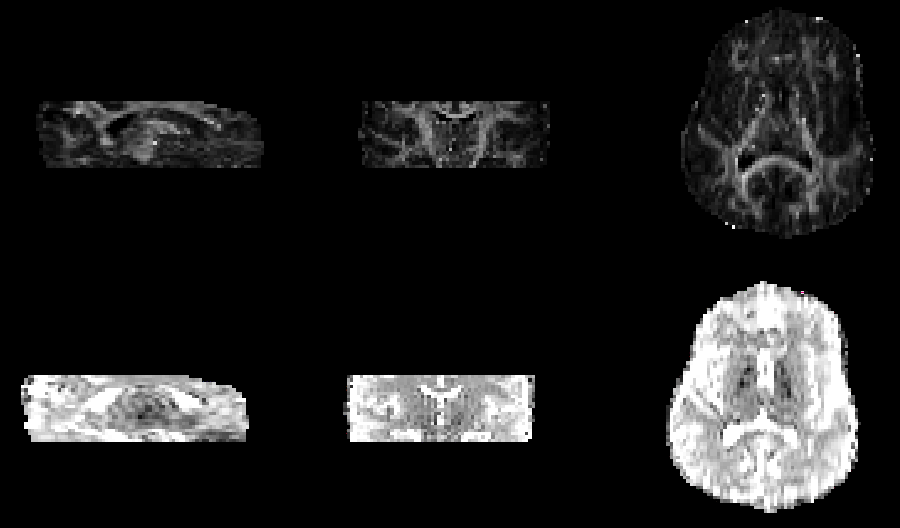
Acquired in-vivo images are shown in Figure 3, while estimated FA and MD maps can be seen in Figure 4.
A colorcoded map showing the principal eigenvector superimposed on FA maps is shown in Figure 5.
Conclusions
A single-shot DWI sequence was successfully implemented using PyPulseq and made available to the community. Future work includes the implementation of eddy-current compensated diffusion modules as well as alternative image readout schemes such as spiral imaging.Acknowledgements
Portuguese Foundation for Science and Technology (FCT) - Indo-Portuguese Programme for Cooperation in Science & Technology, 2017-2019 and grants (UID/EEA/50009/2019 and SFRH/BSAB/150270/2019). Zuckerman Institute Technical Development Grant for MR, Zuckerman Mind Brain Behavior Institute,Grant Number: CU-ZI-MR-T-0002.References
1. Schellinger, P. D., R. N. Bryan, L. R. Caplan, J. A. Detre, R. R. Edelman, C. Jaigobin, C. S. Kidwell et al. "Evidence-based guideline: the role of diffusion and perfusion MRI for the diagnosis of acute ischemic stroke: report of the Therapeutics and Technology Assessment Subcommittee of the American Academy of Neurology." Neurology 75, no. 2 (2010): 177-185.
2.Ravi, K., Potdar, S., Poojar. P, Reddy, A., Kroboth, S., Nielsen, J., Zaitsev, M., Venkatesan, R & Geethanath, S. (2018). Pulseq-Graphical Programming Interface: Open source visual environment for prototyping pulse sequences and integrated magnetic resonance imaging algorithm development. Magnetic resonance imaging 52: 9-15.
3. Ravi, K., Geethanath, S., and John Thomas Vaughan Jr. PyPulseq: A Python Package for MRI Pulse Sequence Design. 10.21105/joss.01725
4. Layton, K., Kroboth, S., Jia, F., Littin, S., Yu, H., Leupold, J., Nielsen, J., Stöcker, T., Zaitsev, M. (2017) Pulseq: a rapid and hardware‐independent pulse sequence prototyping framework. Magnetic resonance in medicine 77(4):1544-1552.
5. J.-D. Tournier, R. E. Smith, D. Raffelt, R. Tabbara, T. Dhollander, M. Pietsch, D. Christiaens, B. Jeurissen, C.-H. Yeh, and A. Connelly. (2019) MRtrix3: A fast, flexible and open software framework for medical image processing and visualisation. NeuroImage, 202:116–37.6. Jenkinson, M., Beckmann, C., Behrens, T., Woolrich, M., Smith, S. (2012) FSL. NeuroImage, 62:782-790.
Figures