4322
Ultra-high b-value single-shot echo planar diffusion-weighted imaging with Compressed SENSE1Diagnostic Imaging and Nuclear Medicine, Tokyo Women's Medical University, Tokyo, Japan, 2Philips Japan, Tokyo, Japan
Synopsis
High b-value single-shot echo planar diffusion-weighted imaging (EPI-DWI) has been expected to provide more detail information about brain structure and diseases. However, higher b-value causes lower image quality due to an increase in noise-like artifacts. Compressed SENSE (C-SENSE), which is a combination of compressed sensing and parallel imaging technique: SENSE is an accelerating scan technique, which includes noise reduction methods. In this study, we revealed that EPI-DWI images with C-SENSE using high b-values (b:1000, 2000, 3000, 4000, 5000 s/mm2) showed higher SNR and ADC values than EPI-DWI images with SENSE.
Introduction
Single-shot echo planar diffusion-weighted imaging (EPI-DWI) and an apparent diffusion coefficient (ADC) map have been widely used for detecting various brain lesions.1, 2It has been reported that high b-value EPI-DWI is more useful to diagnose acute ischemic lesions and for tumor grading of gliomas.3, 4 In addition, ultra-high b-value EPI-DWI shows diffusion differences among brain structure, and it is expected to predict new clinical information.5 However, high b-value EPI-DWI is not commonly used in clinical practice because higher b-value leads to a decrease in signal-to-noise ratio (SNR) and acquisition time extension.
Recently, Compressed SENSE (C-SENSE), which is a combination of compressed sensing and parallel imaging technique: SENSE, has been developed as a new accelerating technique. In addition, it is reported that EPI-DWI with C-SENSE for prostate images was useful for reducing noise-like artifacts.6 Therefore, we expected that a combination of EPI-DWI and C-SENSE for brain images will be effective to increase in SNR while shortening acquisition times.
In this study, we estimated image quality of ultra-high b-value EPI-DWI images with C-SENSE (EPICS).
Subjects and methods
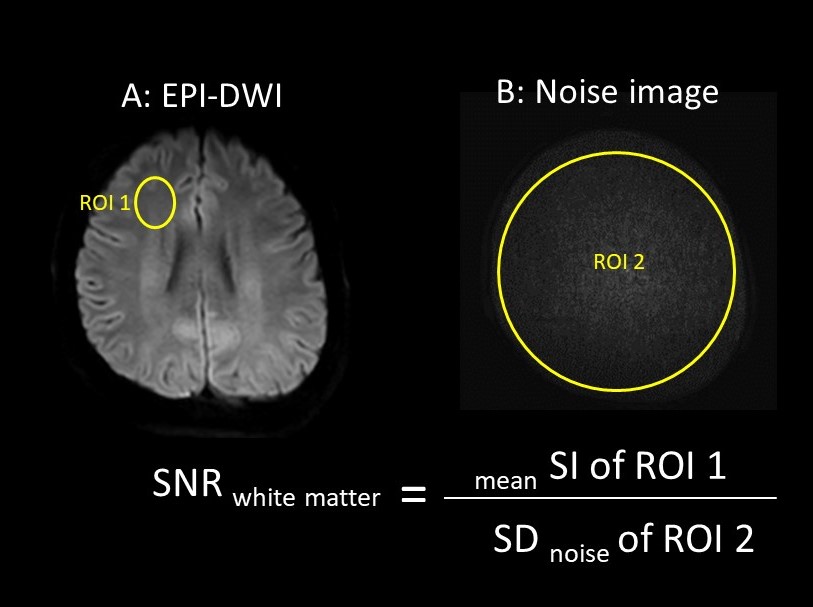
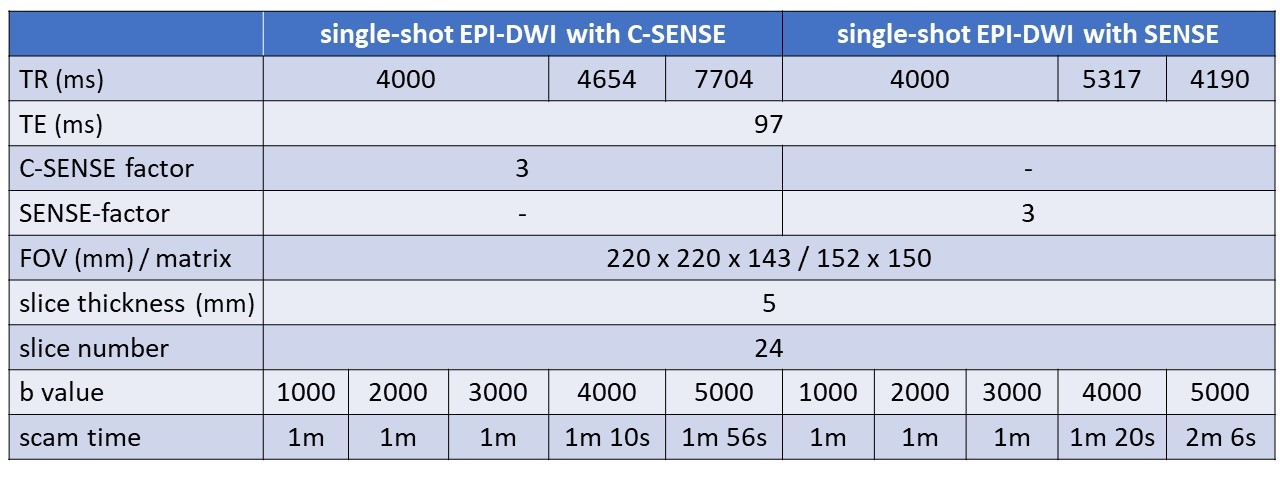
Five healthy volunteers were examined on 3T MR unit (Ingenia 3T, Philips Healthcare). Image quality of EPICS and EPI-DWI images with SENSE (b value: 1000, 2000, 3000, 4000, 5000 s/mm2) were evaluated by comparing SNR and ADC values of them. SNR and ADC values were assessed in the bilateral frontal and parietal white matter. SNR was calculated by a noise measurement method proposed by Zwanenburg et al.7 In this method, EPI-DWI and noise images were obtained in one scan. Each sequence was repeated with exactly the same receiver gain, but without any RF pulses. The noise images showed only noise, including the noise added due to the C-SENSE or SENSE reconstruction. Also, artifacts due to RF pulses were not included in these images. Hence, this method could measure SNR correctly even if the SENSE or C-SENSE reconstruction was used. SNR was calculated as follows: SNR of white matter = mean signal intensity (SI) of white matter / standard deviation (SD) of noise image (Figure 1). The parameters of each EPI-DWI are shown in Table 1. EPICS’ parameters were almost the same as EPI-DWI with SENSE’s ones.Results
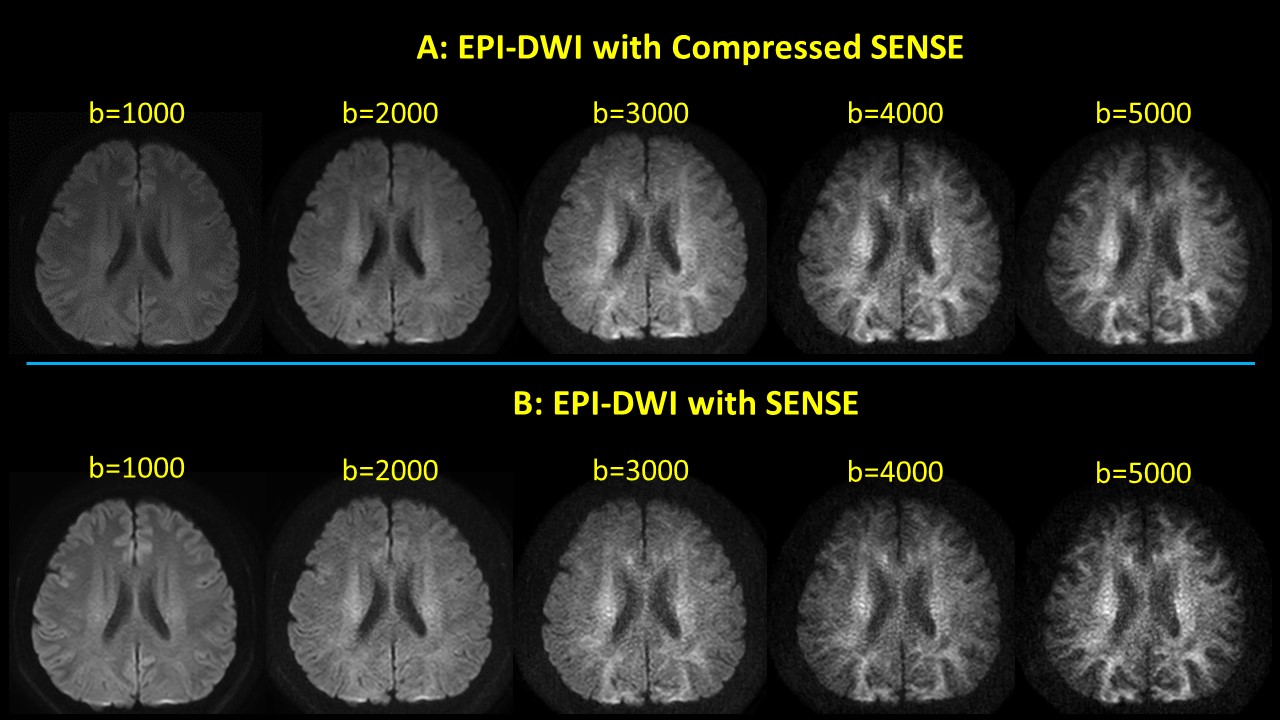
Higher b-value leaded to lower SNR and ADC values on both EPICS and EPI-DWI images with SENSE (Figure 2). SNR of EPICS images with any b-values was significantly higher than EPI-DWI images with SENSE. ADC values of EPICS with b=4000, 5000 s/mm2 were significantly higher than EPI-DWI images with SENSE. The acquisition times of EPICS with b=4000, 5000 s/mm2 were shorter than EPI-DWI with SENSE.Discussion
SNR of EPI-DWI images with SENSE is strongly affected by geometry factor,8 and it was one of the big issues in investigating the utility of conventional ultra-high b-value EPI-DWI. C-SENSE is known as a new accelerating image acquisition technique, and is based on under-sampling and noise reduction methods. In this study, EPICS showed higher SNR and ADC values than EPI-DWI images with SENSE even when using ultra-high b-values. In addition, ultra-high b-value EPICS showed shorter acquisition times. Therefore, we suggested that EPICS will be a routine sequence in our daily MR examinations, instead of EPI-DWI with SENSE.Conclusion
EPICS can provide higher image quality and accurate ADC values. Ultra-high b-value EPICS has the potential to reveal water diffusion movements of water molecules in the brain structure, and will play a vital role to diagnose various brain diseases.Acknowledgements
No acknowledgement found.References
1. Warach S, Gaa J, Siewert B, et al: Acute human stroke studied by whole brain echo planar diffusion‐weighted magnetic resonance imaging. Ann Neurol 37:231-241, 1995
2. Higano S, Yun X, Kumabe T, et al. Malignant astrocytic tumors: clinical importance of apparent diffusion coefficient in prediction of grade and prognosis. Radiology 2006; 241:839–846
3. Cihangiroglu M, Citci B, Kilickesmez O, et al. The utility of high b-value DWI in evaluation of ischemic stroke at 3T. Eur J Radiol 78:75–81, 2011.
4. Seo HS, Chang KH, Na DG, et al. High b-value diffusion (b = 3000 s/mm2) MR imaging in cerebral gliomas at 3T: visual and quantitative comparisons with b = 1000 s/mm2. AJNR Am J Neuroradiol 29:458-63, 2009.
5. Niendorf T, Dijkhuizen RM, Norris DG, et al. Biexponential diffusion attenuation in various states of brain tissues: implications for diffusion-weighted imaging. Magn Reson Med 36:847–857, 1996
6. Yoneyama M, et al. Noise Reduction in Prostate Single-Shot DW-EPI utilizing Compressed SENSE Framework. Proc. ISMRM. 2019:1634.
7. Zwanenburg JJ, Hendrikse J, Takahara T, et al. MR Angiography of the cerebral perforating arteries with magnetization prepared anatomical reference at 7T: comparison with time-of-flight. J Magn Reson Imaging 28:1519–1526, 2008.
8. Pruessmann KP, Weiger M, Scheidegger MB, et al. SENSE: sensitivity encoding for fast MRI. Magn Reson Med 42:952–962, 1999.
Figures