4318
Automatic no-reference image quality evaluation of DWI in uterine malignancy at 3T with iShim, RESOLVE, and ss-EPI sequences – a feasibility study1Department of Imaging Diagnosis, National Cancer Center/Cancer Hospital, Chinese Academy of Medical Science and Peking Union Medical College, Beijing, China, 2MR Scientific Marketing, Diagnostic Imaging, Siemens Healthcare Ltd, Beijing, China
Synopsis
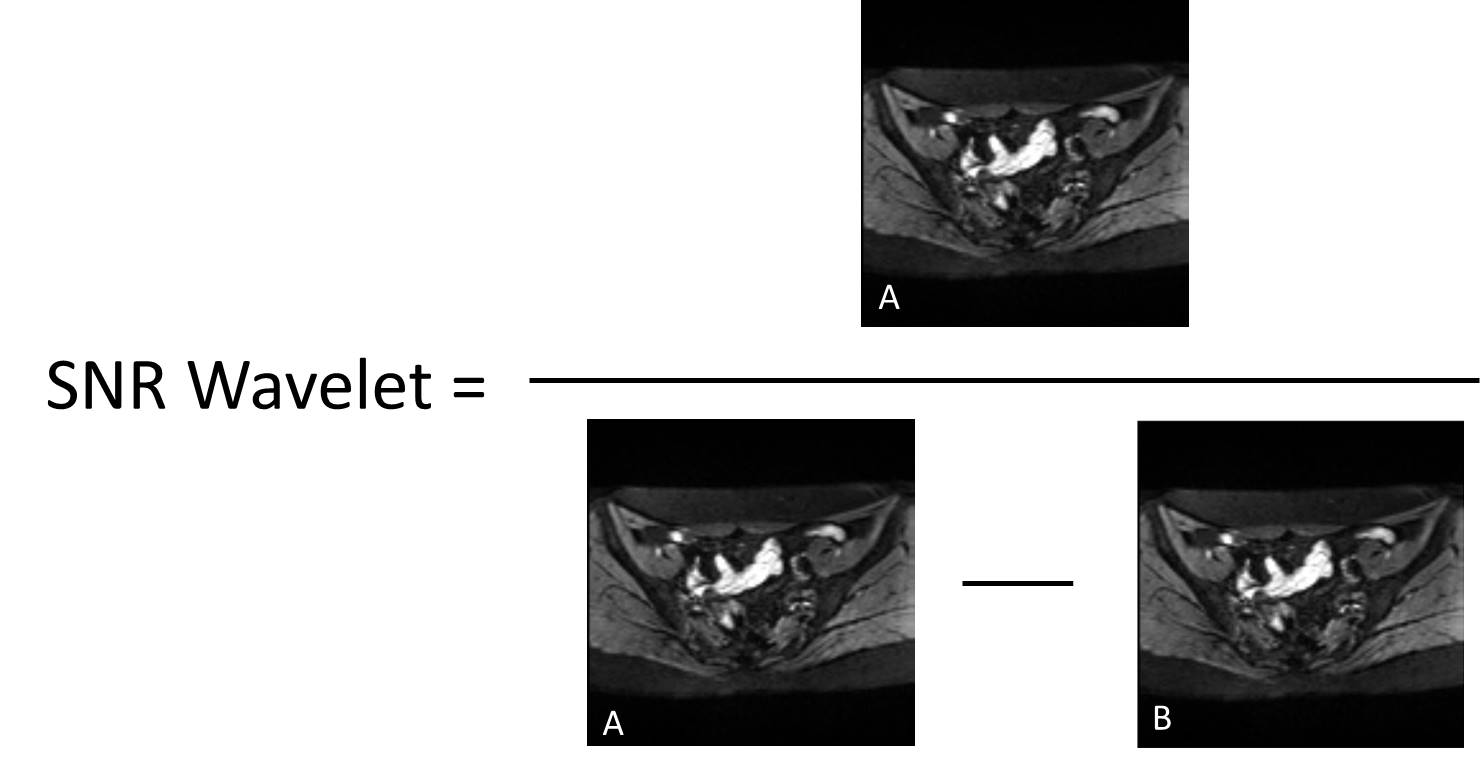
This study proposed an automatic image quality evaluation method using no-reference image quality metrics of structural similarity index (SSIM), blind/referenceless image spatial quality evaluator (BRISQUE), perception based Image quality evaluator (PIQE), SNR Wavelet and Contrast. The SNR Wavelet was calculated by the quotient of the image before wavelet filtering and the difference between the image before wavelet filtering and the image after wavelet filtering. The contrast was calculated using the average signal difference of three to five gray bars in the middle position. This study showed the automatic no-reference image quality metrics have potentials in future application of evaluating the image quality of uterine malignancy DWI at 3T with a higher efficiency.
Introduction
With excellent soft tissue contrast, MRI plays increasingly important role in the therapy of uterine malignancy. Diffusion-weighted imaging (DWI) improves the diagnosis of local staging endometrial and cervical cancer based on its ability of reflecting tissue microstructures. Image quality is closely related to the acquisition sequence, and different sequences have different abilities of reducing susceptibility artifacts from gas in the rectum, imaging blurring, geometric distortion and et al. All these artifacts limit its diagnostic values, especially in detecting and staging uterine malignancy. It is very important to evaluate image quality accurately and objectively, but in clinical situations evaluation of image quality often depends on manual delineation of ROIs, which is very time-consuming. Thus, how to evaluate image quality automatically through objective and comparable indicators without references is very important. The purpose of this study was to verify the feasibility of automatic no-reference image quality metrics in evaluation the image quality of uterine malignancy DWI at 3T through a comparison among iShim, RESOLVE, and ss-EPI sequence.Method
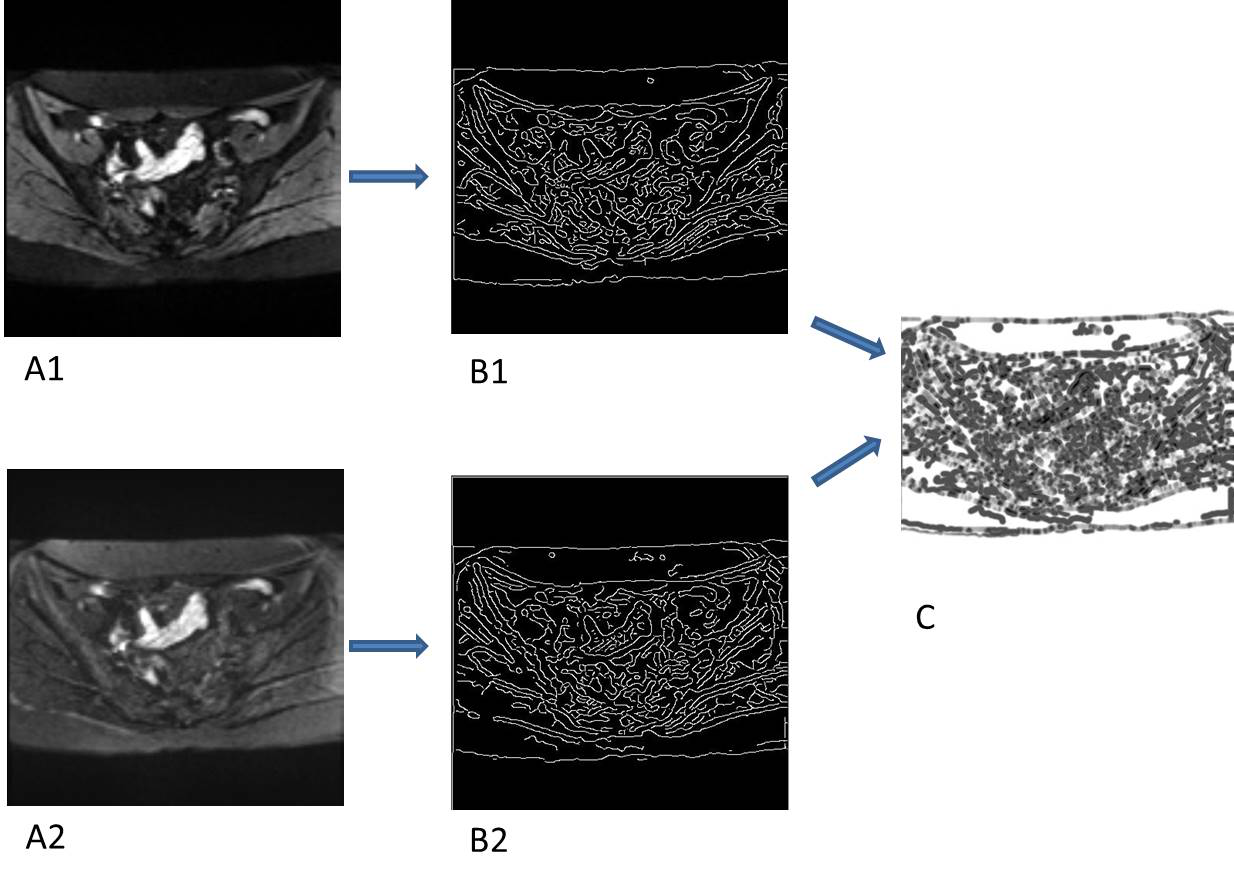
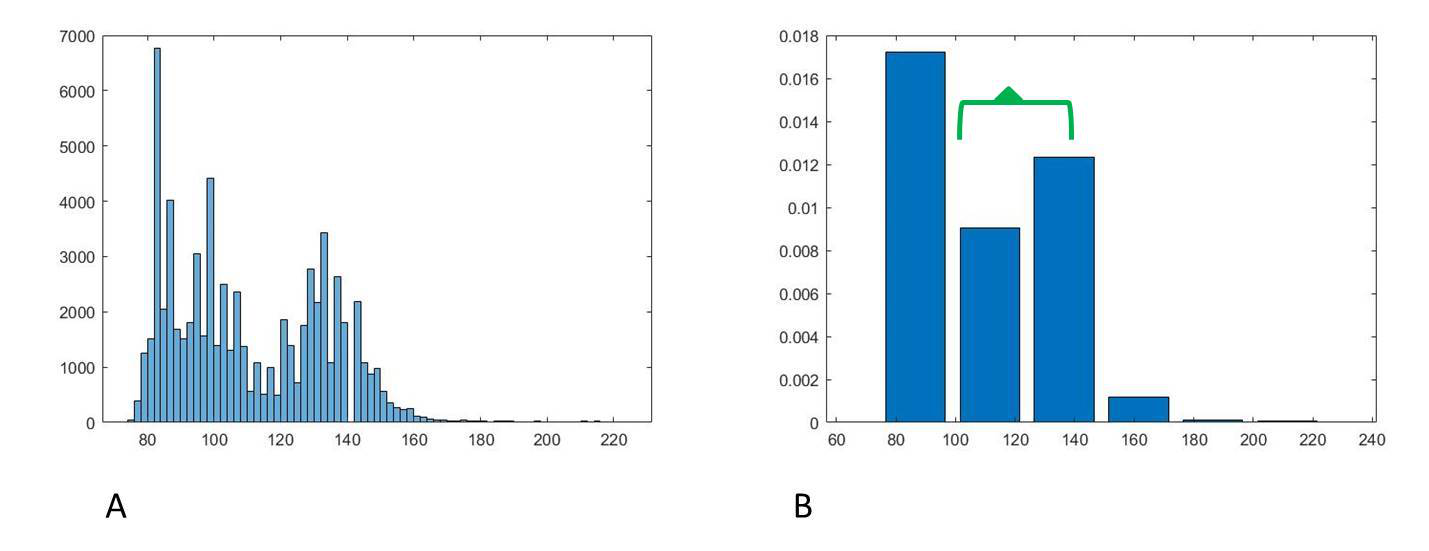
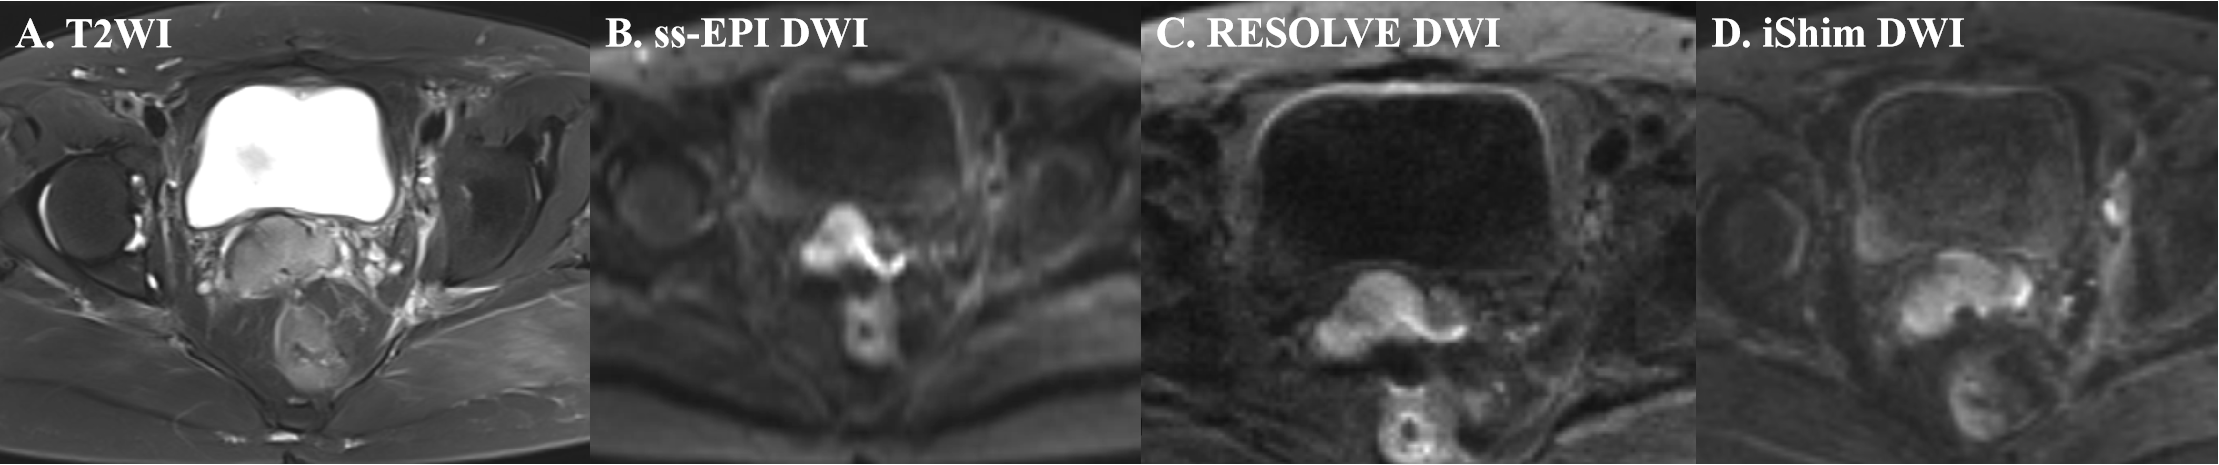
Seventeen patients with uterine malignancy (cervical cancer: 11 cases; endometrial cancer: 6 cases; all pre-treatment) underwent DWI based on iShim, RESOLVE and ss-EPI sequences with two b values (50 and 1000s/mm2) at a 3T whole-body MR scanner (MAGNETOM Prisma, Siemens Healthcare, Erlangen, Germany). First, the whole image quality was evaluated by automatic no-reference image quality metrics of structural similarity index (SSIM) [1], blind/referenceless image spatial quality evaluator (BRISQUE) [2], perception based Image quality evaluator (PIQE) no-reference image quality score [3]. One demonstration of calculating SSIM was shown in Figure 1. The SNR Wavelet was calculated by the quotient of the image before wavelet filtering and the difference between the image before wavelet filtering and the image after wavelet filtering (Figure 2). To calculate the contrast, the gray histogram distribution of the image is calculated, and then is discretized. The contrast was calculated using the average signal difference of three to five gray bars in the middle position. All these processes were done by using an in-house developed software program using MATLAB (Mathworks, Natick, MA, USA). After that the manual measurement were done by two radiologists independently without awareness of the types of image sequences, three sets of DW images were assessed for the depiction of lesion with 4-point scale, susceptibility artifact with 5-point scale and geometric distortion. Geometric distortion was evaluated by comparing lesion anteroposterior (AP) length and left-right (LR) width derived from T2W images and three different sets of DW images. Additionally, ROI was manually drawn to measure the signal intensity of the tumor (SItumor), the uterine myometrium nearby the lesion (SImyo) and the standard deviation (SD) of the background signal intensity aiming to calculate the contrast-to noise ratio (CNR) and the signal intensity ration. The subjective image quality score, CNR and signal intensity ratio were compared using Friedman test.Results
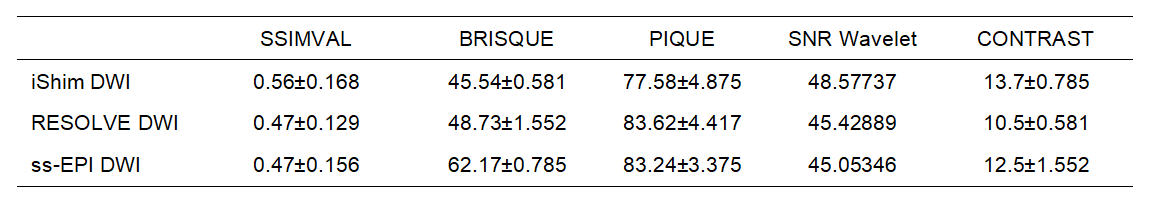
For the whole perception image quality, the PIQUE get a lower score in iShim and RESOLVE sequence than ss-EPI sequence, whereas no significant differences between RESOLVE and iShim was found, which is very close to subjective quality scores. Regarding to subjective quality scores comparisons, both iShim and RESOLVE was significantly superior to ss-EPI (P=0.001), whereas there were no significant differences between RESOLVE and iShim (all P>0.05). All the SNR Wavelet, CONTRAST and the measured SNR and signal intensity ratio got the highest values in iShim sequence (all P<0.05). Considering geometric distortion, the SSIMVAL values didn’t show significant differences among three groups, which is similar the manual results that both AP and LR length on iShim, RESOLVE and ss-EPI did not reveal any significant differences from T2W images (all P>0.05).Discussion and Conclusion
SSIM for measuring image quality takes hue, brightness, saturation and distortion into account. When we convert the image into a binary image, the correlation between this value and distortion is enhanced. The BRISQUE score compares image to a default model computed from images of natural scenes with similar image quality. A smaller score indicates better perceptual quality. In this experiment, we found that the BRISQUE value is close to the subjective quality score to a certain extent, which may meant that the value has potential value in the overall evaluation of the image. However, this value is affected by the preset model. In order to improve the consistency between this value and subjective evaluation score, it is also an important work for the optimization of the model. The PIQE score is the no-reference image quality score and it is inversely correlated to the perceptual quality of an image. A low score value indicates high perceptual quality and high score value indicates low perceptual quality. After wavelet filtering, the image noise can be removed, so we can regard the difference between the original image and the filtered image as the noise. In contrast calculation, several gray scales in the middle of gray histogram are usually the represents the tissues we are interested in, so we use it to calculate the contrast of image.Overall, this study showed the automatic no-reference image quality metrics have great potential in future evaluation of the image quality of uterine DWI at 3T with a higher efficiency.Acknowledgements
This research did not receive any specifific grant from funding agencies in the public, commercial, or not-for-profifit sectors.References
[1] Zhou, W., A. C. Bovik, H. R. Sheikh, and E. P. Simoncelli. "Image Qualifty Assessment: From Error Visibility to Structural Similarity." IEEE Transactions on Image Processing. Vol. 13, Issue 4, April 2004, pp. 600–612.
[2] Mittal, A., A. K. Moorthy, and A. C. Bovik. "No-Reference Image Quality Assessment in the Spatial Domain." IEEE Transactions on Image Processing. Vol. 21, Number 12, December 2012, pp. 4695–4708.
[3] N. Venkatanath, D. Praneeth, Bh. M. Chandrasekhar, S. S. Channappayya, and S. S. Medasani. "Blind Image Quality Evaluation Using Perception Based Features", In Proceedings of the 21st National Conference on Communications (NCC). Piscataway, NJ: IEEE, 2015. (PIQUE)
Figures