4314
Determination of the optimal set of b-values for Intravoxel Incoherent Motion (IVIM) parameter mapping in liver Diffusion-Weighted MRI1Laboratorio de Procesado de Imagen, Universidad de Valladolid, Valladolid, Spain
Synopsis
Estimation of Intravoxel Incoherent Motion (IVIM) parameter maps from a set of diffusion-weighted (DW) images acquired at multiple b-values usually suffers from low SNR, which may increase the variance of the estimated maps. Unfortunately, there is no consensus on the optimal b-values to maximize the noise performance of IVIM parameters. In this work, we determine the optimal b-values to maximize the performance of IVIM parameter mapping by using a Cramér-Rao Lower Bound approach under realistic noise assumptions. The reduction of the estimation variance on the IVIM parameters compared to state-of-the-art b-values suggests the utility of this approach to optimize DW-MRI.
Purpose
Estimation of Intravoxel Incoherent Motion (IVIM) parameter maps from a set of diffusion-weighted (DW) images acquired at multiple b-values often suffers from low SNR, which may increase the variance of the estimated maps. Unfortunately, there is currently no consensus on the optimal b-values needed to minimize the estimation variance (i.e., maximize precision and noise performance) of IVIM parameter maps. Therefore, the purpose of this work is to optimize the set of b-values for IVIM parameter mapping utilizing the Cramér-Rao Lower Bound1 (CRLB) analysis under the realistic MRI assumption of Rician distributed data2.Methods
Determination of optimal b-values: The IVIM signal model is $$$S(b)~=~S_0[fe^{-b\cdot{D}^*}~+~(1-f)e^{-b\cdot{D}}]$$$, where f, D*, D, and S0 are the perfusion fraction, pseudo-diffusion, diffusion, and signal with no diffusion-weighting, respectively. In order to reduce the estimation variance of IVIM parameters we optimize the b-value set via the CRLB approach. Similar approaches were previously employed for the monoexponential model3,4 and for the IVIM model5 with Gaussian noise. Given a set of independent Rician distributed observations of the IVIM signal model, S(bk) where k∈[1,...,K], with the same noise level, the CRLB of each of the IVIM parameters (CRLBS0, CRLBD, CRLBD*, and CRLBf) is on the diagonal of the inverse of the Fisher Information Matrix1 (Eq. 1), where In(S,σ) is described in Ref6. Therefore, for a given target set of IVIM parameters (S0, D, f, and D*), noise level (σ), and number of b-values (K), the determination of the set of K b-values that minimizes the estimation variance of the IVIM parameters is performed by a Four b-value Search algorithm. With this algorithm, the optimal set is restricted to be composed of four different b-values repeated k0, k1, k2, and k3 times, respectively. The first b-value is fixed to be b=0s/mm2 to have measurements with maximum signal-to-noise-ratio (SNR), whereas the other three (low, middle, and high) are chosen among a large pool of b-value candidates. Then, an exhaustive search is performed to find the optimal set of K b-values (k0+k1+k2+k3=K). Finally, the [zero(k0), low(k1), middle(k2), high(k3)] combination of b-values that achieves minimum CRLBD, CRLBf, CRLBD*, or CRLB of the figure of merit $$$\Gamma~=\frac{\sqrt{\text{CRLB}_\text{D}}}{D}~+~\frac{\sqrt{\text{CRLB}_\text{f}}}{f}~+~\frac{\sqrt{\text{CRLB}_{\text{D}^*}}}{D^*}$$$ (CRLB𝛤) is considered optimal.Furthermore, optimal b-value sets obtained with the proposed approach were computed from parameters shown in Table 1 to study their distribution and properties.
Eq. 1: $$\begin{bmatrix}\sum\limits_{k=1}^{K}[fe^{-b_k\cdot\text{D}^*}+(1-f)e^{-b_k\cdot\text{D}}]^2\mathcal{I}_n(S(b_k),\sigma)&-\sum\limits_{k=1}^{K}S(b_k)(1-f)b_ke^{-b_k\cdot\text{D}}\mathcal{I}_n(S(b_k),\sigma)&\sum\limits_{k=1}^{K}S(b_k)[e^{-b_k\cdot\text{D}^*}-e^{-b_k\cdot\text{D}}]\mathcal{I}_n(S(b_k),\sigma)&-\sum\limits_{k=1}^{K}S(b_k)fb_ke^{-b_k\cdot\text{D}^*}\mathcal{I}_n(S(b_k),\sigma)\\-\sum\limits_{k=1}^{K}S(b_k)(1-f)b_ke^{-b_k\cdot\text{D}}\mathcal{I}_n(S(b_k),\sigma)&\sum\limits_{k=1}^{K}S^2_0(1-f)^2b^2_ke^{-2\cdot{b}_k\cdot\text{D}}\mathcal{I}_n(S(b_k),\sigma)&-\sum\limits_{k=1}^{K}S^2_0(1-f)b_k[e^{-b_k\cdot\text{D}^*}-e^{-b_k\cdot\text{D}}]e^{-b_k\cdot\text{D}}\mathcal{I}_n(S(b_k),\sigma)&\sum\limits_{k=1}^{K}S^2_0(f-f^2)b^2_ke^{-b_k\cdot(\text{D}+\text{D}^*)}\mathcal{I}_n(S(b_k),\sigma)\\\sum\limits_{k=1}^{K}S(b_k)[e^{-b_k\cdot\text{D}^*}-e^{-b_k\cdot\text{D}}]\mathcal{I}_n(S(b_k),\sigma)&-\sum\limits_{k=1}^{K}S^2_0(1-f)b_k[e^{-b_k\cdot\text{D}^*}-e^{-b_k\cdot\text{D}}]e^{-b_k\cdot\text{D}}\mathcal{I}_n(S(b_k),\sigma)&\sum\limits_{k=1}^{K}S^2_0[e^{-b_k\cdot\text{D}^*}-e^{-b_k\cdot\text{D}}]^2\mathcal{I}_n(S(b_k),\sigma)&-\sum\limits_{k=1}^{K}S^2_0fb_k[e^{-b_k\cdot\text{D}^*}-e^{-b_k\cdot\text{D}}]e^{-b_k\cdot\text{D}^*}\mathcal{I}_n(S(b_k),\sigma)\\-\sum\limits_{k=1}^{K}S(b_k)fb_ke^{-b_k\cdot\text{D}^*}\mathcal{I}_n(S(b_k),\sigma)&\sum\limits_{k=1}^{K}S^2_0(f-f^2)b^2_ke^{-b_k\cdot(\text{D}+\text{D}^*)}\mathcal{I}_n(S(b_k),\sigma)&-\sum\limits_{k=1}^{K}S^2_0fb_k[e^{-b_k\cdot\text{D}^*}-e^{-b_k\cdot\text{D}}]e^{-b_k\cdot\text{D}^*}\mathcal{I}_n(S(b_k),\sigma)&\sum\limits_{k=1}^{K}S^2_0f^2b^2_ke^{-2\cdot{b}_k\cdot\text{D}^*}\mathcal{I}_n(S(b_k),\sigma)\\\end{bmatrix}$$
Validation of optimal b-values: With IRB approval and informed written consent, full liver DWI (see Table 2) was acquired in a healthy volunteer to compare the IVIM parameter maps of b-value sets obtained with the proposed approach to those proposed in the literature7,8,9 for IVIM liver DWI (see Table 2). The whole acquisition was repeated 16 consecutive times to enable voxel-wise determination of IVIM parameter and SNR statistics. IVIM parameter maps were obtained with a maximum likelihood estimator using all DWI available. SNR was computed voxel-wise on the S0 images through the ratio between the signal intensity and the standard deviation across the 16 repetitions. Liver IVIM parameters and SNR values were obtained averaging the values of a 30mm2 ROI drawn on each slice of the liver acquisition (see Table 2).
Additionally, given a b-value set, corresponding DWI of an acquisition were selected for IVIM parameter estimation with a maximum likelihood estimator. However, if a b-value was repeated, the equivalent number of DWI of the consecutive repetitions were selected. This method was repeated 16 consecutive times, one per acquisition, obtaining a set of 16 repeated IVIM parameter maps. Then, we obtained the voxel-wise standard deviation statistics across all the estimated maps (σD, σf, and σD*). This experiment is a procedure to compare the estimation variance of various b-value sets.
Results
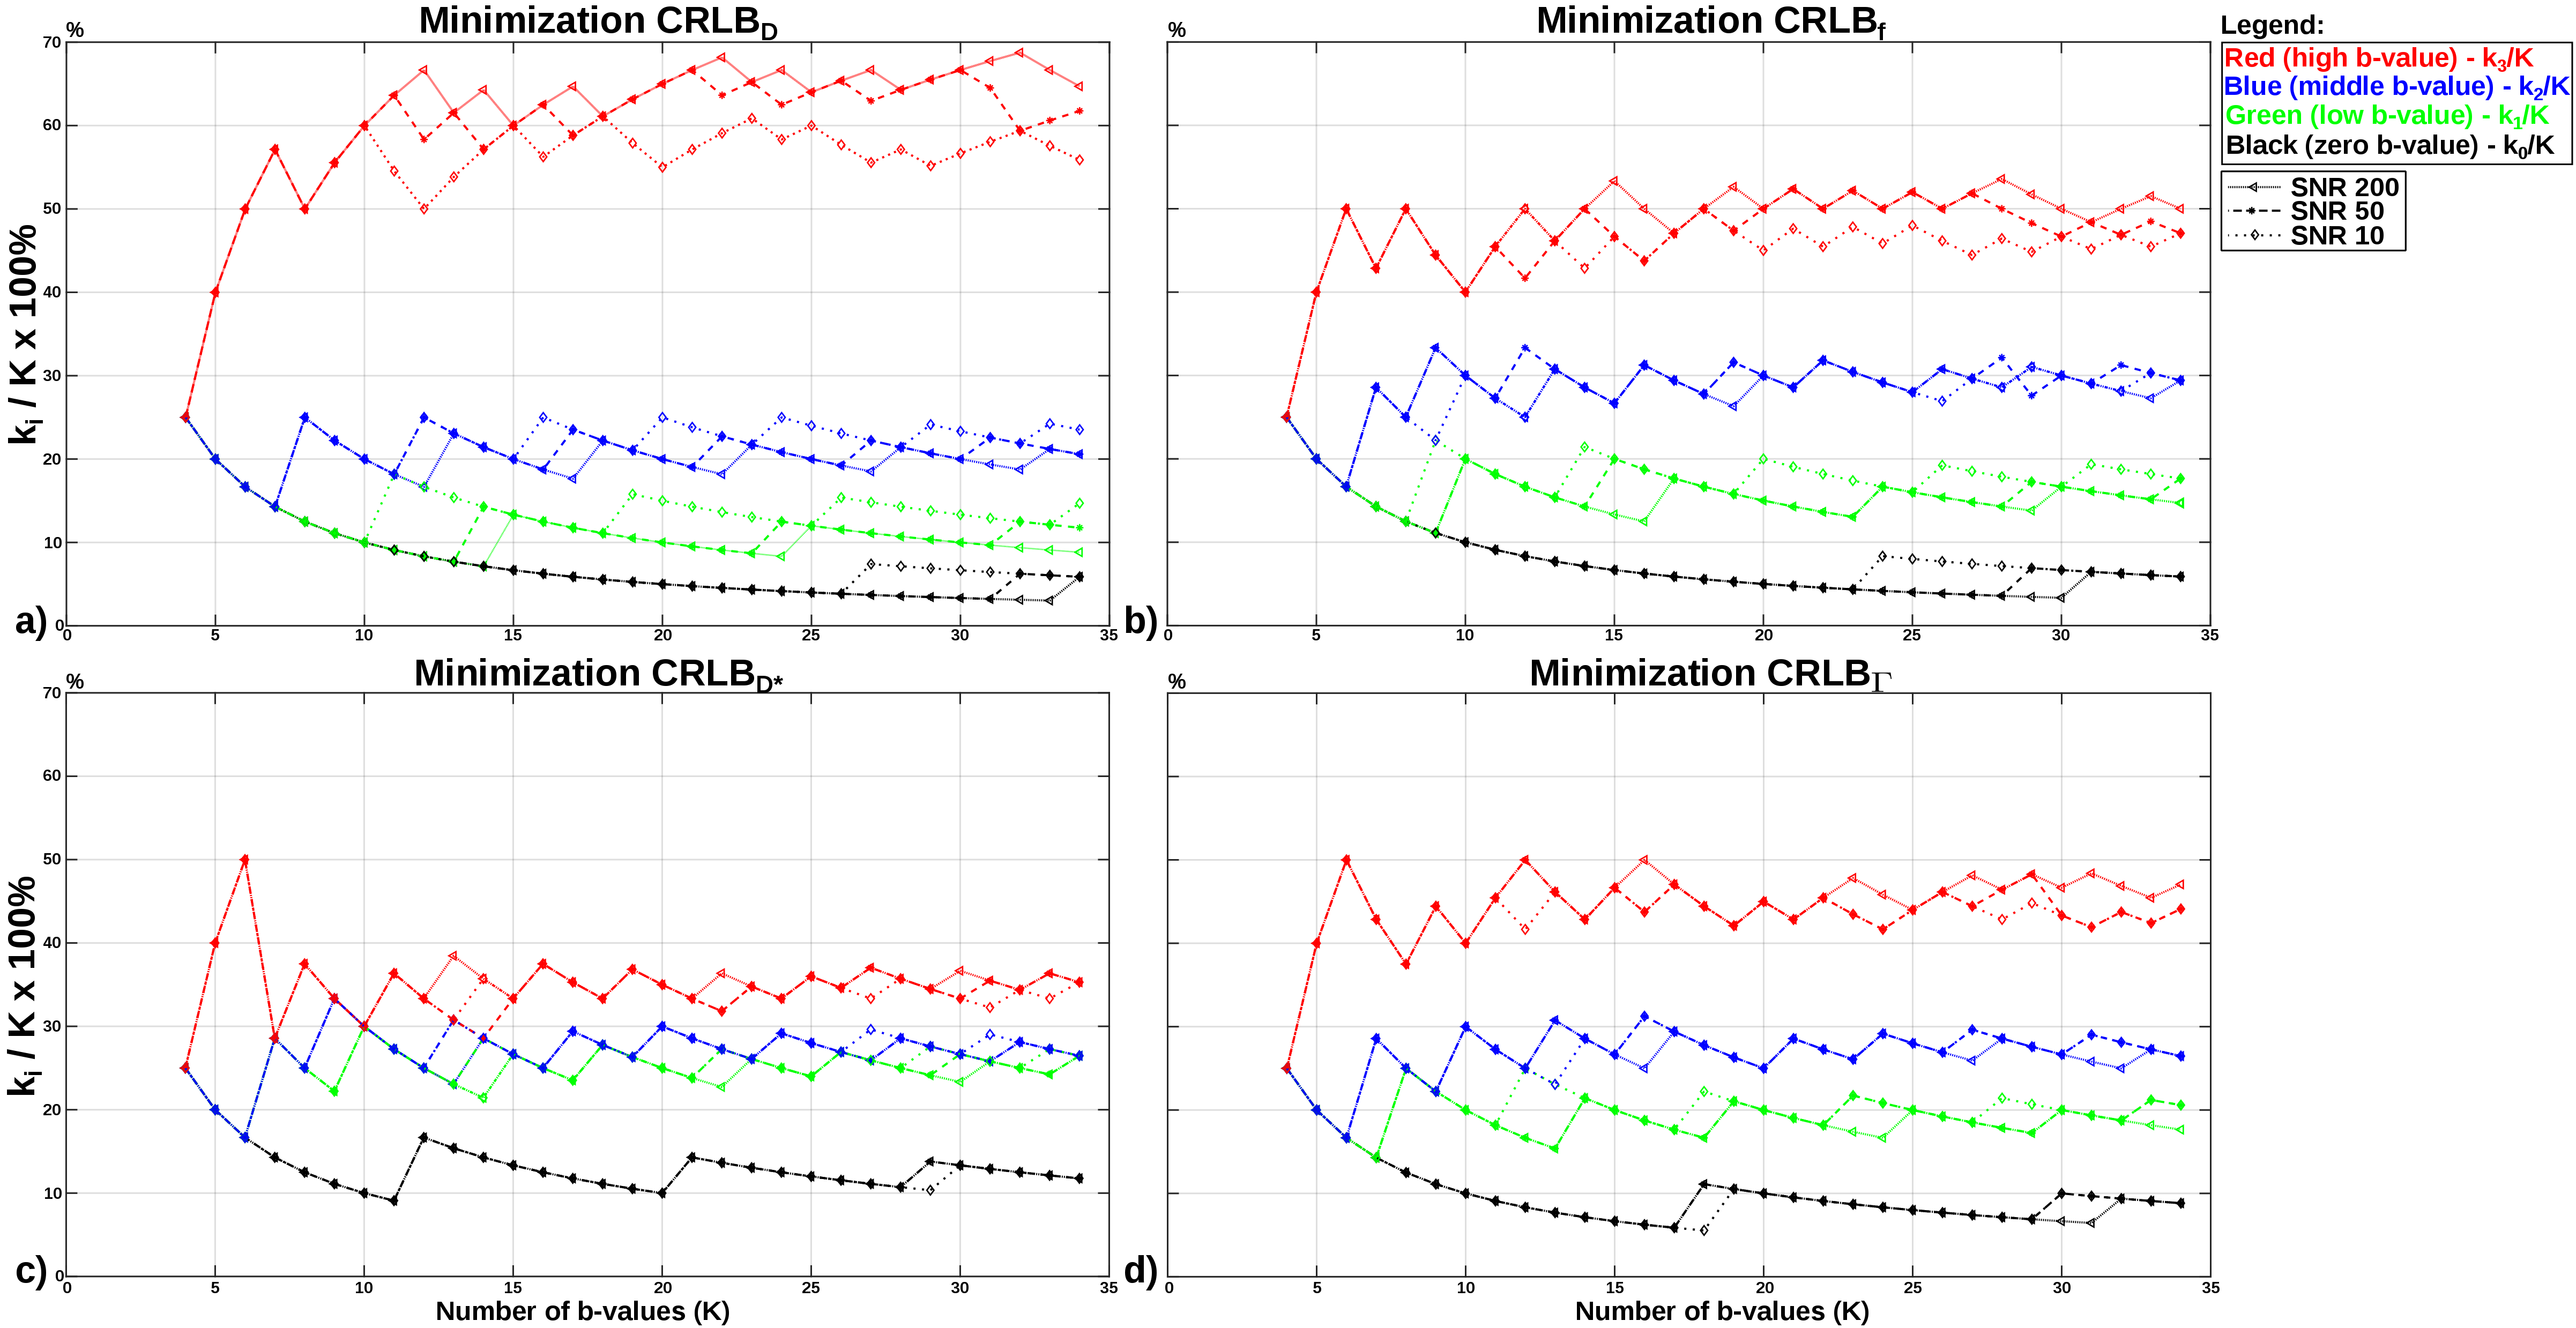
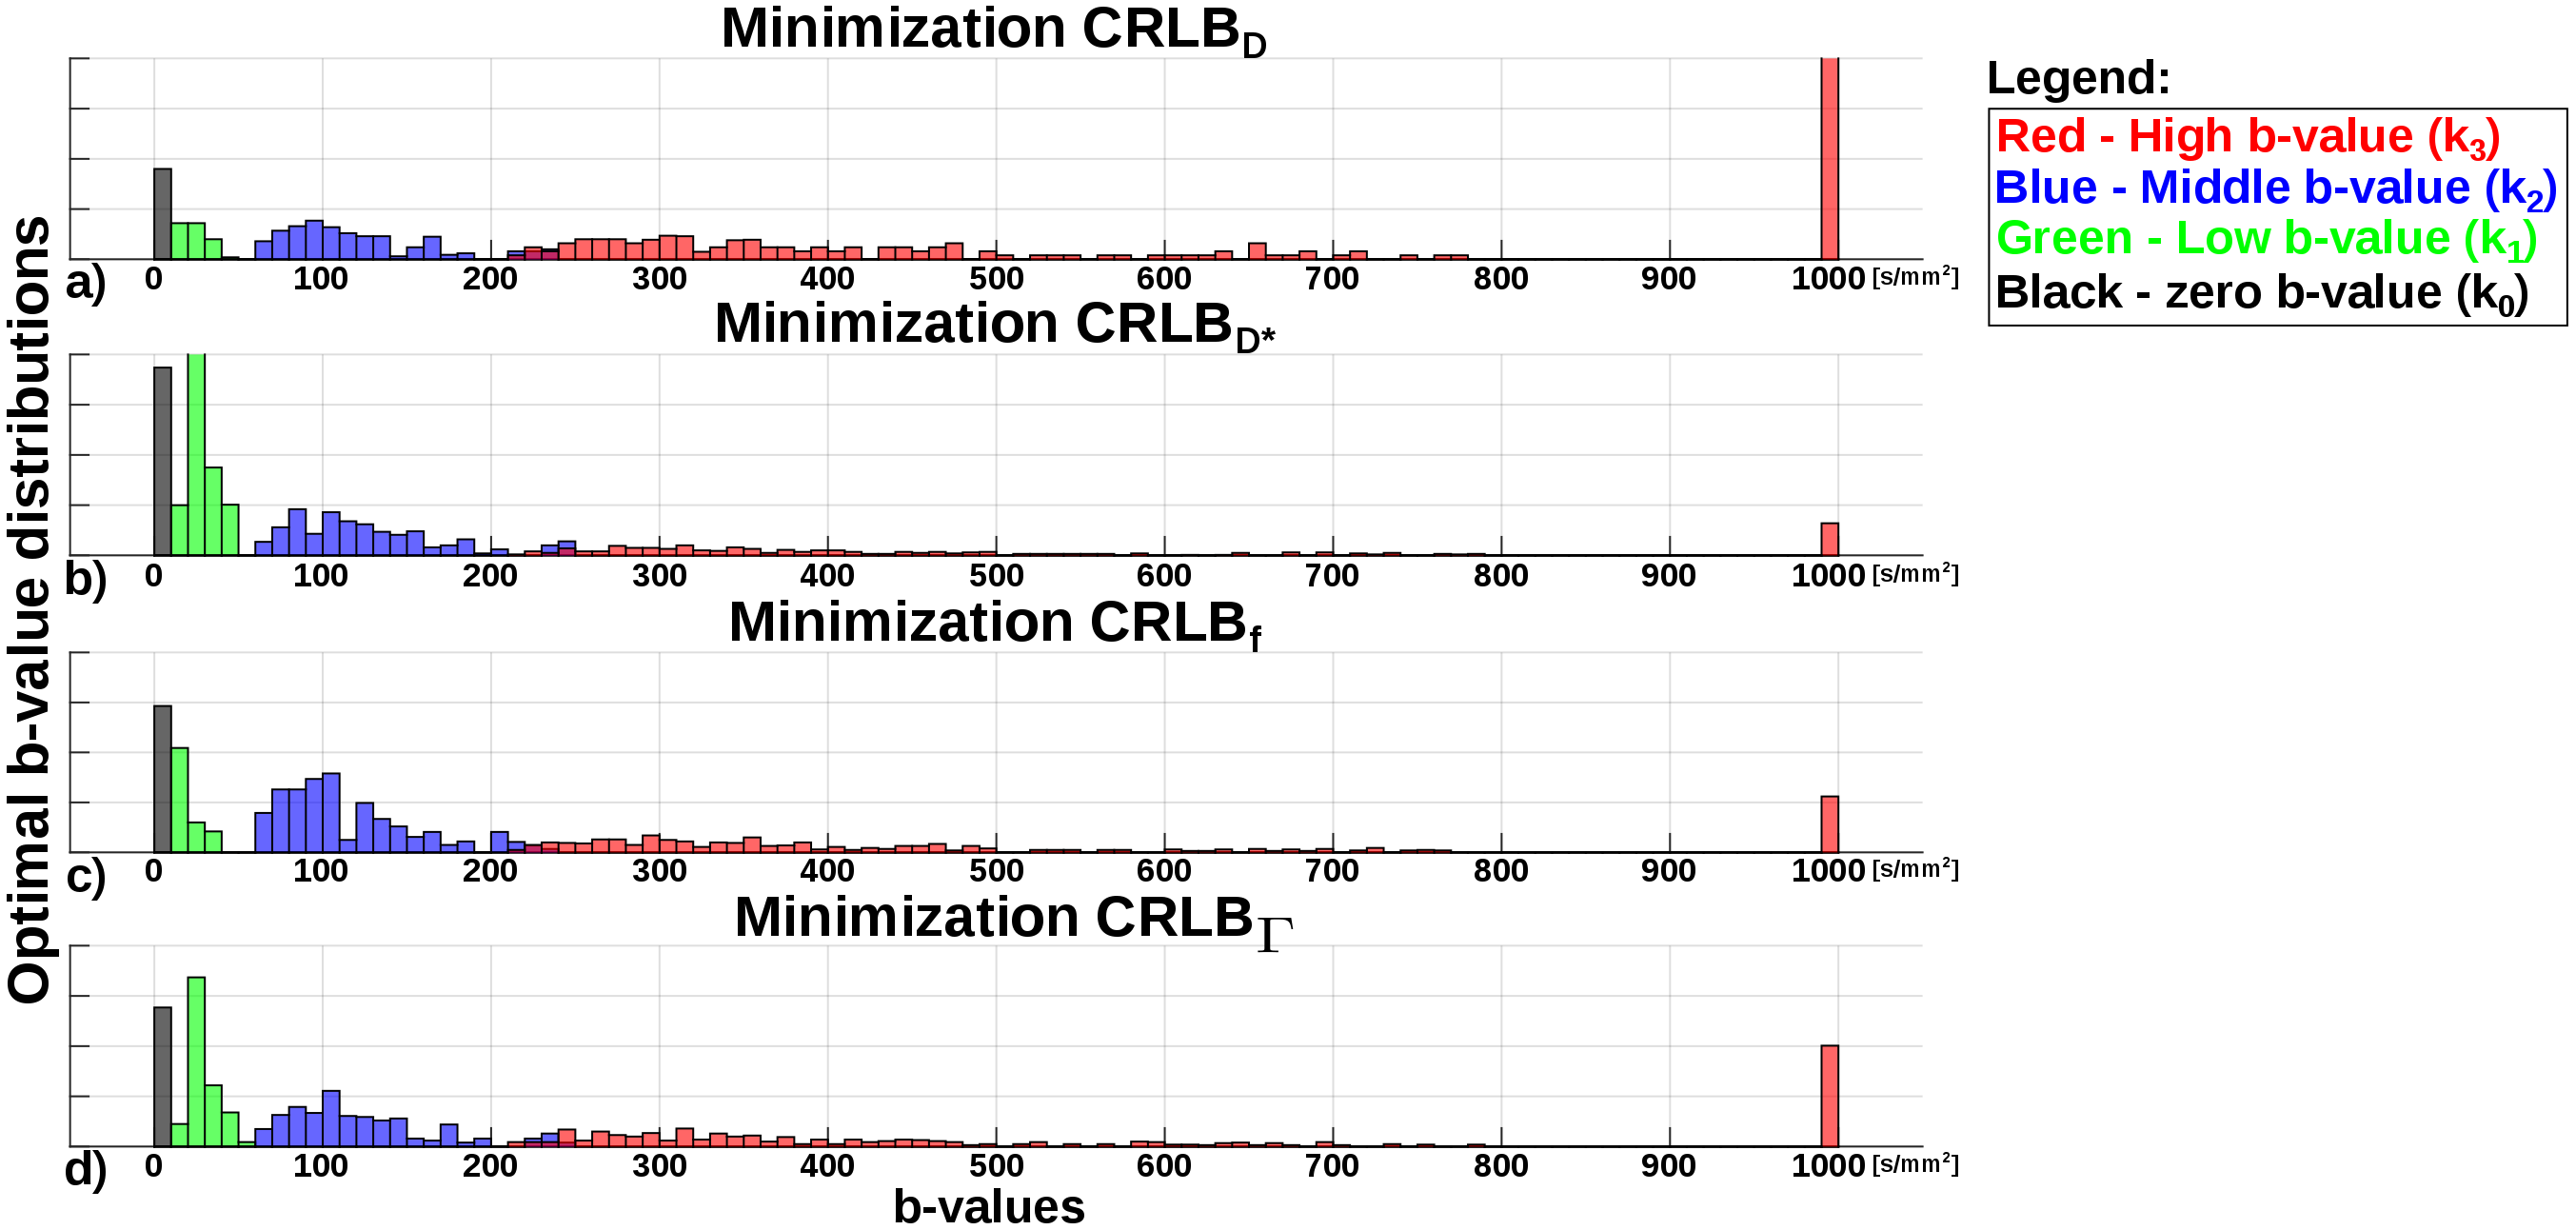
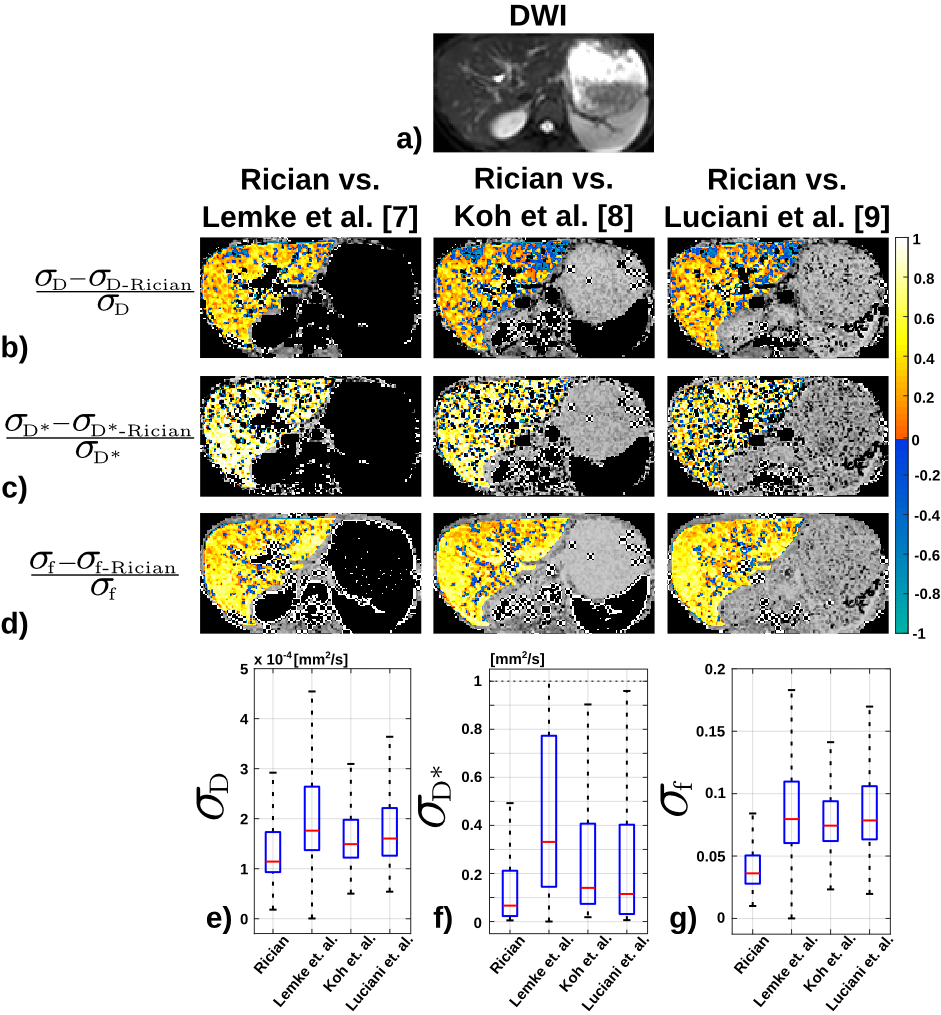
Figure 1 shows the ratio between the number of times each b-value is repeated (ki) in the optimal set and total number of b-values (K), when minimizing CRLBD, CRLBf, CRLBD*, and CRLB𝛤 (D=7x10⁻³mm2/s, f=0.3, D*=20x10-3mm2/s, SNR=[200,50,10]). Figure 2 shows the b-value distribution of the optimal K=13 b-value sets obtained for parameters of Table 1. Finally, Figure 3 shows the performance comparison in terms of voxel-wise standard deviation reductions of each estimated IVIM parameter map (i.e., $$$\frac{\sigma_\text{D}-\sigma_\text{D-Rician}}{\sigma_\text{D}}$$$, $$$\frac{\sigma_\text{D*}-\sigma_\text{D*-Rician}}{\sigma_\text{D*}}$$$, $$$\frac{\sigma_\text{f}-\sigma_\text{f-Rician}}{\sigma_\text{f}}$$$) between the proposed optimal b-value set and three sets proposed in the literature6,7,8.Discussion
Simulations show the optimized b-value set depends on the D, f, D*, SNR, and on the minimization parameter (i.e., CRLBD, CRLBf, CRLBD*, and CRLB𝛤). Further, optimal b-values can be grouped as the color-coded representation of Figure 2, indicating that to reduce the estimation variance of IVIM parameter maps the low, middle and high b-values should be 10-60s/mm2, 60-200s/mm2, >200s/mm2, respectively. Finally, the optimal b-values obtained with the proposed approach minimizing the figure of merit (CRLB𝛤) achieve lower estimation variance (higher noise performance) on the estimated liver IVIM parameter maps than b-values from the literature. However, in order to develop a procedure suitable for clinical settings and to study its discrimination ability, further validation is still required including the T2 relaxation effect and more in-vivo healthy and diseased patients.Conclusion
b-Value optimization is crucial to reduce the estimation variance (i.e., maximize precision and noise performance) of IVIM parameters estimation in DW-MRI. The proposed approach may help optimize and standardize liver DW-MRI acquisitions.Acknowledgements
The authors acknowledge grant RTI2018-094569-B-I00 from the Ministerio de Ciencia e Innovación of Spain. The main author would also like to acknowledge the Consejería de Educación of Junta de Castilla y León, and the Fondo Social Europeo for his predoctoral grant.References
1. Karlsen OT, et al. Parameter Estimation From Rician-Distributed Data Sets Using a Maximum Likelihood Estimator: Application to T1 and Perfusion Measurements. Magn Reson Med. 1999;41(3):614-623.
2. Aja-Fernández S, et al. Statistical Analysis of Noise in MRI. Springer, 2016.
3. Brihuega-Moreno O, et al. Optimization of Diffusion Measurements Using Cramer-Rao Lower Bound Theory and its Application to Articular Cartilage. Magn Reson Med. 2003;50(5):1069-1076.
4. Peña-Nogales Ó, et al. Determination of optimized set of b-values for Apparent Diffusion Coefficient mapping in liver Diffusion-Weighted MRI. J Magn Reson. In Press.
5. Leporq B, et al. Optimization of the Intra-voxel Incoherent Motion Imaging at 3.0 Tesla for Fast Liver Examination. J Magn Reson Imaging. 2015;41(5):1209-1217.
6. Poot DH, et al. Optimal Experimental Design for Diffusion Kurtosis Imaging. IEEE Trans Med Imaging. 2010;29(3):819-29.
7. Lemke A, et al. Towards an optimal distribution of b-values for IVIM imaging. Magn Reson Imaging. 2011;29(6):766-776.
8. Koh DM, et al. Intravoxel incoherent motion in body diffusion-weighted MRI: reality and challenges. Am. J. Roentgenol. 2011;196(6):1351-1361.
9. Luciani A, et al. Liver cirrhosis: intravoxel incoherent motion MR imaging—pilot study. Radiology. 2008;249(3):891-899.
Figures
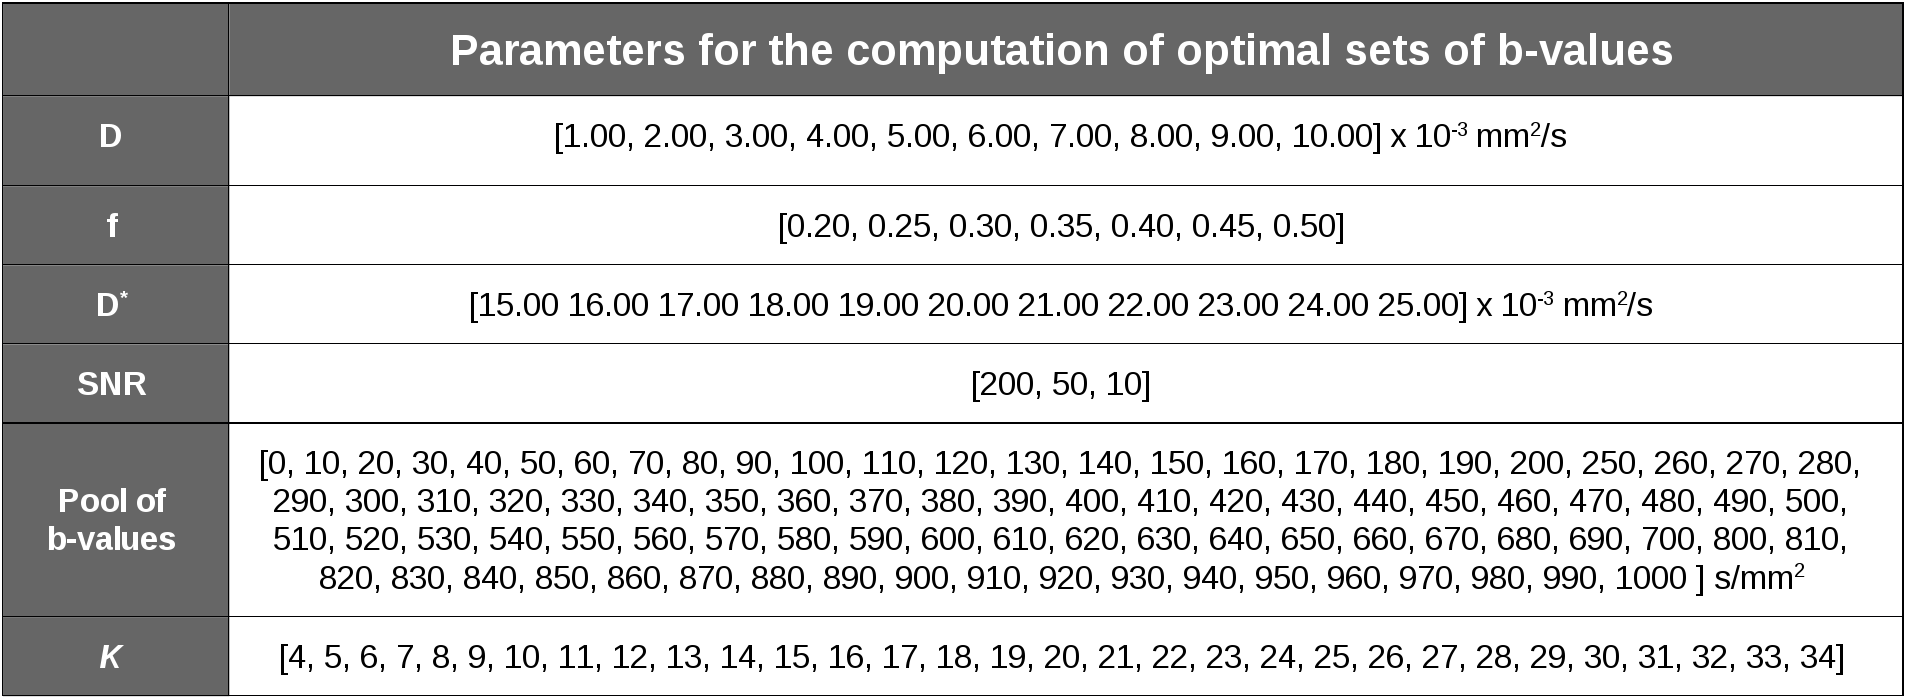
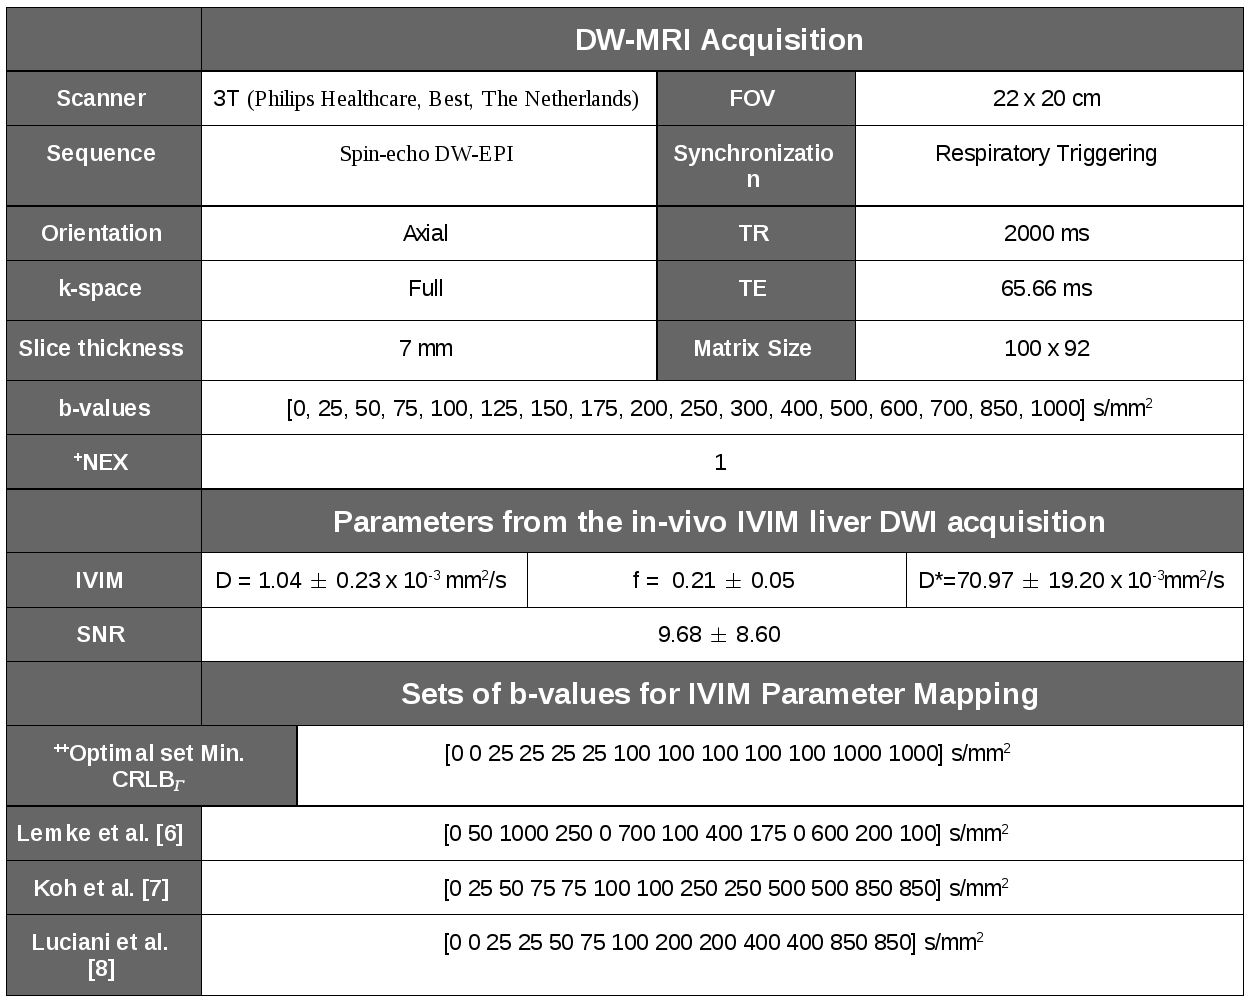
Table 2: Description of the in-vivo IVIM liver DW-MRI acquisition, liver mean IVIM parameters and mean SNR value (mean ± std), and various sets of b-values used to compare the estimation variance (i.e., noise performance) of the IVIM parameter maps.
+Note that the acquisition was repeated 16 consecutive times to enable voxel-wise determination of IVIM parameters and SNR statistics.
++The optimal set of b-values is obtained with the proposed Four b-value Search algorithm under the Rician noise assumption by minimizing the CRLB𝛤 of the liver mean IVIM parameters and mean SNR value.