4310
Clinical Microscopic Fractional Anisotropy Imaging in 4 Minutes: an Optimization Approach1Medical Biophysics, Western University, London, ON, Canada, 2Center for Functional and Metabolic Mapping, Robarts Research Institute, London, ON, Canada
Synopsis
Microscopic diffusion anisotropy ($$$\mu A$$$) and microscopic fractional anisotropy ($$$\mu FA$$$) quantify water diffusion anisotropy in tissue with no influence from neuron fiber orientation. Here, we characterized $$$\mu A^2$$$ signal-to-noise ratio using standard error propagation to determine the b-value and ratio of linear to isotropic encodings needed to maximize image quality. This optimization enabled an MRI protocol that utilizes efficient isotropic diffusion encoding to acquire high-quality full-brain $$$\mu A^2$$$ and $$$\mu FA$$$ maps in 2.4 and 4 minutes, respectively, which are demonstrated in two healthy volunteers at 3T.
Introduction
Water diffusion anisotropy in white matter (WM) is an indirect measure of pathology, and reduced anisotropy is observed in diseases like dementia, 1 Alzheimer’s disease, 2 and multiple sclerosis.3 Fractional anisotropy (FA) is the standard diffusion MRI (dMRI) metric to measure diffusion anisotropy, but it cannot distinguish between changes in microstructure and changes in neuron fiber directional coherence.4 In contrast, microscopic diffusion anisotropy ($$$\mu A$$$) and its normalized counterpart, microscopic fractional anisotropy ($$$\mu FA$$$), quantify water diffusion anisotropy independent of fiber orientation.5,6To determine the optimal parameters of a $$$\mu A^2$$$ MRI protocol, we characterized the relationship between $$$\mu A^2$$$ signal-to-noise ratio (SNR) and two parameters that can be adjusted: b-value and ratio of isotropic to linear encodings ($$$n_{iso}/n_{lin}$$$). This optimization approach, combined with a minimalistic 6 linear direction scheme, 7 enabled high quality 3T clinical $$$\mu A^2$$$ and $$$\mu FA$$$ full-brain imaging in 2.4 and 4 minutes, respectively.
Methods
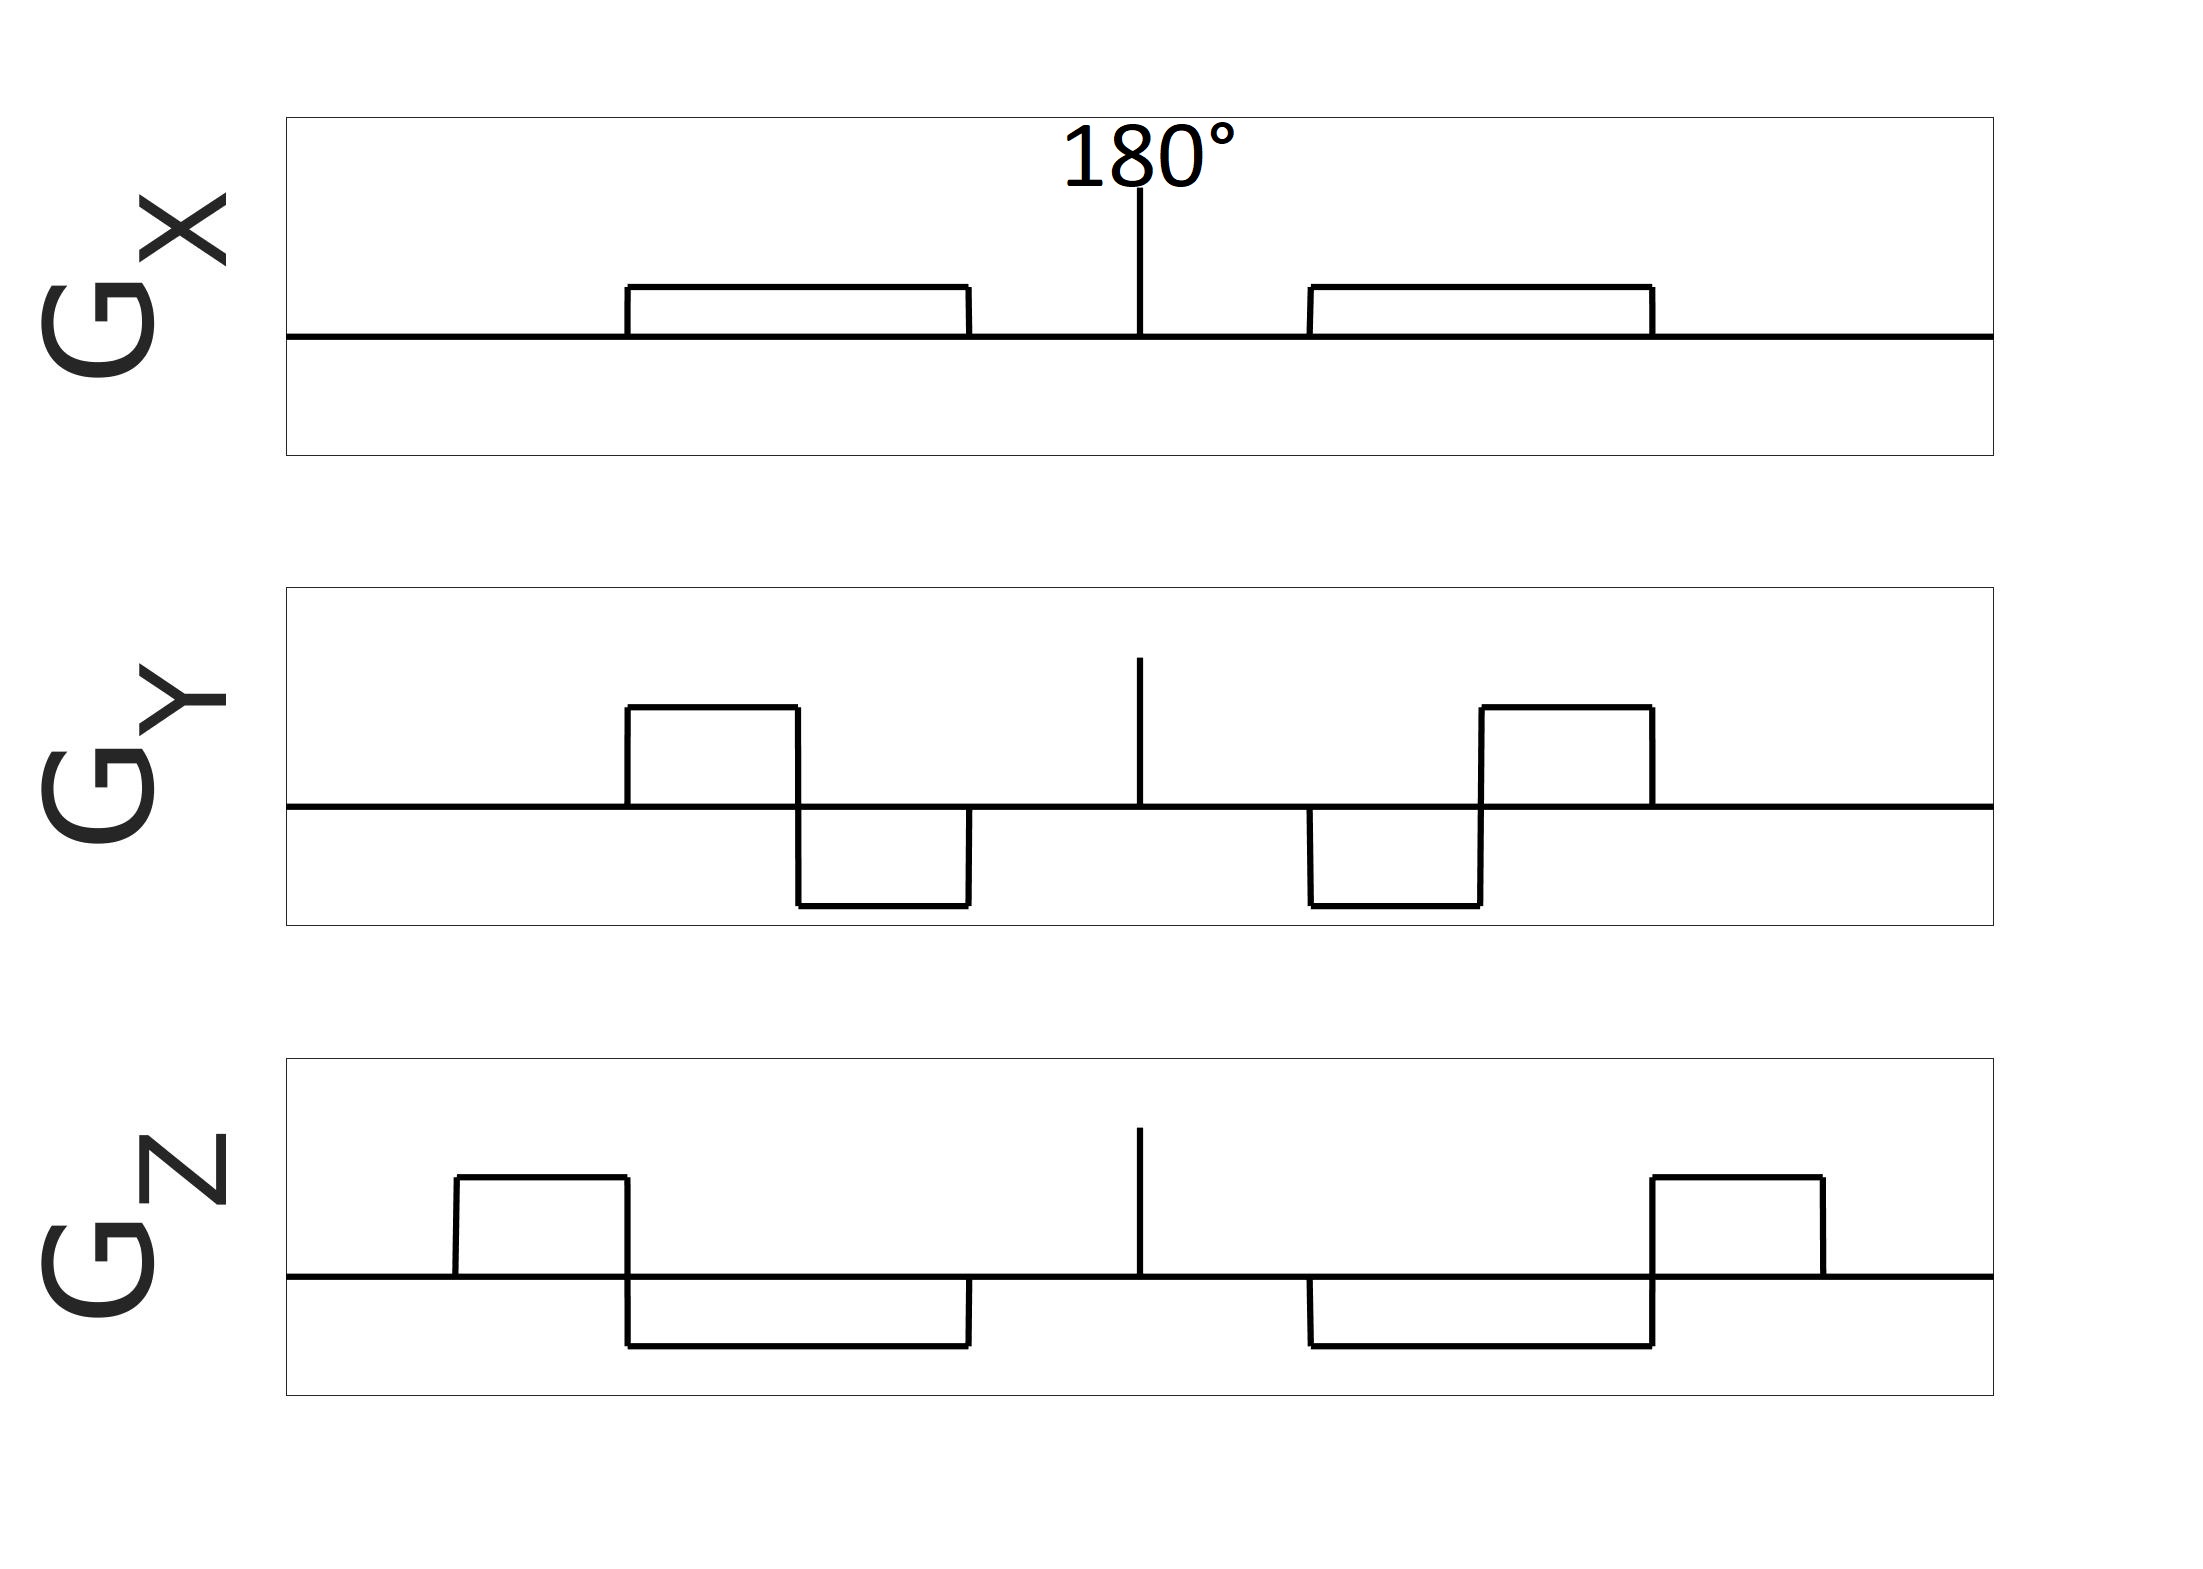
$$$\mu A^2$$$ is computed via 8:$$(1)\qquad\qquad\mu A^2=\frac{ln(S_{lin})-ln(S_{iso})}{b^2}$$where $$$S_{lin}$$$ and $$$S_{iso}$$$ are the powder averages of the linear and isotropic signals, respectively. Standard error propagation theory was used to determine the SNR of $$$\mu A^2$$$:$$(2)\qquad\qquad SNR_{\mu A^2}=\frac{SNR_{lin}ln(\frac{SNR_{lin}}{SNR_{iso}})}{\sqrt{\frac{1}{SNR_{lin}^2n_{lin}}+\frac{1}{SNR_{iso}^2n_{iso}}}}$$where $$$SNR_{lin}$$$ is the SNR of a linear encoded image, $$$SNR_{iso}$$$ is the SNR of an isotropic encoded image, $$$n_{lin}$$$ is the number of linear scans acquired, and $$$n_{iso}$$$ is the number of isotropic scans acquired. Data to aid with optimization was collected from two healthy volunteers on a 3T MRI system (80mT/m strength and 200T/m/s slew rate) using 6 linear and 6 isotropic encodings at b-values from 0s/mm2 to 3500s/mm2 in increments of 500s/mm2. The remaining parameters were TE/TR=125/8700ms, FOV=192x192mm2, 2 mm isotropic in-plane resolution, 45 slices (2 mm), rate 2 GRAPPA, 2 averages, 29 min scan time. To encode diffusion isotropically, we developed a method inspired by qmas 6 that uses trapezoidal gradients (Fig.1). Signal data used in the optimization was measured in a WM region-of-interest (ROI) and WM T2 was assumed to be 80ms.9To test the optimized protocol, we performed scans on the same two volunteers using 6 averages at b=0s/mm2, 6 isotropic averages at b=1200s/mm2, and 6 linear directions and 12 isotropic averages at b=2200s/mm2 with TE/TR=102/7400ms. The total scan time was 4 min. Post-processing included PCA denoising 10 and eddy current correction with FSL.11 $$$\mu A^2$$$ was calculated using Eq. 1, and an expression for $$$\mu FA$$$ was determined using the second order cumulant expansion of a diffusion-weighted MRI signal 6 and assuming that linear and isotropic encodings performed at the same b-value have the same diffusion coefficient 6:$$(3)\qquad\qquad\mu FA=\sqrt{\frac{3}{2}\frac{\mu A^2}{\mu A^2+0.2D^2}}$$where D is the mean diffusivity estimated using the b=0 and b=1200s/mm2 scans.
Results
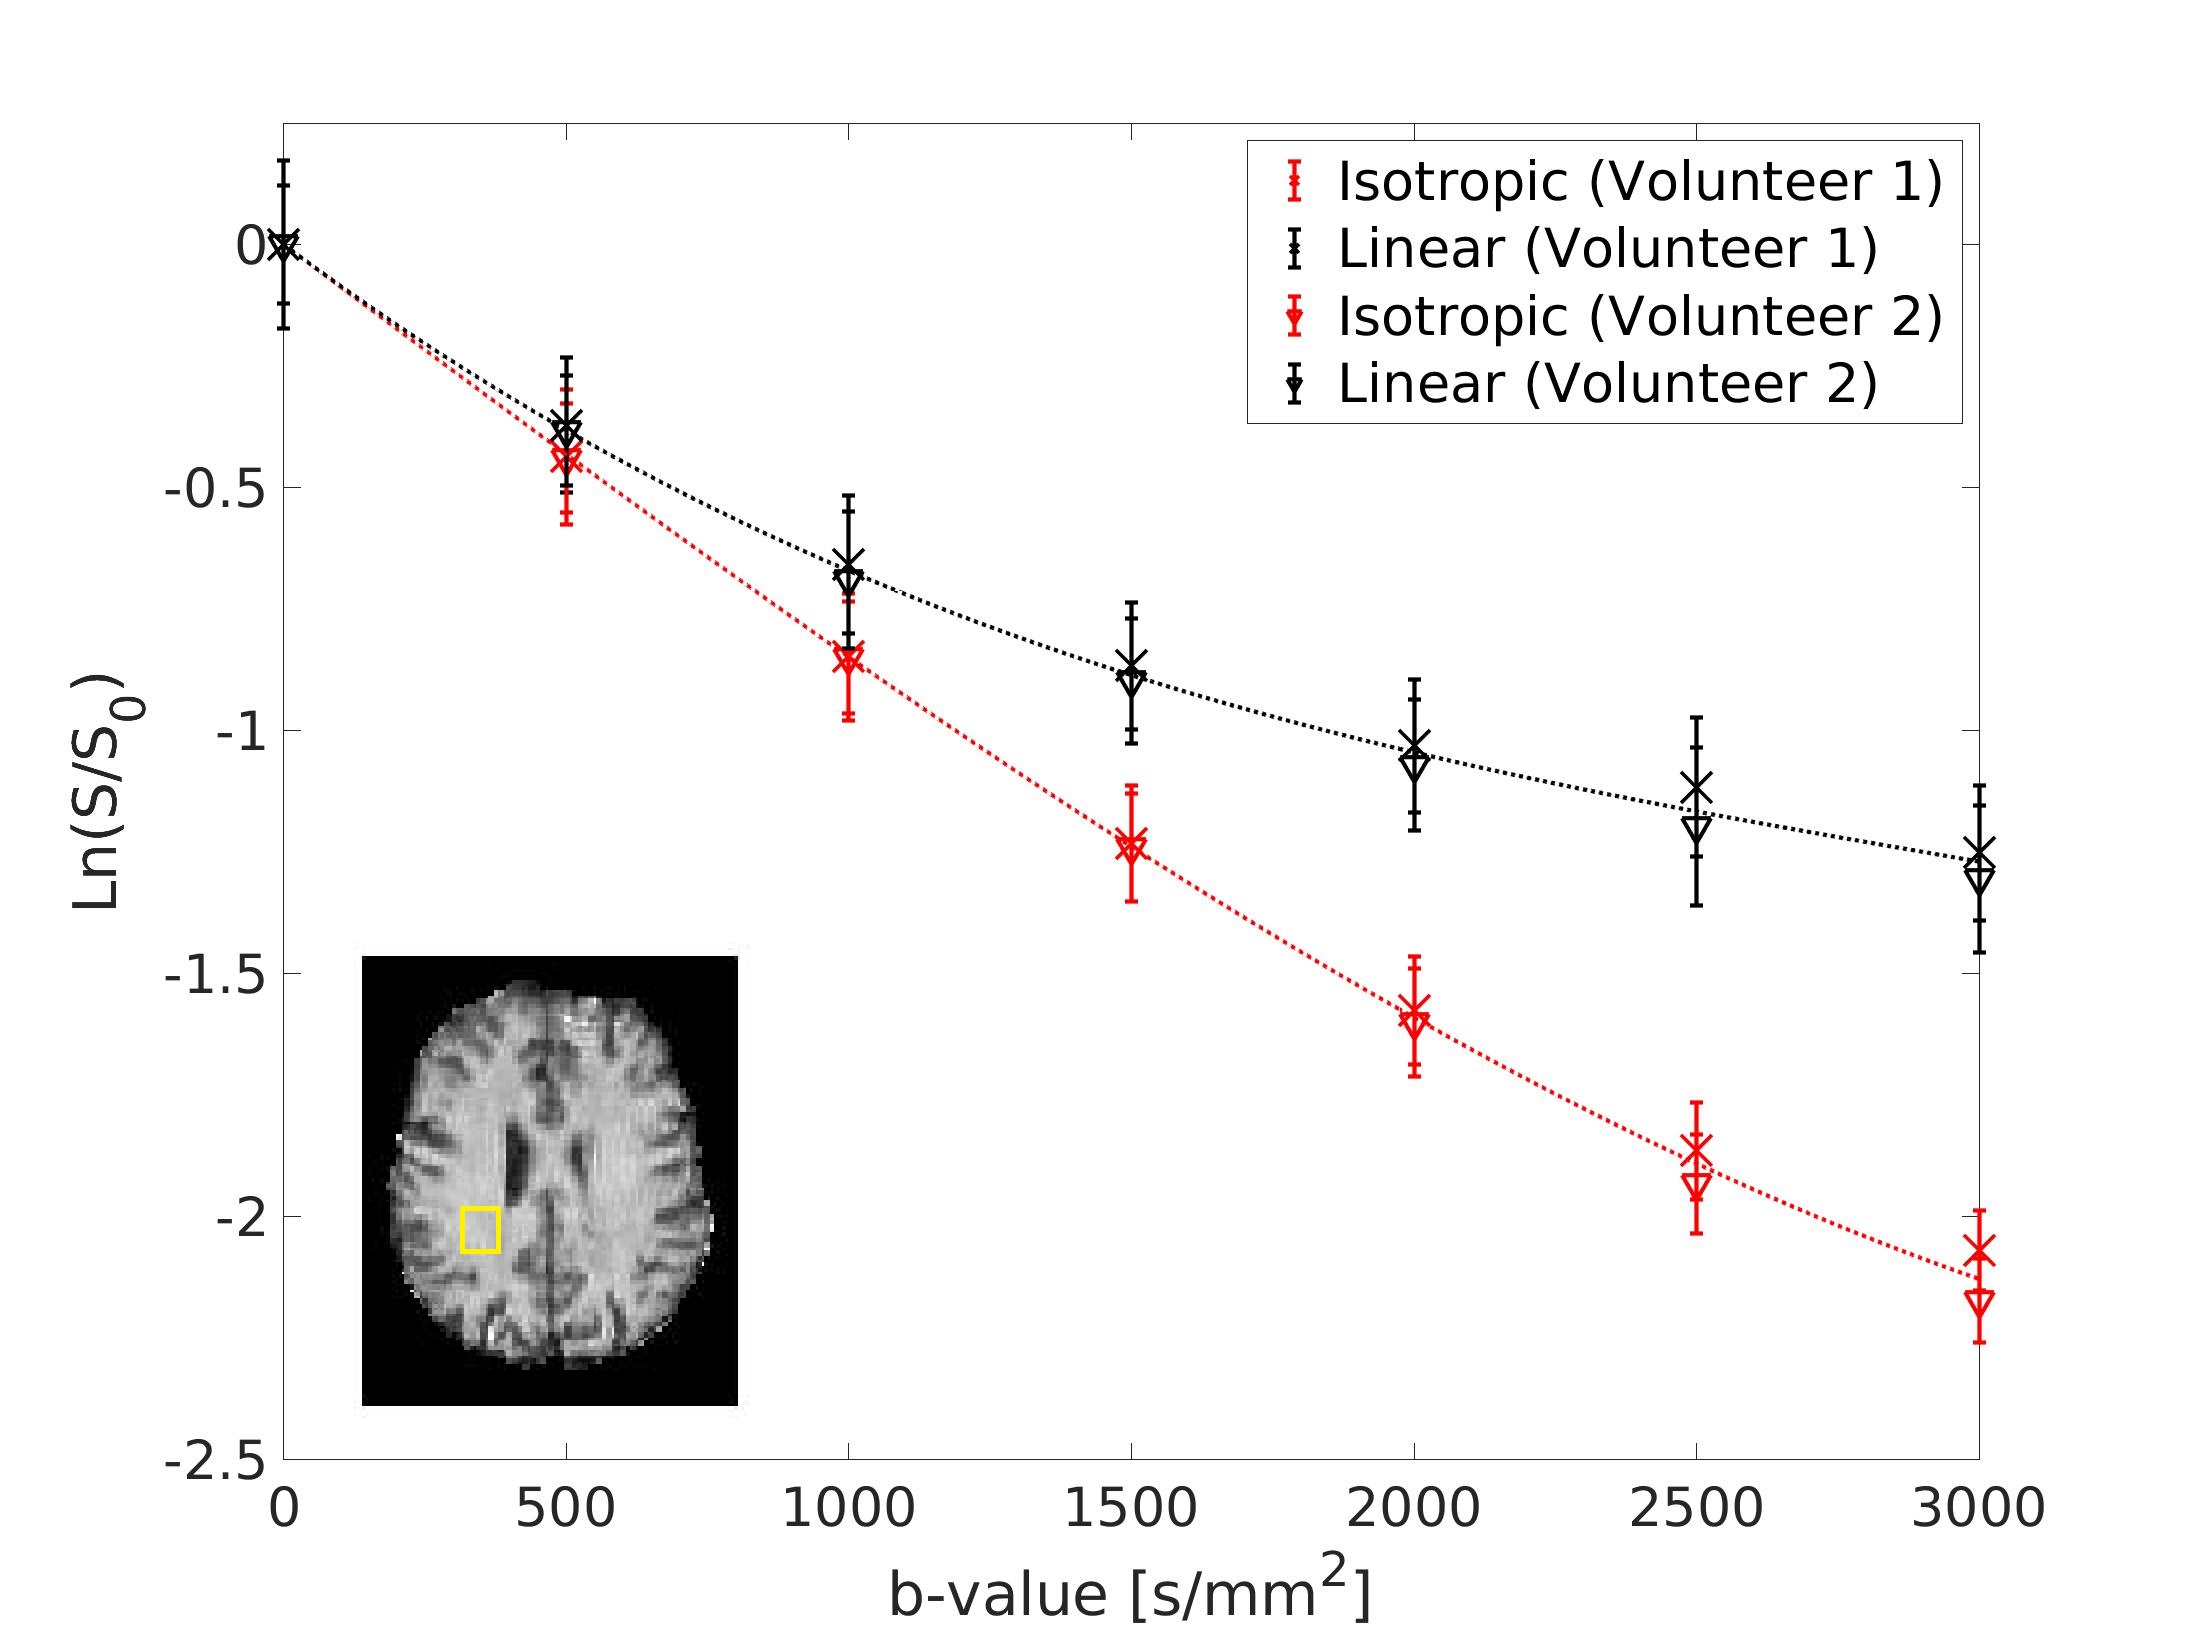
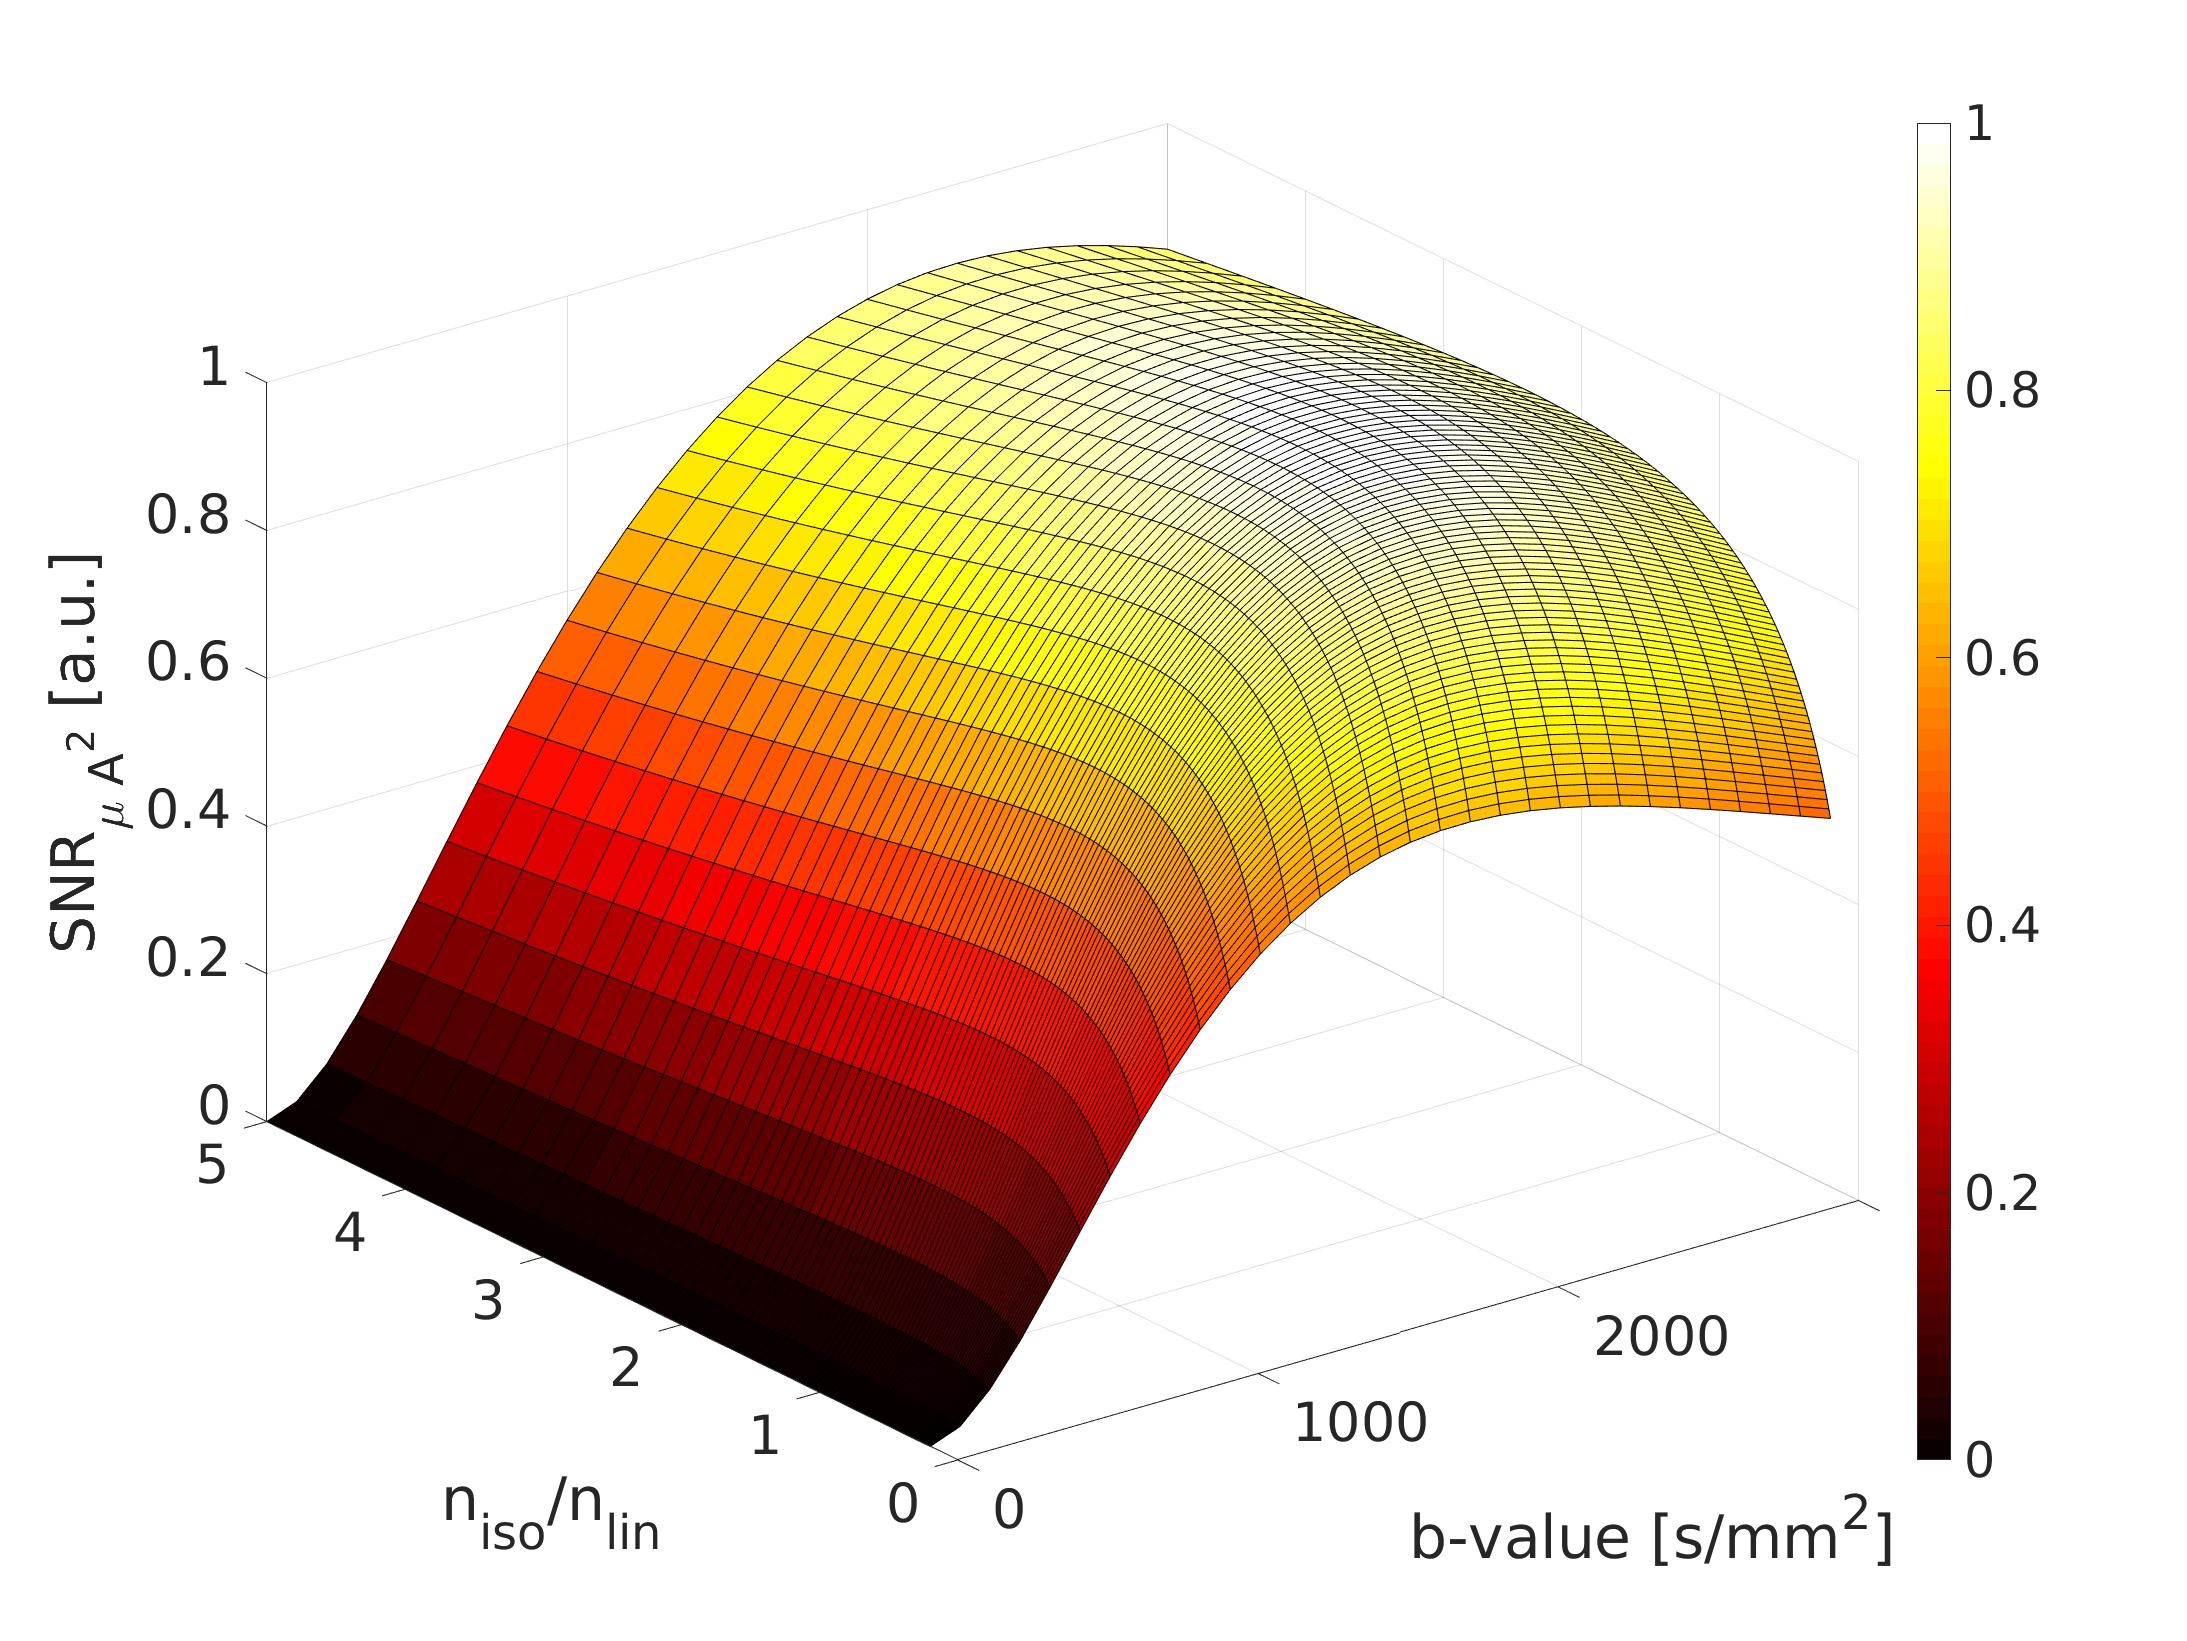
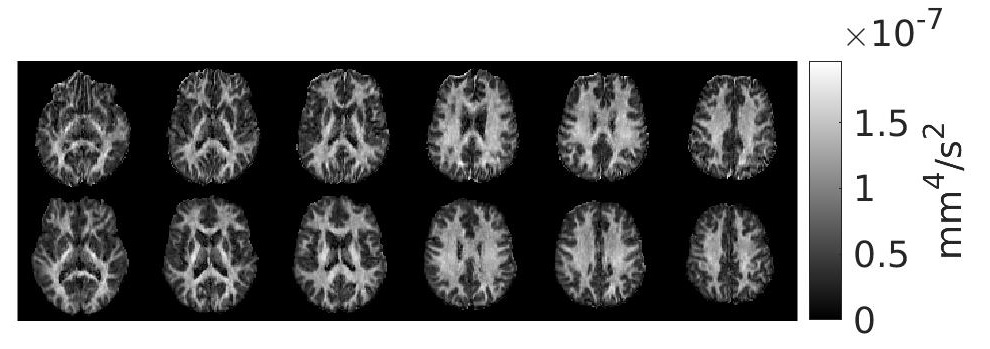
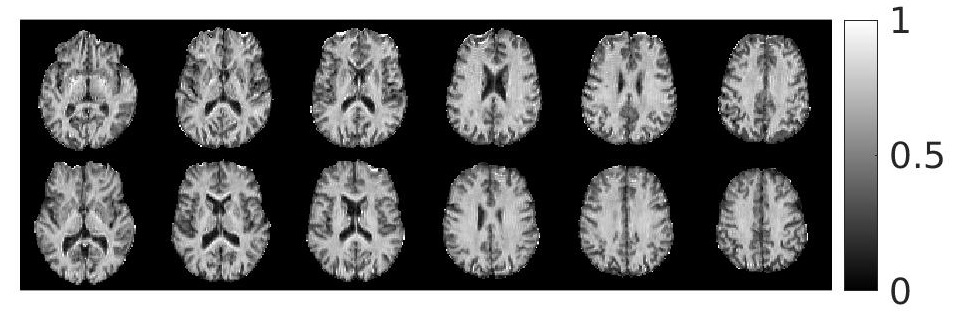
Signal trends in WM ROIs reflects typical behaviour for linear vs. isotropic encoding in those regions 12 (Fig.2). Using the WM data in Eq. 2 yielded an optimal b-value of 2000s/mm2 and optimal $$$n_{iso}/n_{lin}$$$ of 1.7 (Fig.3). The steep drop-off for $$$n_{iso}/n_{lin}<1$$$ occurs because the SNR of the isotropic weighted images is lower than the SNR for linear encoding, on average.$$$\mu A^2$$$ and $$$\mu FA$$$ images from both volunteers from an optimized protocol at b=2200s/mm2 are shown in Fig.4 and Fig.5, respectively. According to Fig.3, this protocol has $$$SNR_{\mu A^2}$$$ equal to 99.3% of the SNR of the optimal design-target protocol with b=2000s/mm2 and $$$n_{iso}/n_{lin}$$$=1.7.
Discussion
The 4 minute protocol allows rapid $$$\mu A^2$$$ and $$$\mu FA$$$ mapping and provides enough data to determine diffusion kurtosis for both linear and isotropic cases if the first order cumulant D is assumed to be the same for both isotropic and linear scans. $$$\mu A^2$$$ and $$$\mu FA$$$ images acquired with this protocol have high SNR (Figs. 4 and 5, respectively) and show homogeneity in WM regions, evidence of the technique’s reduced dependence on fiber orientation compared to FA. The short scan time makes the protocol feasible for clinical use at 3T and can be traded off for better SNR by introducing more acquisitions while maintaining the optimal $$$n_{iso}/n_{lin}$$$ ratio.Isotropic encoding was chosen over double diffusion encoding (DDE) to estimate $$$\mu A^2$$$ because the former method only requires one spin-echo to avoid concomitant gradient errors 13; furthermore, $$$SNR_{\mu A^2}$$$ is higher for similar imaging parameters due to increased signal difference between isotropic and linear acquisitions compared to perpendicular DDE and linear acquisitions. Potential limitations arising from anisotropic frequency content of the isotropic waveforms and intracompartmental kurtosis will be the subject of future study.14 Isotropic-encoding-based methods published to date have utilized a model that assumes a gamma distribution of apparent diffusivities within the voxel, 15 whereas here a straight-forward derivation of $$$\mu FA$$$ based on a kurtosis model was used (Eq. 1), similar to DDE, 8 which may be advantageous for rapid computation in clinical settings. That said, a comparison between the two approaches is warranted.
Eq. 1 is based on the second order cumulant expansion of the dMRI signal and is computed at a single b-value, which can introduce bias if higher order terms are non-negligible.16 This bias can be corrected for by introducing more b-shells to the scan at the cost of increased scan time. Future work will also investigate optimal scan parameters for grey matter imaging.
Acknowledgements
Natural Sciences and Engineering Research Council of Canada (NSERC)
Canada First Research Excellence Fund to BrainsCAN
Queen Elizabeth II Graduate Scholarship in Science and Technology (QEII-GSST)
References
1. Englund, E., Sjöbeck, M., Brockstedt, S., Lätt, J. & Larsson, E.-M. Diffusion tensor MRI post mortem demonstrated cerebral white matter pathology. J. Neurol. 251, 350–352 (2004).
2. Sjöbeck, M. et al. Alzheimer’s disease (AD) and executive dysfunction. A case-control study on the significance of frontal white matter changes detected by diffusion tensor imaging (DTI). Arch. Gerontol. Geriatr. 50, 260–266 (2010).
3. Rovaris, M. et al. Diffusion MRI in multiple sclerosis. Neurology 65, 1526–1532 (2005).
4. Basser, P. J., Mattiello, J. & LeBihan, D. MR diffusion tensor spectroscopy and imaging. Biophys. J. 66, 259–267 (1994).
5. Shemesh, N. et al. Conventions and nomenclature for double diffusion encoding NMR and MRI. Magn. Reson. Med. 75, 82–87 (2016).
6. Lasič, S., Szczepankiewicz, F., Eriksson, S., Nilsson, M. & Topgaard, D. Microanisotropy imaging: quantification of microscopic diffusion anisotropy and orientational order parameter by diffusion MRI with magic-angle spinning of the q-vector. Frontiers in Physics 2, (2014).
7. Nilsson, M. et al. Tensor‐valued diffusion MRI in under 3 minutes: an initial survey of microscopic anisotropy and tissue heterogeneity in intracranial tumors. Magn. Reson. Med. (2019). doi:10.1002/mrm.27959
8. Ianuş, A., Shemesh, N., Alexander, D. C. & Drobnjak, I. Double oscillating diffusion encoding and sensitivity to microscopic anisotropy. Magn. Reson. Med. 78, 550–564 (2017).
9. Wansapura, J. P., Holland, S. K., Dunn, R. S. & Ball, W. S. NMR relaxation times in the human brain at 3.0 Tesla. J. Magn. Reson. Imaging 9, 531–538 (1999).
10. Veraart, J. et al. Denoising of diffusion MRI using random matrix theory. Neuroimage 142, 394–406 (2016).
11. Andersson, J. L. R. & Sotiropoulos, S. N. An integrated approach to correction for off-resonance effects and subject movement in diffusion MR imaging. Neuroimage 125, 1063–1078 (2016).
12. Szczepankiewicz, F. et al. Quantification of microscopic diffusion anisotropy disentangles effects of orientation dispersion from microstructure: Applications in healthy volunteers and in brain tumors. Neuroimage 104, 241–252 (2015).
13. Szczepankiewicz, F., Westin, C. & Nilsson, M. Maxwell‐compensated design of asymmetric gradient waveforms for tensor‐valued diffusion encoding. Magn. Reson. Med. 82, mrm.27828 (2019).
14. Jespersen, S. N., Olesen, J. L., Ianuş, A. & Shemesh, N. Effects of nongaussian diffusion on ‘isotropic diffusion’ measurements: An ex-vivo microimaging and simulation study. J. Magn. Reson. 300, 84–94 (2019).
15. Szczepankiewicz, F. et al. The link between diffusion MRI and tumor heterogeneity: Mapping cell eccentricity and density by diffusional variance decomposition (DIVIDE). Neuroimage 142, 522–532 (2016).
16. Ianuş, A. et al. Accurate estimation of microscopic diffusion anisotropy and its time dependence in the mouse brain. Neuroimage 183, 934–949 (2018).
Figures