4309
Investigating the effect of diffusion MRI acquisition parameters on free water signal fraction estimates from 3-tissue CSD techniques1Department of Radiology & Medical Imaging, Division of Neuroradiology, University of Virginia Health System, University of Virginia, Charlottesville, VA, United States, 2Brain Institute, University of Virginia, Charlottesville, VA, United States, 3The Florey Department of Neuroscience, University of Melbourne, Melbourne, Australia, 4The Florey Institute of Neuroscience and Mental Health, Melbourne, Australia
Synopsis
The CSF-like free water signal fraction is an advanced diffusion MRI metric representing the freely diffusing water in brain tissue. Different methods to calculate the free water signal fraction using constrained spherical deconvolution exist but it is still unknown how variation in data quality and acquisition affect measurements. Using a large clinical dataset with highly variable acquisition schemes, this study shows that the various acquisition parameters significantly affect outcome free water signal fraction, though the multi-shell analysis method is more susceptible than the single-shell method. This highlights the importance of harmonization and quality clinical imaging.
Introduction
Free water signal fraction is an advanced diffusion MRI-derived measure of brain microstructure that can reliably measure the infiltration of freely diffusing water into brain tissue1. It is possible to obtain the free water signal fraction from either single-shell (SS3T-CSD)2 or multi-shell (MSMT-CSD)3 constrained spherical deconvolution methods. Data harmonization in diffusion MRI has been recently emphasized as a means to improve reliability and to minimize site and scanner effects4-7. Many clinical datasets however, are not collected using standardized protocols. It is necessary to assess the influence of changing acquisition parameters, especially on advanced diffusion analysis techniques, if there is a goal of eventual application in a clinical setting. Additionally, there are frequently unique clinical populations that are difficult to collect in a research setting. If retrospective analysis is to be performed on these subjects the effect of different acquisitions must be determined. In this context the comparative robustness of different diffusion analysis techniques is important to consider. If the outcome of one technique is less dependent on input acquisition parameters, signal from an underlying pathology of interest may be easier to observe. In this work, we evaluate the dependence of MSMT-CSD and SS3T-CSD derived free water fractions on acquisition parameters.Methods
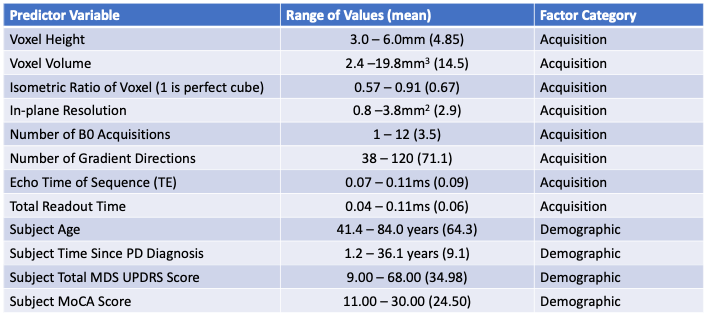
Clinical diffusion MRI data were collected from 100 patients with medication-refractory symptoms of Parkinson’s disease (PD) at the University of Virginia Hospital prior to the implantation of a deep brain stimulator electrode. These images were obtained with one of 27 different combinations of 8 separate acquisition parameters, however all datasets had a single non b=0 valued shell of b=1000s/mm2. All subjects had documented demographic information including age, time since initial PD diagnosis, Total Movement Disorders Society, Unified Parkinson’s Disease Rating Scale (MDS-UPDRS) scores, and Montreal Cognitive Assessment (MoCA) scores. The full list of acquisition parameters and ranges for all imaging and demographic factors are presented in Figure 1.The diffusion data were analyzed using MSMT-CSD3 in MRtrix38 and SS3T-CSD2 available in MRtrix3Tissue (https://3tissue.github.io/), a fork of MRtrix3. It should be noted that MSMT-CSD outputs only two compartments for these single-shell data: a white matter (WM) and a CSF compartment, the latter of which was used to calculate free water. Several preprocessing steps utilized FSL9. Diffusion images were denoised10, corrected for Gibbs ringing11, susceptibility distortions12, motion13, and eddy currents14. All images were then resampled to a voxel size of 1.3x1.3x1.3mm3. Average response functions were generated for WM, grey matter (GM), and CSF from the images15 and the fiber orientation distribution (FOD) calculated for each voxel2,3. Tissue signal fractions were calculated from the FODs in each cohort and the CSF-like tissue compartment was restricted to voxels where the majority of signal fraction was from a combination of the WM-like and GM-like compartments as a measurement of free water. All free water maps were transformed to MNI space via WM-FOD based registration of each subject’s diffusion data to the diffusion template created by Hsu et al.16. In MNI space a weighted average was calculated for 27 ROIs from bilateral probabilistic cytoarchitectonic maps17-19, free water signal fraction was additionally calculated across the whole brain parenchyma.
Statistical analysis was performed for the weighted average free water signal fractions in each ROI by creating linear models with each subject’s acquisition parameters and demographic factors as predictor variables. Stepwise model selection by Akaike Information Criterion20 was performed to create final models with predictors.
Results
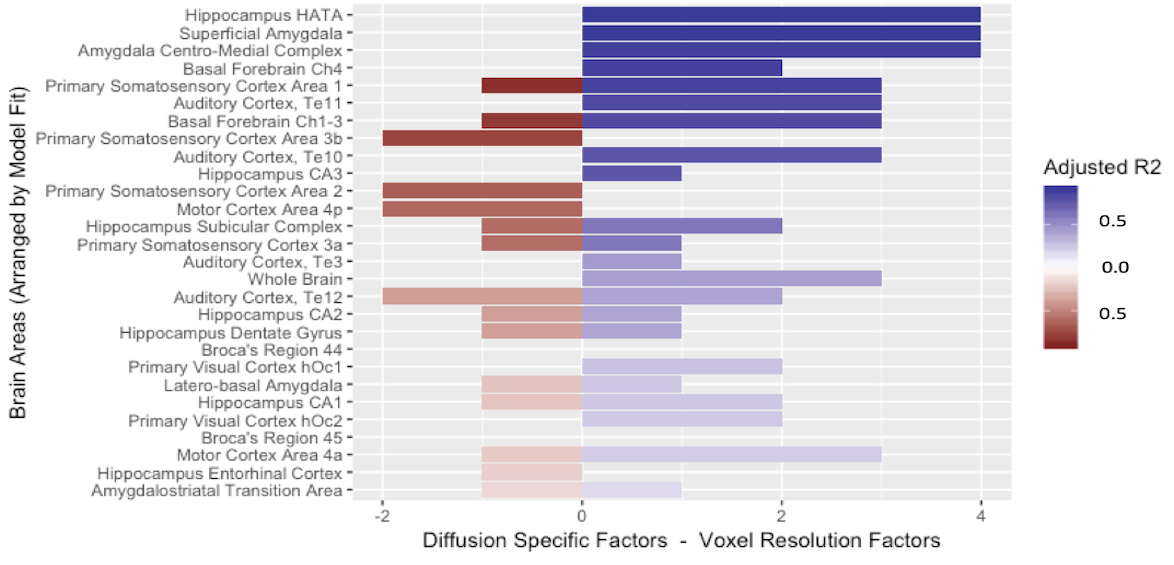
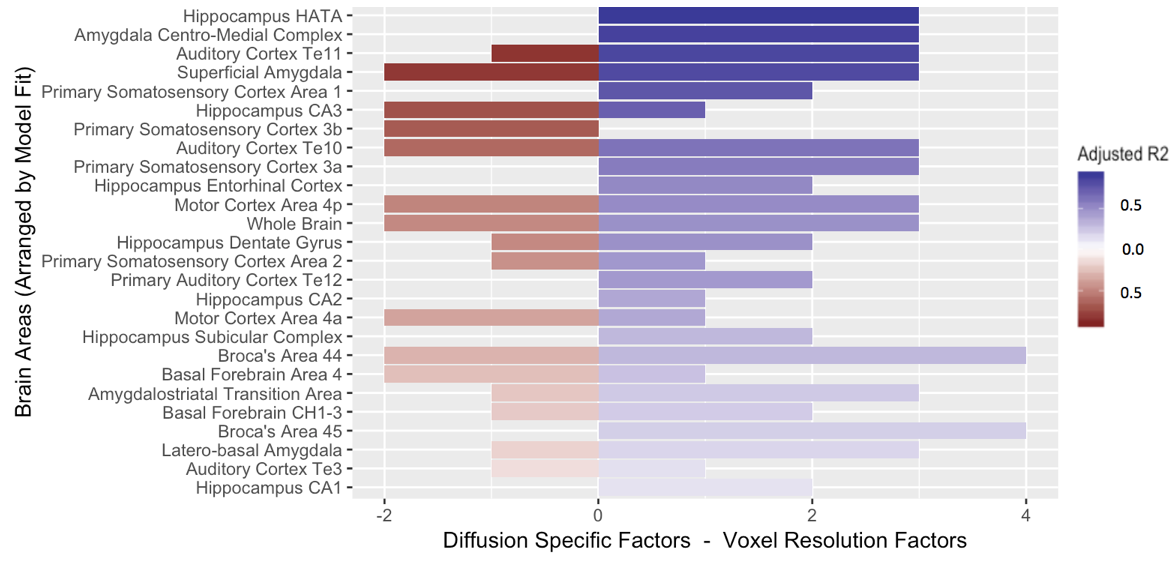
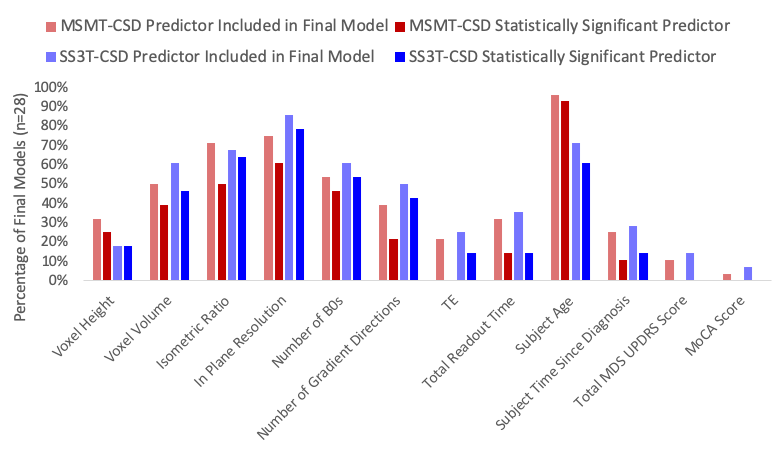
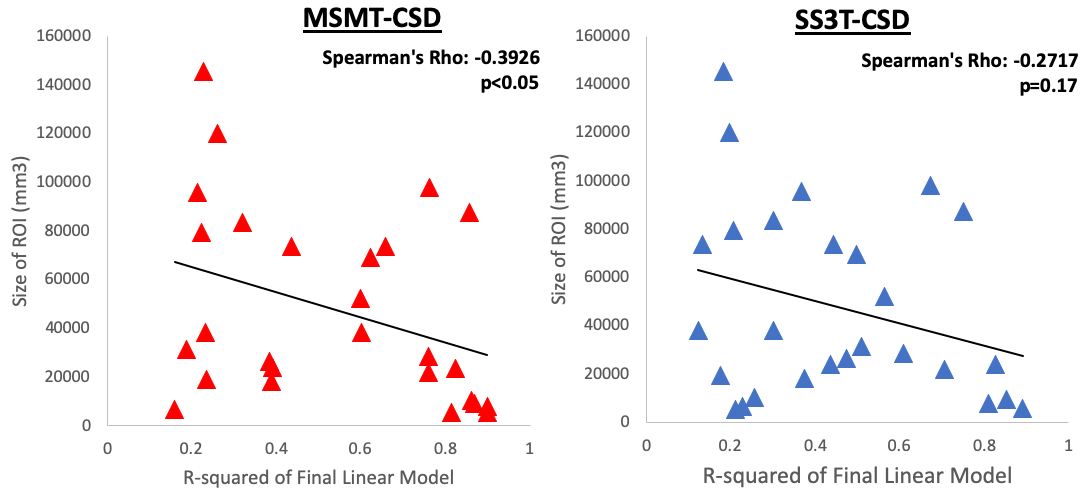
A significantly predictive model was able to be constructed for the free water signal fraction in each ROI across all subjects. Adjusted R2 ranged from 0.159 to 0.899 in the MSMT-CSD results (Figure 2) and from 0.122 to 0.891 in the SS3T-CSD results (Figure 3). There was a significant difference in average model fit, with the acquisition parameter and demographic models significantly less able to predict free water signal fraction derived from SS3T-CSD (mean adj-R2 = 0.448) than MSMT-CSD (mean adj-R2 = 0.530; ANOVA F1,25 = 25.89, p<0.001). The most common significant predictor in the MSMT-CSD derived-measures was age but PD symptomatic scores did not significantly predict free water signal fraction. The in-plane resolution, number of b=0 images, isometric ratio of voxel size, and voxel volume significantly predicted the outcome measurement for all but three ROIs. In the SS3T-CSD models, the in-plane resolution was the most common significant predictor, followed by age, the isometric ratio, number of b=0s, voxel volume, and number of gradient directions (Figure 4). There was a significant negative correlation between model goodness-of-fit and the size of the ROI from MSMT-CSD but this was not significant in SS3T-CSD (Figure 5), suggesting that free water in smaller ROIs were more dependent on different acquisition parameters.Conclusion
Free water signal fractions derived from MSMT-CSD and SS3T-CSD were both dependent on acquisition factors related to the selection of common imaging parameters. Further analysis suggests that SS3T-CSD is overall more robust and less affected. However, when employing these algorithms or collecting data, harmonization of imaging acquisition parameters is paramount in any case.Acknowledgements
No acknowledgement found.References
1. Newman BT, Dhollander T, Reynier KA, Panzer MB, Druzgal TJ. Test-retest reliability and long-term stability of 3-tissue constrained spherical deconvolution methods for analyzing diffusion MRI data. BioRxiv. 2019.
2. Dhollander, T., & Connelly, A. (2016). A novel iterative approach to reap the benefits of multi-tissue CSD from just single-shell (+ b=0) diffusion MRI data. In Proc ISMRM (Vol. 24, p. 3010).
3. Jeurissen, B., Tournier, J. D., Dhollander, T., Connelly, A., & Sijbers, J. (2014). Multi-tissue constrained spherical deconvolution for improved analysis of multi-shell diffusion MRI data. NeuroImage, 103, 411-426.
4. Ning, L., Bonet-Carne, E., Grussu, F., Sepehrband, F., Kaden, E., Veraart, J., ... & Scherrer, B. (2018, September). Muti-shell Diffusion MRI Harmonisation and Enhancement Challenge (MUSHAC): Progress and Results. In International Conference on Medical Image Computing and Computer-Assisted Intervention (pp. 217-224). Springer, Cham.
5. Karayumak, S. C., Bouix, S., Ning, L., James, A., Crow, T., Shenton, M., ... & Rathi, Y. (2019). Retrospective harmonization of multi-site diffusion MRI data acquired with different acquisition parameters. NeuroImage, 184, 180-200.
6. Zhu, A. H., Moyer, D. C., Nir, T. M., Thompson, P. M., & Jahanshad, N. (2018, September). Challenges and Opportunities in dMRI Data Harmonization. In International Conference on Medical Image Computing and Computer-Assisted Intervention (pp. 157-172). Springer, Cham.
7. Mirzaalian, H., Ning, L., Savadjiev, P., Pasternak, O., Bouix, S., Michailovich, O., ... & Flashman, L. A. (2018). Multi-site harmonization of diffusion MRI data in a registration framework. Brain imaging and behavior, 12(1), 284-295.
8. Tournier, J. D., Smith, R., Raffelt, D., Tabbara, R., Dhollander, T., Pietsch, M., ... & Connelly, A. (2019). MRtrix3: A fast, flexible and open software framework for medical image processing and visualisation. NeuroImage, 116137.
9. Jenkinson, M., Beckmann, C. F., Behrens, T. E. J., Woolrich, M. W., & Smith, S. M. (2012). FSL. NeuroImage, 62(2), 782-790.
10. Veraart, J., Fieremans, E., & Novikov, D. S. (2016). Diffusion MRI noise mapping using random matrix theory. Magnetic resonance in medicine, 76(5),1582-1593.
11. Kellner, E., Dhital, B., Kiselev, V. G., & Reisert, M. (2016). Gibbs‐ringing artifact removal based on local subvoxel‐shifts. Magnetic resonance in medicine, 76(5), 1574-1581.
12. Smith, S. M., Jenkinson, M., Woolrich, M. W., Beckmann, C. F., Behrens, T. E., Johansen-Berg, H., ... & Niazy, R. K. (2004). Advances in functional and structural MR image analysis and implementation as FSL. NeuroImage, 23, S208-S219.
13. Andersson, J. L., Graham, M. S., Zsoldos, E., & Sotiropoulos, S. N. (2016). Incorporating outlier detection and replacement into a non-parametric framework for movement and distortion correction of diffusion MR images. NeuroImage, 141, 556-572.
14. Andersson, J. L., & Sotiropoulos, S. N. (2016). An integrated approach to correction for off-resonance effects and subject movement in diffusion MR imaging. NeuroImage, 125, 1063-1078
15. Dhollander, T., Raffelt, D., & Connelly, A. (2016). Unsupervised 3-tissue response function estimation from single-shell or multi-shell diffusion MR data without a co-registered T1 image. In ISMRM Workshop on Breaking the Barriers of Diffusion MRI(Vol. 5).
16. Hsu, Y. C., Lo, Y. C., Chen, Y. J., Wedeen, V. J., & Isaac Tseng, W. Y. (2015). NTU‐DSI‐122: A diffusion spectrum imaging template with high anatomical matching to the ICBM‐152 space. Human brain mapping, 36(9), 3528-3541.
17. Amunts, K., Kedo, O., Kindler, M., Pieperhoff, P., Mohlberg, H., Shah, N. J., ... & Zilles, K. (2005). Cytoarchitectonic mapping of the human amygdala, hippocampal region and entorhinal cortex: intersubject variability and probability maps. Anatomy and embryology, 210(5-6), 343-352.
18. Lorio, S., Fresard, S., Adaszewski, S., Kherif, F., Chowdhury, R., Frackowiak, R. S., ... & Draganski, B. (2016). New tissue priors for improved automated classification of subcortical brain structures on MRI. Neuroimage, 130, 157-166.
19. Zaborszky, L., Hoemke, L., Mohlberg, H., Schleicher, A., Amunts, K., & Zilles, K. (2008). Stereotaxic probabilistic maps of the magnocellular cell groups in human basal forebrain. Neuroimage, 42(3), 1127-1141.
20. Venables, W. N. and Ripley, B. D. (2002) Modern Applied Statistics with S. Fourth edition. Springer.
Figures