4305
Reproducibility of Diffusion MRI Metrics Using 4-way Phase-Encoding Acquisition Design1QMI, NIBIB/NIH, Bethesda, MD, United States, 2NIBIB/NIH, Bethesda, MD, United States, 3NINDS/NIH, Bethesda, MD, United States
Synopsis
In this work, we assessed the reproducibility of diffusion MRI metrics w.r.t different experimental and acquisition designs within the same scan time limits. The design that employed identical diffusion gradients and b-values for blip-up phase-encoding and blip-down phase-encoding provided significant improvements in terms of data reproducibility compared to the design using a single b=0 blip-down image in terms of distortions. The proposed 4-way encoding scheme not only improved upon this design but also consistently reduced the effects of other imaging artifacts; therefore, is suggested to be the acquisition scheme of choice for dMRI studies where biological differences are subtle.
Introduction
Obtaining accurate diffusion MRI (dMRI) results is challenging given that diffusion weighted images (DWIs) are susceptible to artifacts, such as ghosting, Gibbs ringing, signal drops and misalignments due to motion and eddy-currents distortions. Additionally, DWIs also suffer from geometric distortions and signal expansions/contractions along the phase-encoding direction. These "EPI distortions" have been shown to have a significant impact on dMRI reproducibility1,2. Even with blip-up blip-down correction, which virtually removes these distortions, the other aforementioned artifacts are still present in the data. We hypothesize that one way to overcome this problem is 4-way phase-encoding: AP/PA/LR/RL. Data acquired with different phase-encoding directions would have these artifacts at different locations and an "intelligent" way of combining the four datasets would reduce their effects. In this work, we analyze the reproducibility of dMRI-derived metrics w.r.t four different acquisition designs using different phase-encoding paradigms.Materials
Acquisition Designs: The two most common approaches to phase-encoding dMRI, are to use a single phase-encoding direction (in this work referred as Design0) or reversed-phase encoding with a single b=0 s/mm2 image in the opposite direction (Design1). The third approach that is less common, is to acquire both the blip-up and down datasets with identical diffusion gradients and b-values, i.e B-matrix (Design2), which allows the combination of the two sets into a single one with higher SNR. The proposed design (Design3) uses all the phase encoding directions3: AP/PA/LR/RL. AP/PA are acquired with identical B-matrices so are LR/RL. However, the RL/LR pair is optimized to have different but complementary B-matrices to AP/PA. Even though AP/PA set alone has half the number of gradient directions compared to Design2, the effective number of gradients in the combined APLR set is identicalDatasets: dMRI data was collected from seven subjects, five times, using a Philips Achieva 3T system. Acquisition parameters were: ,TE/TR: 92/12875ms, SENSE=2, res=2mm isotropic, b-values: b= 0, 50, 300, 1100, 2700 s/mm2) . For Design0 and Design1, the number of volumes for these shells were: four, eight, eight, 64 and 64. To achieve identical scan times among all designs, these numbers were halved for Design2. For Design3, the diffusion encodings used in Design2 were near-optimally split between AP and RL sets. A fat-suppressed T2W-TSE and a T1W-MPRAGE image were also acquired as structural images. The total scan session took 1h45mins.
Processing & Analysis
Preprocessing: DWI pre-processing was performed separately using two pipelines, TORTOISE4 and FSL5 to confirm that any conclusions about reproducibility was not pipeline-dependent. For TORTOISE, gradient-nonlinearities were corrected first, followed by Gibbs-ringing correction, motion&eddy-currents and susceptibilty distortion corrections. For FSL, susceptibility distortion correction was performed initially followed by motion&eddy-currents distortion correction including outlier rejection, slice-to-volume registration and per-volume re-estimation of susceptibility. With both pipelines, DWIs were rigidly aligned to the T2W structural of the first scan session and were output at 1mm isotropic resolution. APPA and LRRL data were simply concatenated.Variability analysis: For each subject, reproducibility between the five visits was assessed via voxelwise standard deviations for FA and TR from the DTI6 and RTOP, PA and NG maps from the MAPMRI7 models. To summarize all these statistics in the same space for all subjects, a diffusion tensor based registration8 was performed on all data and a template space was generated. All the individual standard deviation maps were subsequently warped on to the template space and averaged over the subjects to get a population level summary statistic.
Results
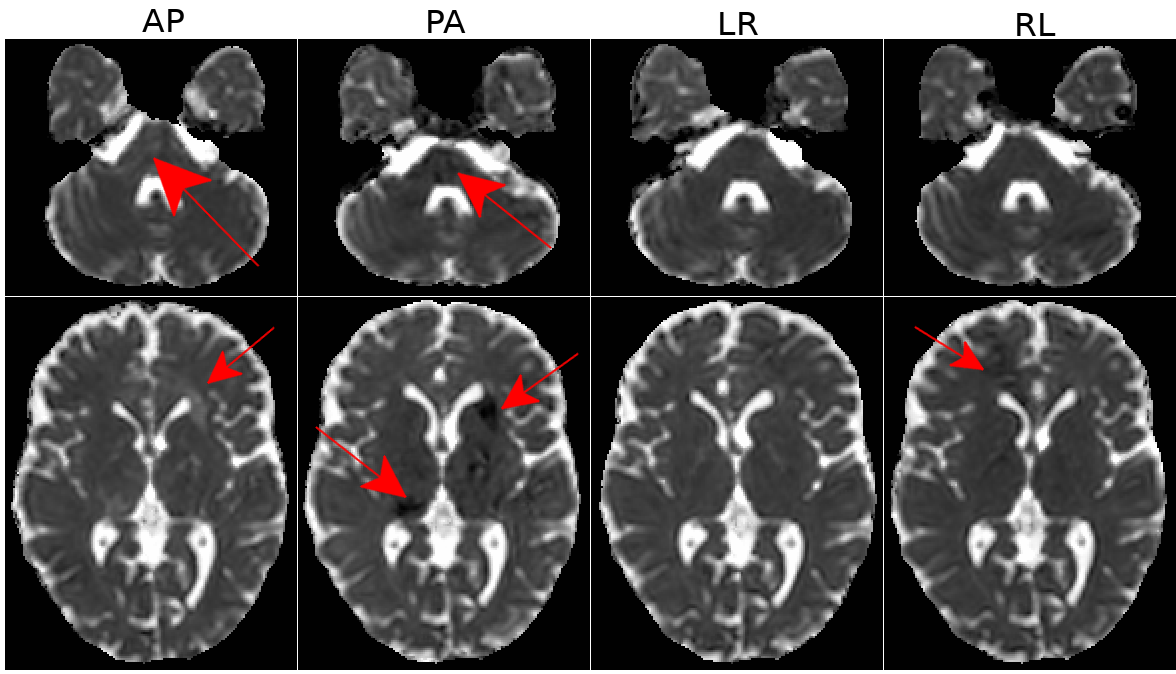
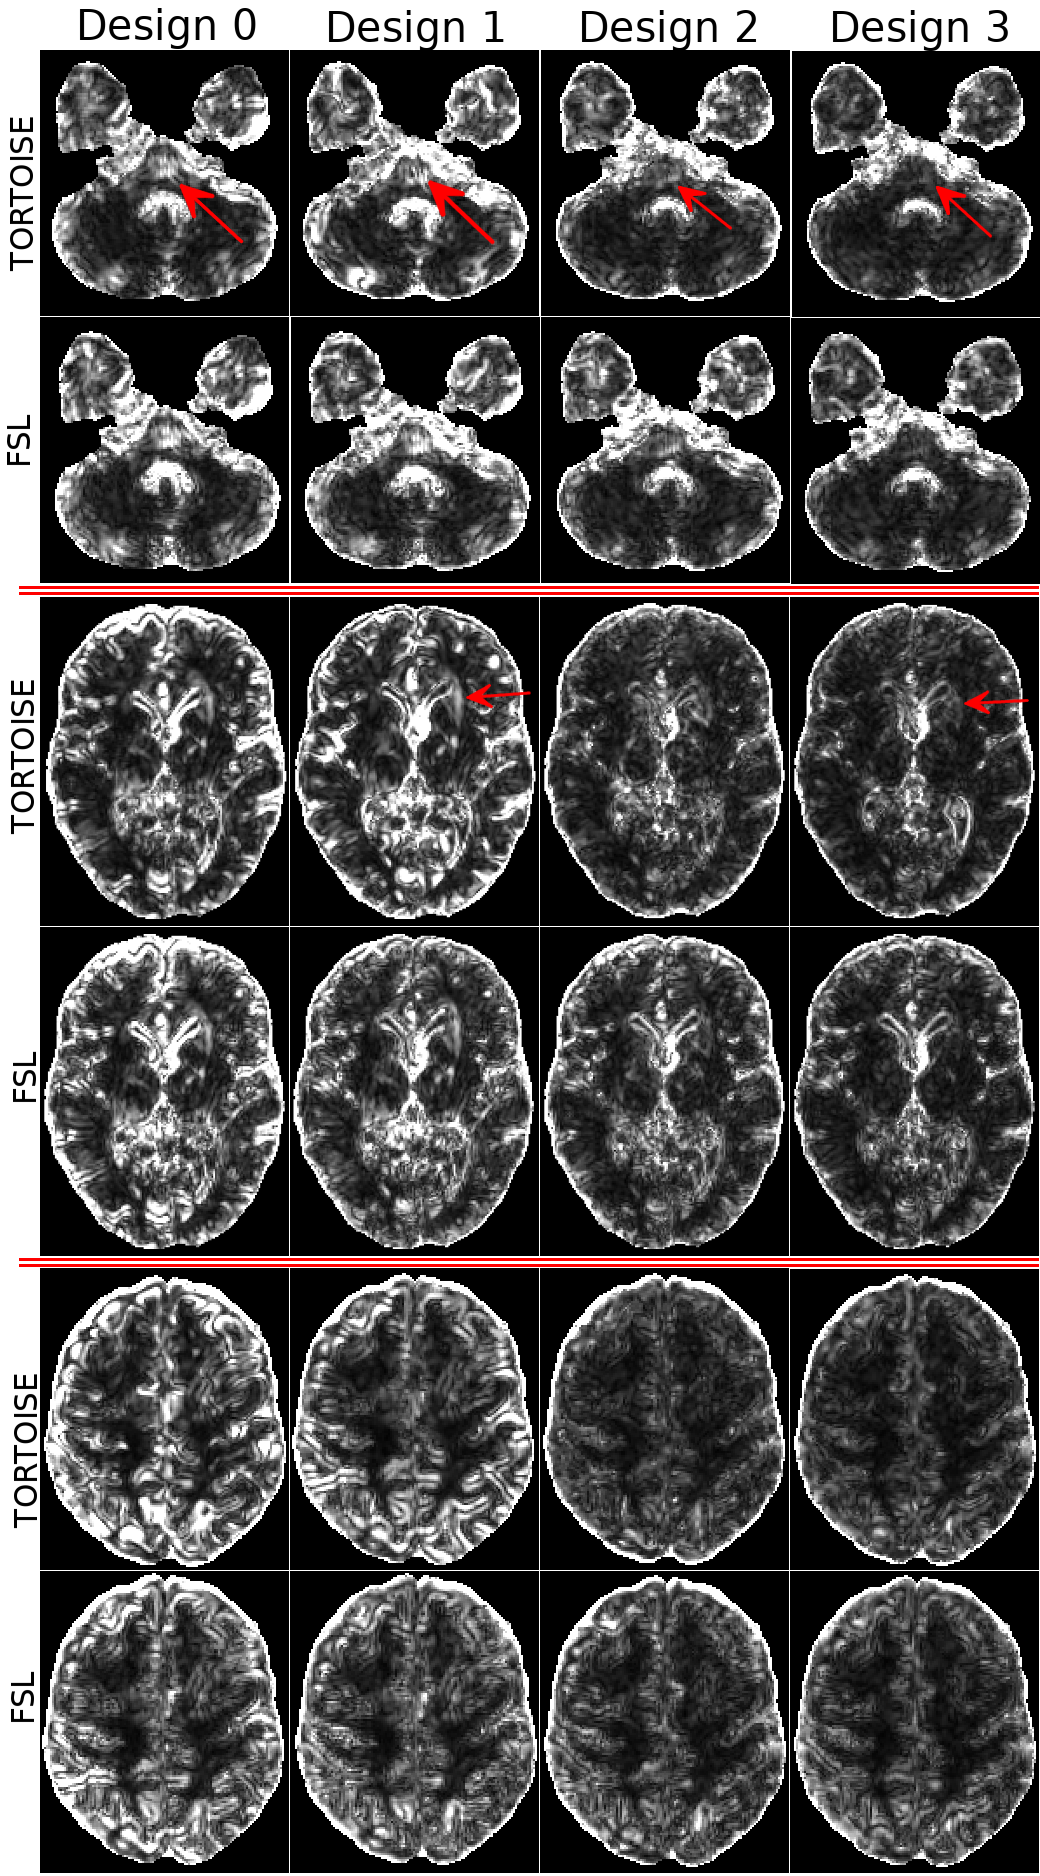
As an illustration of our hypothesis, Figure 1 displays the TR map for one subject prior to EPI distortion correction. These maps contain erroneous diffusivity measures due to imaging artifacts (red arrows) that can not simply be removed by distortion correction.Figure 2 displays the standard deviation of TR maps for a single subject. As expected, Design0 results in the largest variability. With Design1, even though the anatomical accuracy of the images are improved (not shown), reproducibility is not. The largest improvement in reproducibility can be observed in Design2 compared to Design1, where an entire set of blip-down data is used. Significant improvements can also be observed between Design3 and Design2: the effects of the imaging artifacts in the brainstem region is nearly absent in Design3 (arrows). Design3 also slightly improved overall reproducibility within the brain for TR.
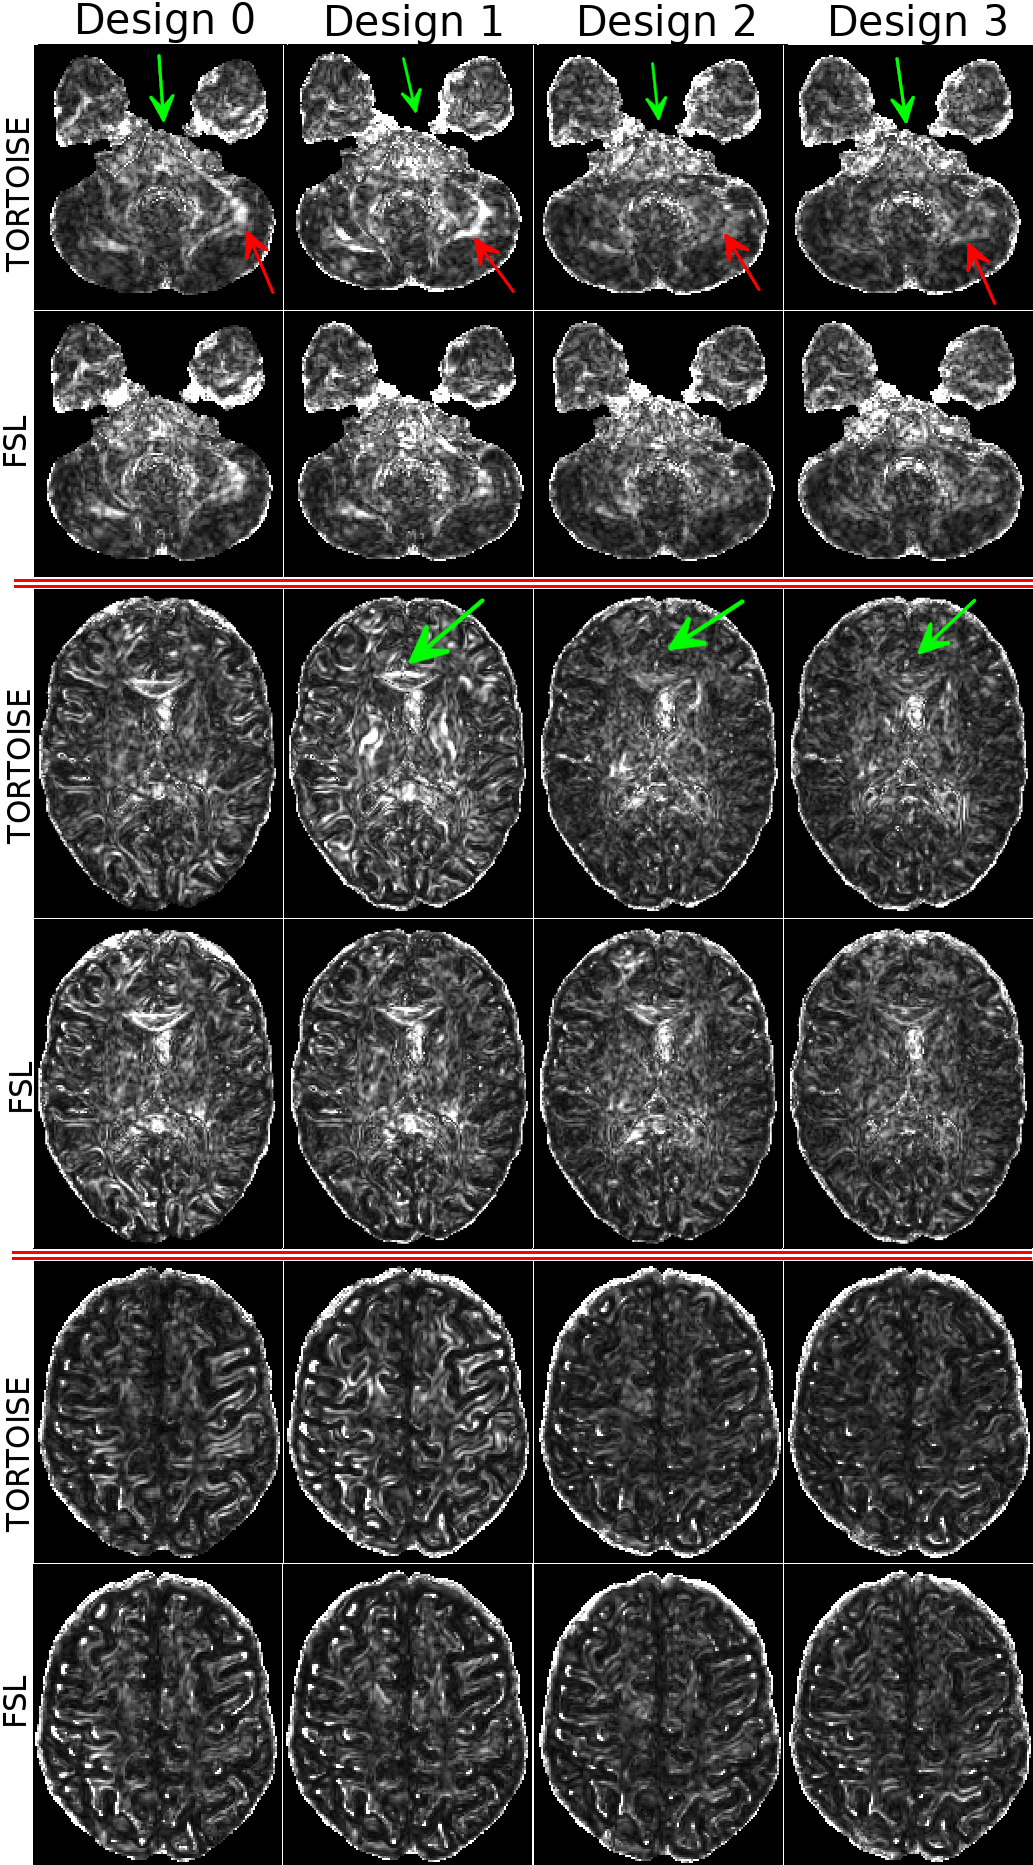
Figure 3 displays the variability maps for FA. With every consecutive designs, the large variability in the cerebellar regions get reduced (red arrows). The effect of the use of diffusion information by TORTOISE is more apparent in FA compared to MD, both in overall brain and specifically within the brainstem and Corpus Callosum regions (green arrows).
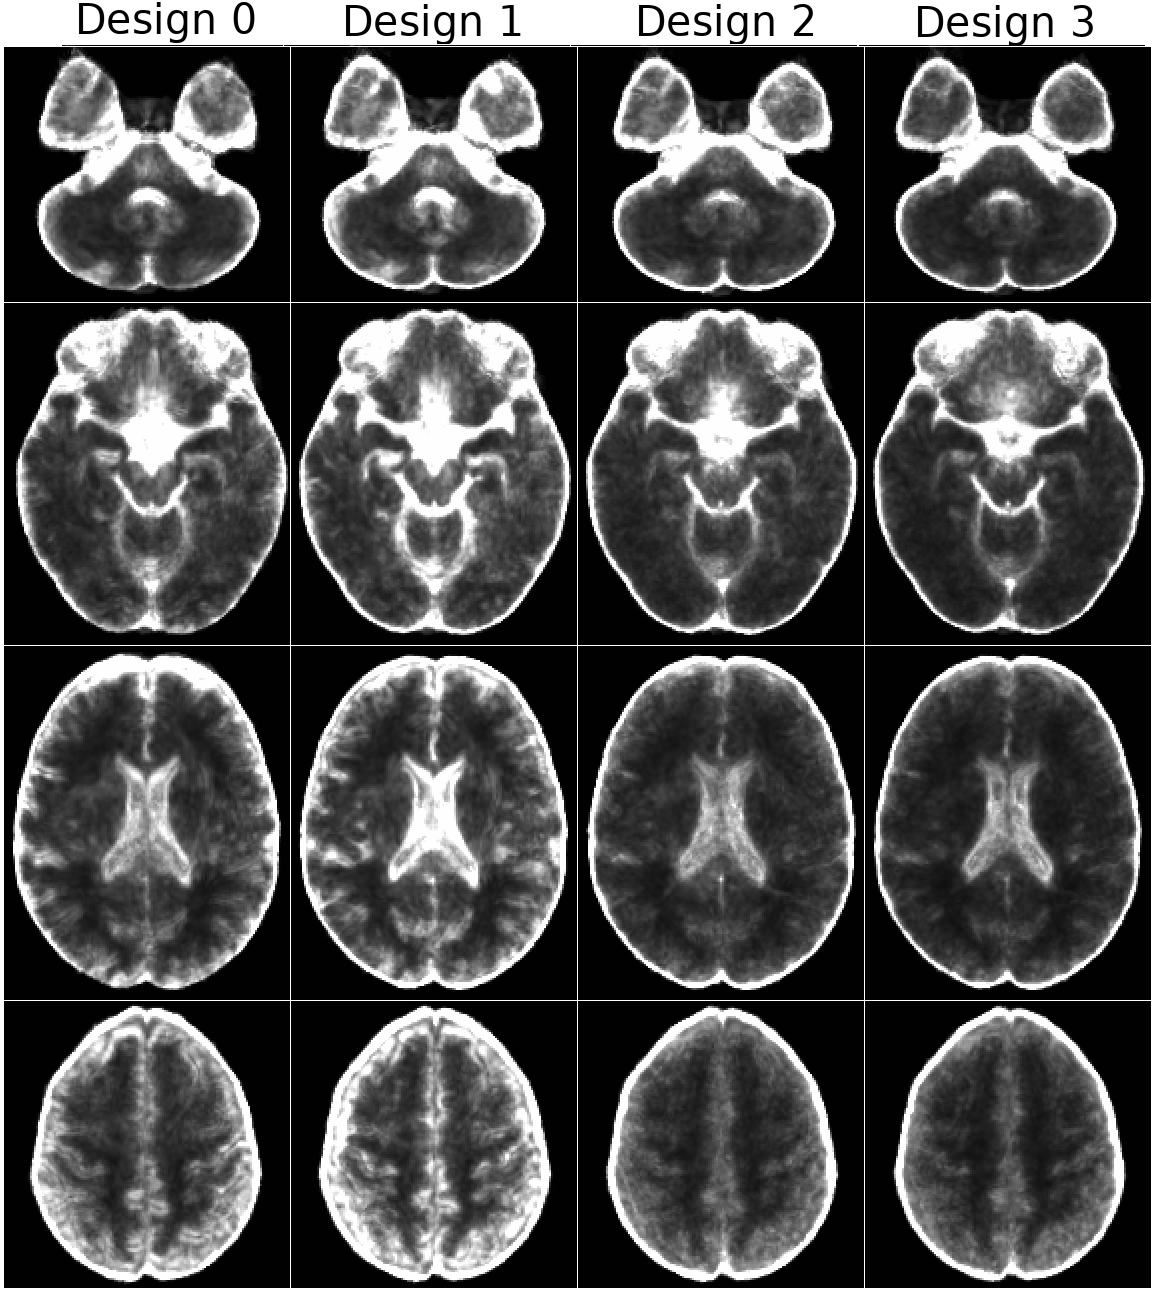
Figure 4 displays the average TR variability map on the template space, which confirms the previous findings on a population level.
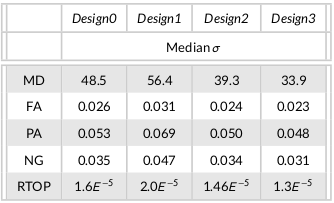
Table 1 displays the quantitative measures from the population level data. For all the DTI and MAPMRI-derived maps, the median standard deviations significantly reduced for Design2, while Design3 further improving the reproducibility.
Conclusion
In the exploration of subtle biological differences, the variability observed due to imaging artifacts can overshadow biology. For such studies, where data robustness is of fundamental importance, 4-way phase-encoding direction has been shown to provide the best reliability, therefore, is suggested to be the acquisition scheme of choice.Acknowledgements
This research was supported by the Intramural Research Program of the National Institute of Biomedical Imaging and Bioengineering and National Institute of Neurological Disorders and Stroke in the National Institutes of Health. The contents of this work do not necessarily reflect the position or the policy of the government, and no official endorsement should be inferred. The authors would also like to thank Susan Fulton and Steven Newman for their efforts in subject recruitment.References
1. Wu M, Chang LC, Walker L, Lemaitre H, Barnett AS, Marenco S, et al. Comparison of EPI Distortion Correction Methods in Diffusion Tensor MRI Using a Novel Framework. Proceedings of MICCAI 2008;11:321–329
2. Irfanoglu MO, Walker L, Sarlls J, Marenco S, Pierpaoli C. Effects of image distortions originating from susceptibility variations and concomitant fields on diffusion MRI tractography results. Neuroimage 2012;15(61):275–288.
3. Bastiani M, Andersson JLR, Cordero-Grande L, Murgasova M, Hutter J, Price AN, et al. Automated processing pipeline for neonatal diffusion MRI in the developing Human Connectome Project. NeuroImage 2019;185:750 – 763.
4. Pierpaoli C, Walker L, Irfanoglu MO, Barnett AS, Chang LC, Koay CG, et al. TORTOISE: An integrated software package for processing of diffusion MRI data. In: Proceedings of International Society of Magnetic Resonance in Medicine; 2010.p. 1597.
5. Smith SM, Jenkinson M, Woolrich MW, Beckmann CF, Behrens TE, Johansen-Berg H, et al. Advances in functional and structural MR image analysis and implementation as FSL. Neuroimage 2004;23(1):208–219.
6. Basser PJ, Mattiello J, Le Bihan D. Estimation of the effective self-diffusion tensor from the NMR spin echo. Journal of Magnetic Resonance 1994;103:247–254.
7. Özarslan E, Koay CG, Shepherd TM, Komlosh ME, Irfanoglu MO, Pierpaoli C, et al. Mean apparent propagator (MAP)MRI: A novel diffusion imaging method for mapping tissue microstructure. NeuroImage 2013;78:16–32.
8. Irfanoglu MO, Nayak A, Jenkins J, Hutchinson EB, Sadeghi N, Thomas CP, et al. DR-TAMAS: Diffeomorphic Registration for Tensor Accurate Alignment of Anatomical Structures. NeuroImage 2016;132:439 – 454.
Figures