4303
Simultaneous Acquisition of Dynamic Diffusion Imaging and Diffusion Tensor Imaging in the Brain1Center for Neuroscience and Regenerative Medicine, Bethesda, MD, United States, 2National Institutes of Health, Bethesda, MD, United States
Synopsis
We propose a diffusion acquisition scheme, called “nested cubes”, consisting of five triplets of three unique mutually orthogonal directions, providing diffusion weighted data sampled across fifteen noncollinear directions distributed uniformly across a spherical shell. Data acquired using this setup facilitates the simultaneous acquisition of dynamic maps of trace and other diffusion metrics while producing DTI measurements comparable to those from a standard DTI sequence.
Introduction
Dynamic diffusion imaging provides a promising means of noninvasively detecting and localizing sources of transient cellular swelling in the brain. Such swelling is known to occur during and following epileptic seizures1,2, as well as during cortical spreading depolarizations3,4. We propose a diffusion acquisition scheme collecting diffusion weighted images (DWIs) necessary for diffusion tensor imaging (DTI) that may also be used to compute time series maps of trace, ADC and eADC with relatively high temporal and spatial resolution. Our approach can be implemented on a clinical scanner and has the potential to monitor neurological disorders where transient cellular edema plays an important role.Methods
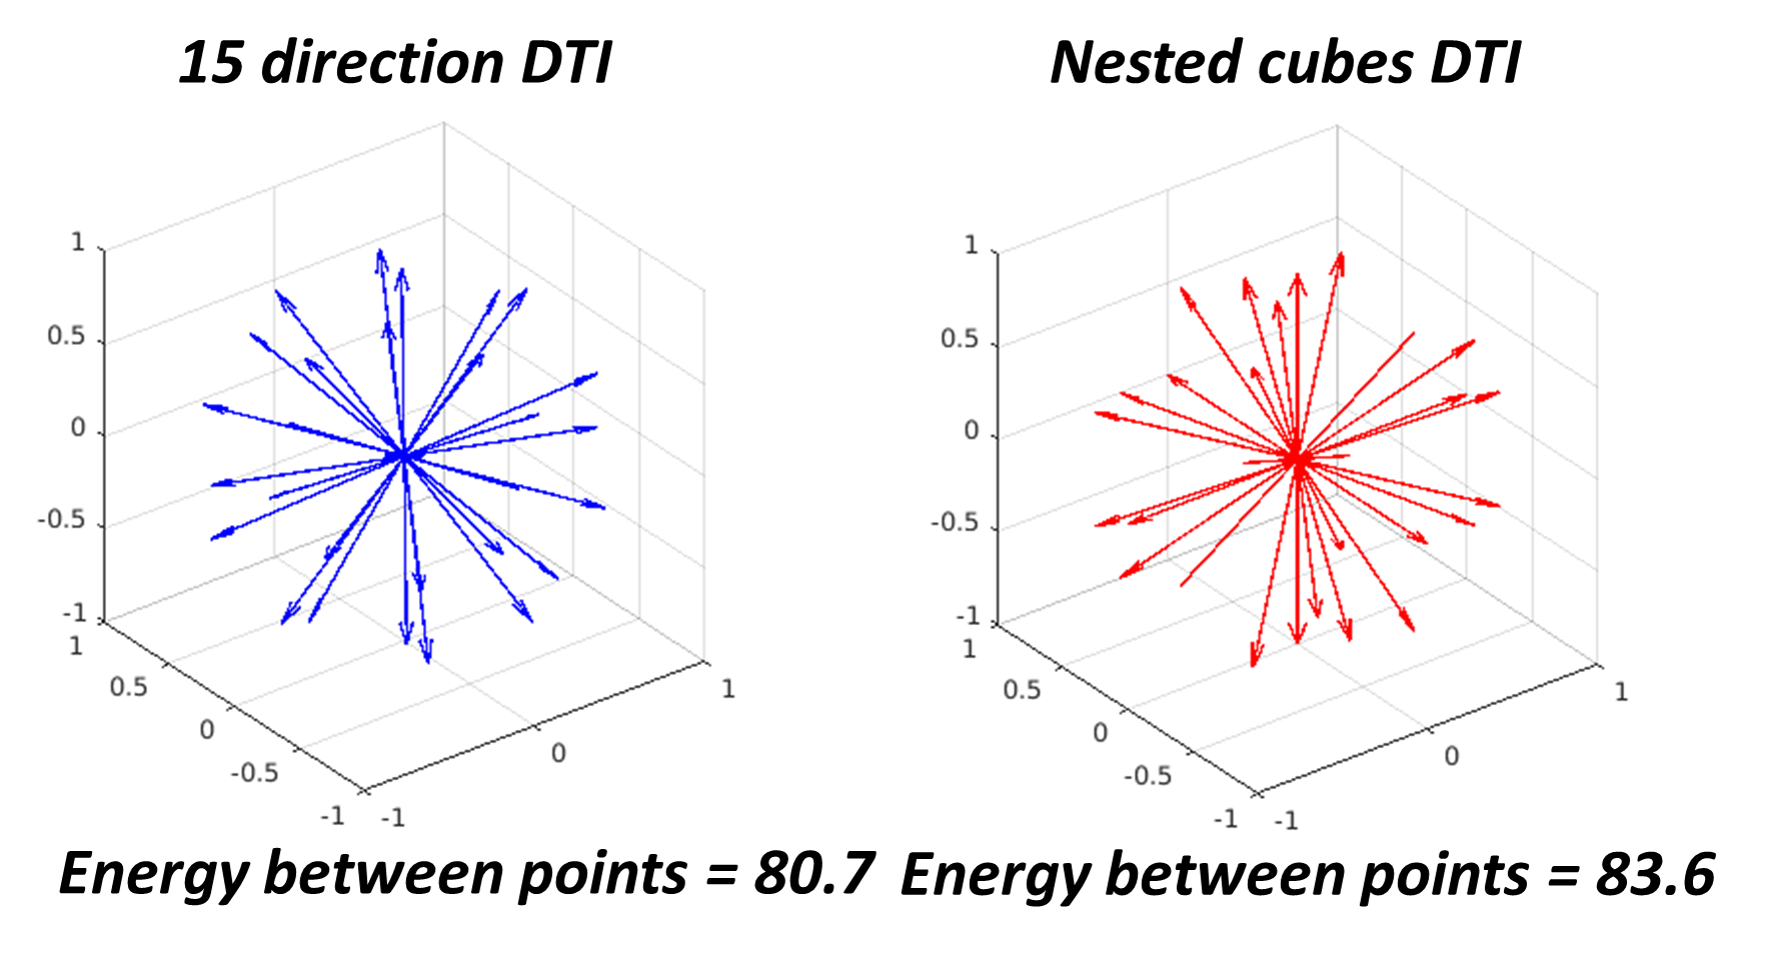
The “nested cubes” diffusion scheme was derived by determining orthogonal triplets that provide optimal coverage of a spherical shell. The gradient directions can be determined numerically5 but for certain configurations, a geometric interpretation affords an analytic solution. For 15 non-collinear directions, one can assume that the three directions constituting an orthogonal triplet are represented by the edges at one vertex of a cube. The vertices of five differently oriented nested cubes are known to form a regular dodecahedron6 with vertices uniformly sampling a sphere. We therefore implemented a gradient table that uses the orthogonal triplets generated by those five nested cubes. Diffusion datasets with isotropic spatial resolution (2x2x2mm3) were acquired in healthy volunteers on Siemens 3T mMR Biograph (TR/TE = 8800/75 ms) and Philips 3T Achieva (TR/TE = 7400/75 ms) scanners. Three sets of diffusion weighted orientations (b = 1000 s/mm2) were collected: five repetitions of three mutually orthogonal directions, 15 unique orientations (DTI), and 15 orientations consisting of five unique sets of three mutually orthogonal orientations (nested cubes). A single non-diffusion weighted volume (b = 0 s/mm2) was collected at the start of each acquisition. With these parameters, the temporal resolution of the time series diffusion measures was approximately 30 seconds. Diffusion datasets were coregistered and processed using TORTOISE to correct for motion and eddy current distortions as well as to estimate the diffusion tensor, and fractional anisotropy (FA) maps7. Trace, apparent diffusion coefficient (ADC) and exponential ADC (eADC) maps were calculated using the geometric mean of the DWIs collected across 15 directions and the averaged non diffusion weighted images. Time series maps of trace, ADC and eADC were calculated from the dynamic scans using each set of three mutually orthogonal directions. Temporal SNR (tSNR) maps were calculated by dividing the mean of each dynamic measure by its standard deviation across time. Color FA maps were calculated by scaling the principal eigenvector (ε1) of the diffusion tensor by the FA.Results
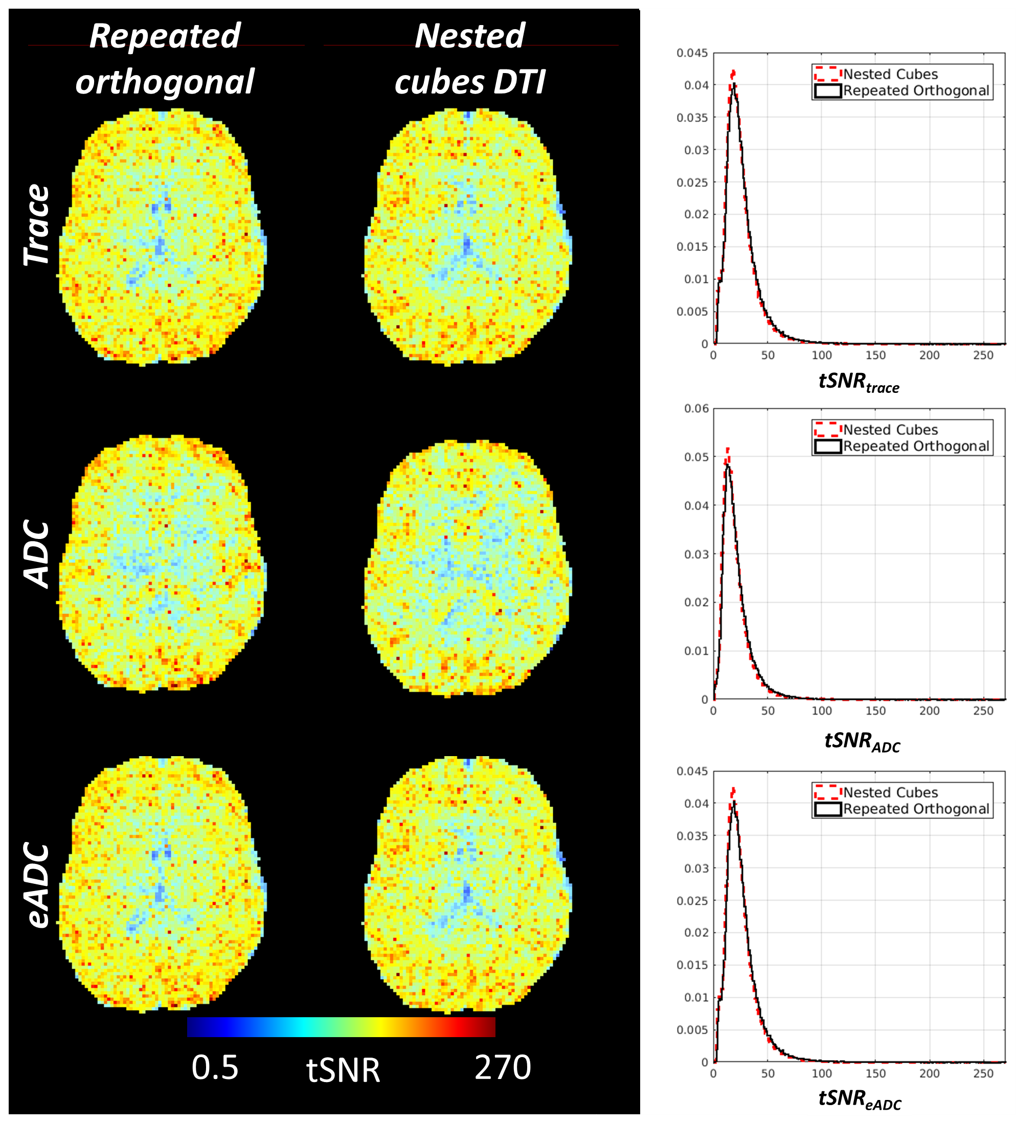
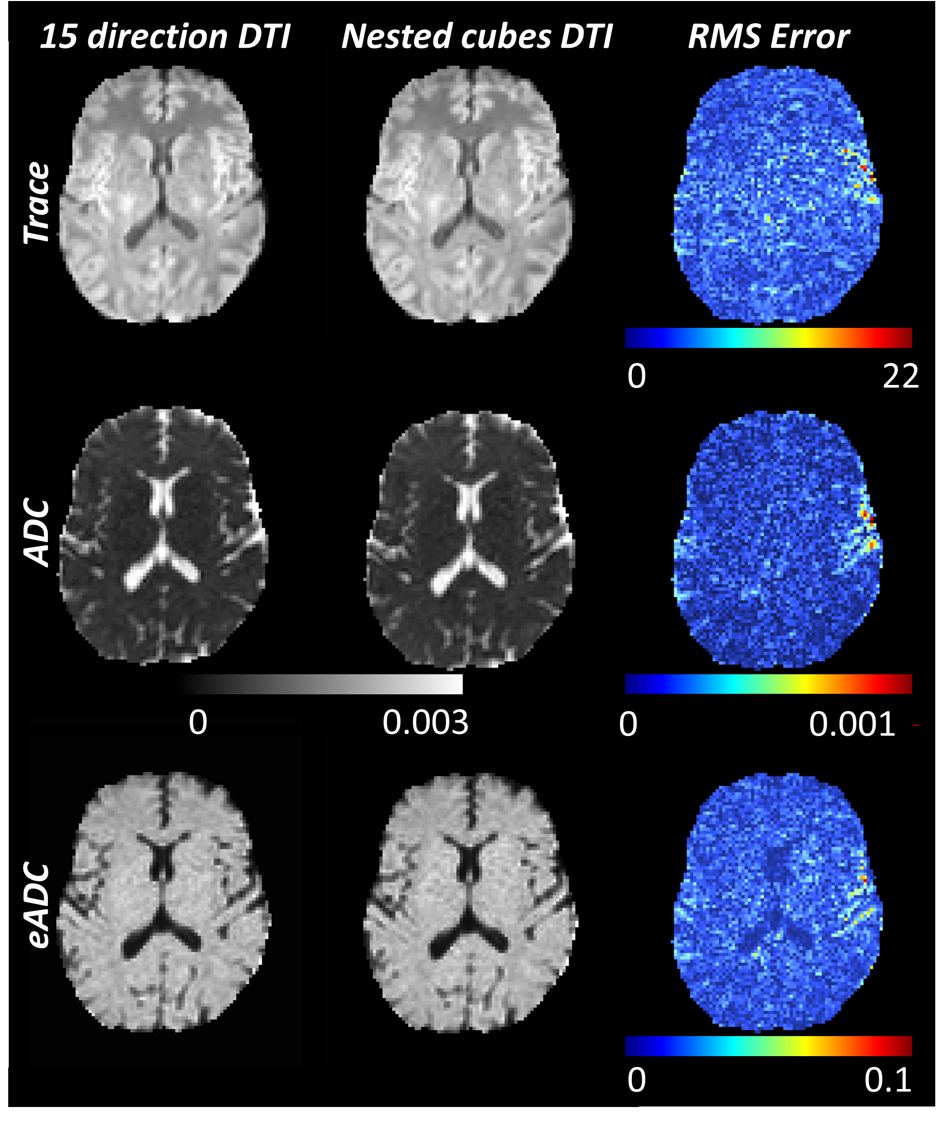
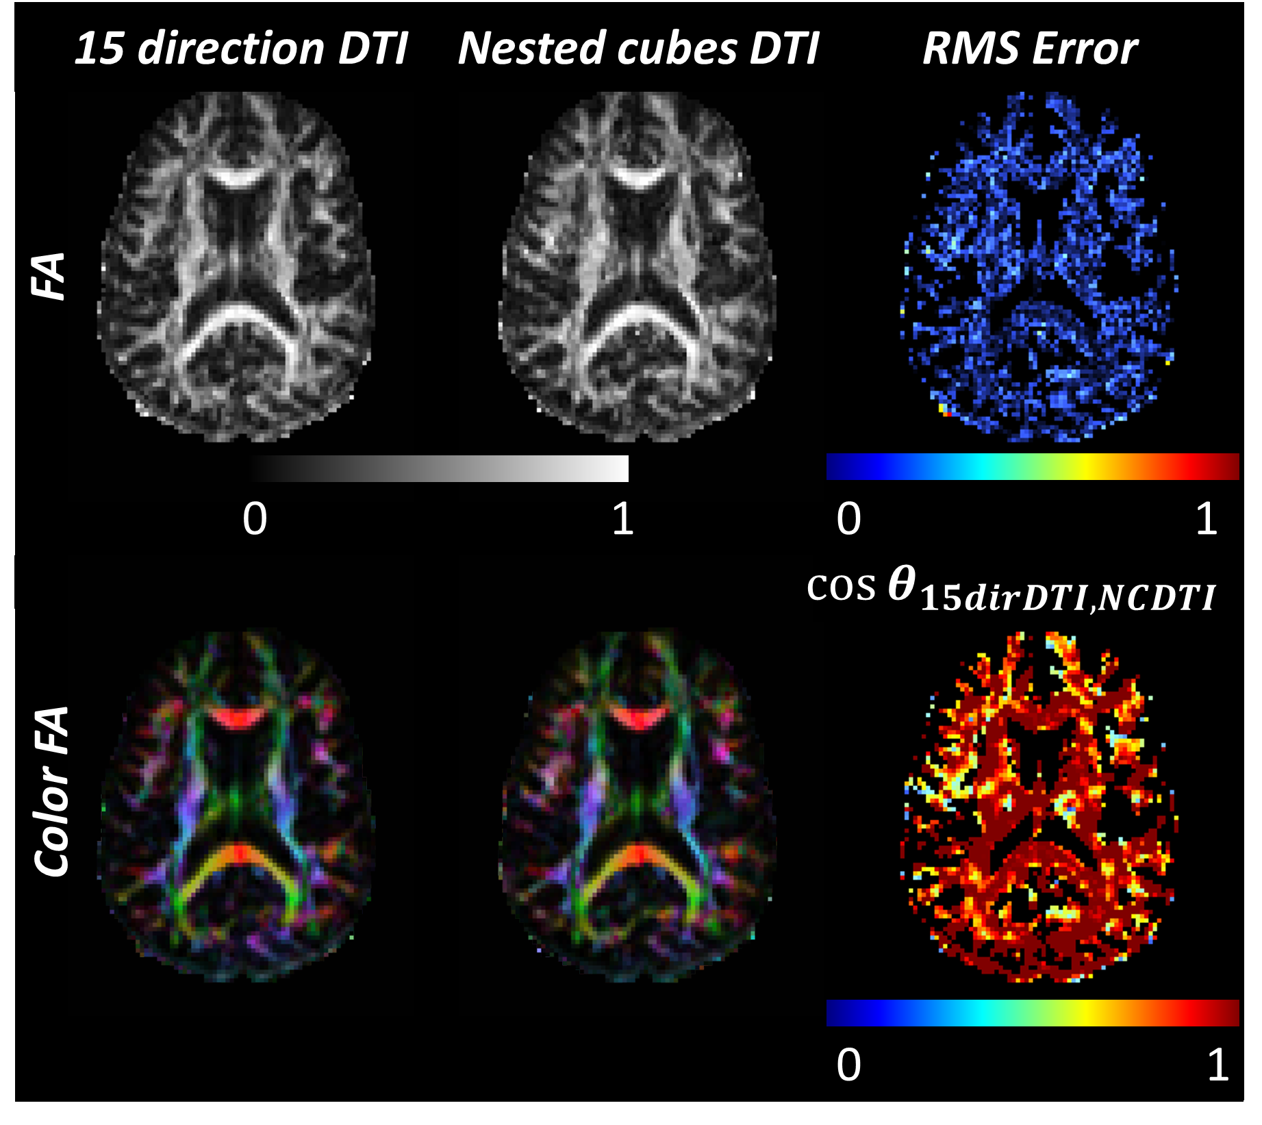
The total energy between the points formed by the vectors of the gradient table was calculated using the Electrostatic Energy Minimization theorem8 to quantitatively compare a standard 15 direction with the nested cubes gradient table (Figure 1). The total energy between points from a standard 15 direction DTI diffusion vector set was 80.7 distance units while the total energy between points from the nested cubes vector set was 83.6 distance units, indicating that a standard 15 direction DTI gradient table sampled more evenly across a spherical surface. Temporal SNR (tSNR) of dynamic maps of trace, ADC and eADC calculated from five repetitions of three mutually orthogonal directions were comparable with the nested cubes diffusion scheme (Figure 2). Using the repeated orthogonal direction acquisition, tSNR of trace averaged 24.6 (SD = 16.9), tSNR of ADC averaged 21.2 (SD = 15.1) and tSNR of eADC averaged 25.9 (SD = 16.8). Using the nested cubes acquisition, tSNR of trace averaged 24.6 (SD = 15.7), tSNR of ADC averaged 19.9 (SD = 14.1) and tSNR of eADC averaged 24.6 (SD = 15.8). The root mean square (RMS) errors of trace, ADC and eADC between the 15 direction DTI and the nested cubes acquisitions were below the range of values in both gray and white matter (Figure 3). Similarly, the RMS error of FA between the two acquisitions was near zero and below the range of FA in the majority of white matter voxels, with corresponding regions showing high agreement in DTI based fiber orientation (Figure 4).Discussion
These results demonstrate the feasibility of acquiring diffusion data that not only allow for the calculation of DTI metrics, but also provide time series maps of diffusivity measures. A standard 15 direction DTI gradient table provided even sampling across a spherical surface compared with the nested cubes gradient table. However, DTI metrics were comparable between the two sequences. Moreover, acquisition of diffusion data using the nested cubes diffusion scheme proved advantageous by simultaneously collecting data for dynamic diffusivity maps with tSNR matching maps calculated using a typical dynamic diffusion sequence consisting of repeating orthogonal directions. Implementation of the nested cubes gradient table would therefore efficiently collect data for DTI and dynamic measurements in a single acquisition, reducing clinical scan time.Conclusion
The proposed nested cubes acquisition scheme allows for simultaneous collection of data necessary to compute the diffusion tensor along with data capable of evaluating the temporal dynamics of ADC and eADC during evolving cellular edema in neurological conditions including epilepsy and cortical spreading depolarization in ischemic stroke9, traumatic brain injury10, and migraine aura11.Acknowledgements
We are grateful to the healthy volunteers who made data collection for this study possible. Data was collected under protocol 98-CC-0019. This study was supported by the Center for Neuroscience and Regenerative Medicine.References
1 Bartsch, T. et al. Selective neuronal vulnerability of human hippocampal CA1 neurons: lesion evolution, temporal course, and pattern of hippocampal damage in diffusion-weighted MR imaging. J Cereb Blood Flow Metab 35, 1836-1845, doi:10.1038/jcbfm.2015.137 (2015).
2 Diehl, B. et al. Postictal diffusion-weighted imaging for the localization of focal epileptic areas in temporal lobe epilepsy. Epilepsia 42, 21-28, doi:10.1046/j.1528-1157.2001.19500.x (2001).
3 Van Harreveld, A. Changes in volume of cortical neuronal elements during asphyxiation. Am J Physiol 191, 233-242, doi:10.1152/ajplegacy.1957.191.2.233 (1957).
4 Van Harreveld, A. Changes in the diameter of apical dendrites during spreading depression. Am J Physiol 192, 457-463, doi:10.1152/ajplegacy.1958.192.3.457 (1958).
5 Cheng, J., Shen, D., Yap, P. T. & Basser, P. J. Single- and Multiple-Shell Uniform Sampling Schemes for Diffusion MRI Using Spherical Codes. IEEE Trans Med Imaging 37, 185-199, doi:10.1109/TMI.2017.2756072 (2018).
6 Cundy, H. a. R., A. in Mathematical Models Ch. 3.10.6, 135-136 (Tarquin, 1989).
7 Pierpaoli C., W. L., Irfanoglu M.O., Barnett A., Basser P., Chang L-C, Koay C. , Pajevic S., Rohde G., Sarlls J., and Wu M. in ISMRM 18th annual meeting.
8 Jones, D. K., Horsfield, M. A. & Simmons, A. Optimal strategies for measuring diffusion in anisotropic systems by magnetic resonance imaging. Magn Reson Med 42, 515-525 (1999).
9 Latour, L. L., Hasegawa, Y., Formato, J. E., Fisher, M. & Sotak, C. H. Spreading waves of decreased diffusion coefficient after cortical stimulation in the rat brain. Magn Reson Med 32, 189-198, doi:10.1002/mrm.1910320207 (1994).
10 Eriksen, N. et al. Neurostereologic Lesion Volumes and Spreading Depolarizations in Severe Traumatic Brain Injury Patients: A Pilot Study. Neurocrit Care 30, 557-568, doi:10.1007/s12028-019-00692-w (2019).
11 Hadjikhani, N. & Vincent, M. Neuroimaging clues of migraine aura. J Headache Pain 20, 32, doi:10.1186/s10194-019-0983-2 (2019).
Figures